I was eyeing a little-known play for a potential move…
While C3.ai, Inc. (NYSE: AI) took a breather from its recent run for a day — probably because earnings were after hours and traders were playing it safe — there was another AI stock on my radar.
And I was watching it for one of my specific patterns.
That pattern played out after 9:45 a.m. and the stock rocketed 39% higher!
So today I’ll break down why this play worked so well…
Plus, I’ll share how you can recognize when to lock in any potential gains and walk away.
This Pattern Played Out And Created A 39% Move
The red-to-green pattern works best in stocks that had a strong previous day but open red and look like a first red day.
Short sellers love to guess the top in these stocks. They like to take positions in the morning and use the previous day’s close as their risk…
That’s why we often see a stock drop early in the day … But as dip buyers and stubborn shorts from the previous day start to buy, the stock slowly starts to climb back up.
Then the stock crosses above the previous day’s close — the red-to-green level — and boom!
It sparks a short squeeze, baby.
And that’s the setup I was looking for in CXApp Inc. (NASDAQ: CXAI) yesterday morning.
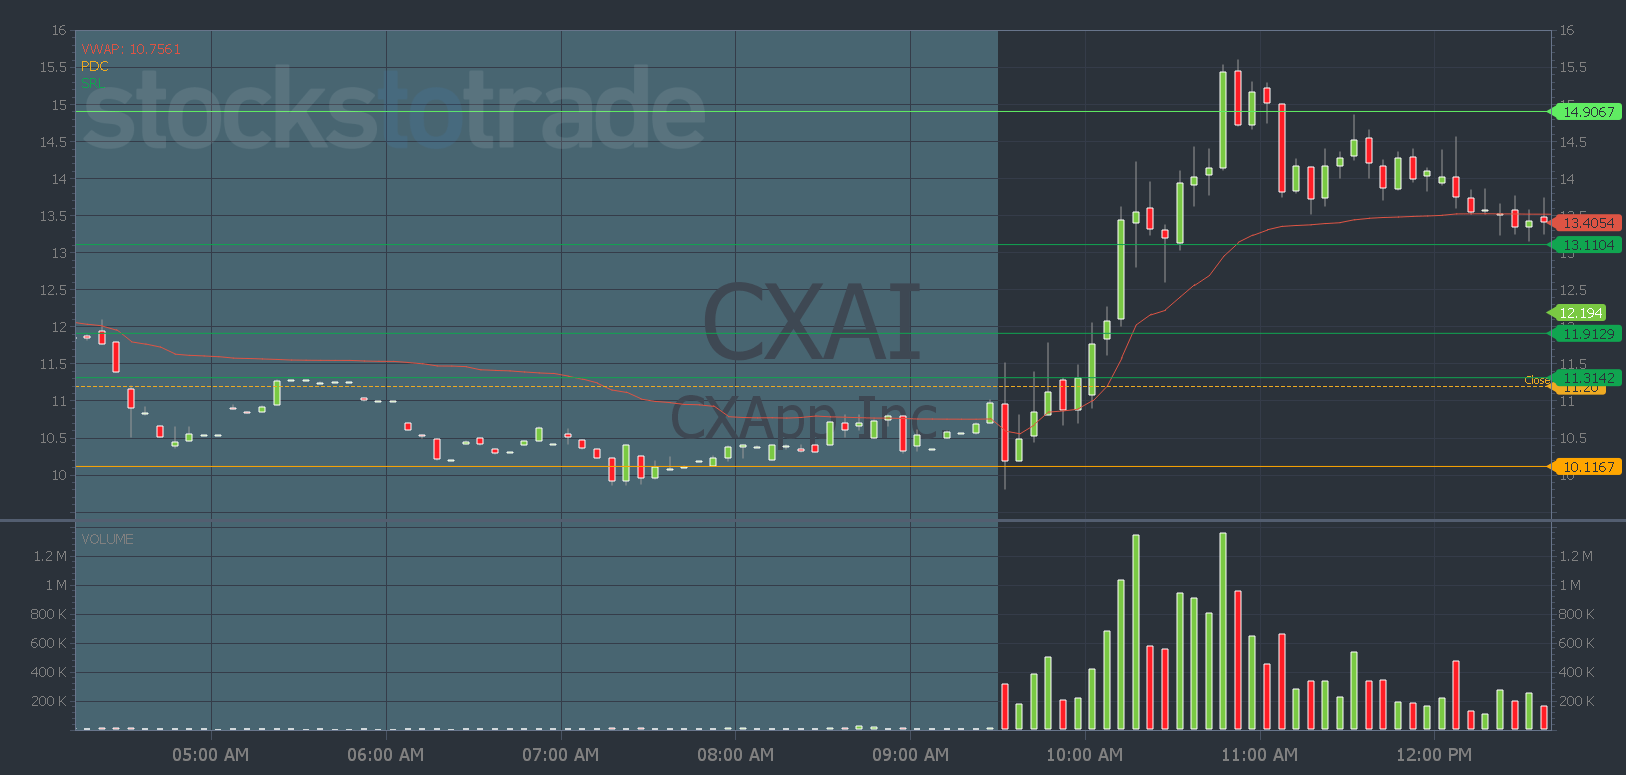
CXAI chart: 1-day, 5-minute candle — courtesy of StocksToTrade.com
And the pattern played out — the stock had an almost 40% gain from the red to green level to the high of the day.
Here’s how you can spot stocks that fit this pattern…
Criteria To Look For a Red To Green Pattern
To identify a good red-to-green setup, we look for a few criteria…
First, the stock should close near or at the high of the day on the day before. This is important because it shows strength and momentum.
Second, we prefer stocks that are breaking out to multi-week, multi-month, or even all-time highs. This indicates that the stock has the potential for a significant move.
Lastly, we want to focus on stocks in hot sectors, such as biotechs or artificial intelligence stocks which are hot right now.
CXAI checked all three boxes for a potential red-to-green move yesterday…
- It closed at or around its daily high on Tuesday.
- It was breaking out to new multi-week highs.
- It’s in the hot AI sector.
So it was a great candidate for the move. But once you enter on the red-to-green move, then what?
How do you know where to exit your trade?
You can stick to a 3 to 1 risk-to-reward ratio, you can use Oracle’s support and resistance levels, or you can use a resistance level you see on the chart.
You can see on the daily chart that CXAI spiked into an Oracle resistance level. And to the highs from its recent run.
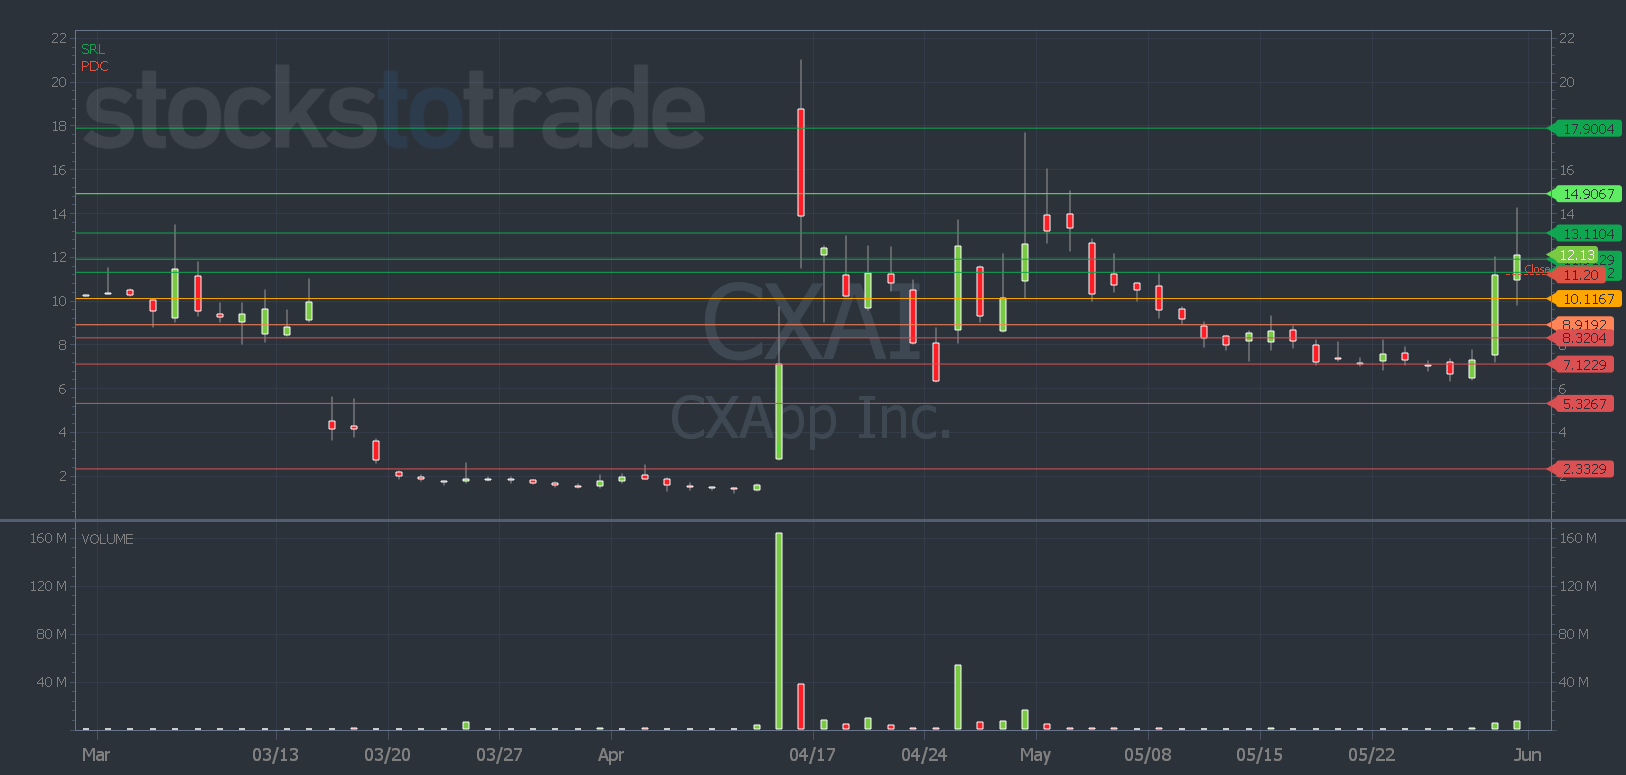
CXAI chart: 3-month, daily candle — courtesy of StocksToTrade.com
By following the criteria for the red-to-green pattern and having a well-defined plan, you can learn to take advantage of these kinds of moves.
It’s important to study these setups, take notes, and learn from them. Not every trade will work out, but by being selective and disciplined, you can improve your trading skills and grow your account.
See how Tim Sykes’ “secret weapon” can help you plan and manage trades.
He put together a special presentation to share it — stay tuned to the end for an important announcement!
Have a great day everyone. See you back here tomorrow.
Tim Bohen
Lead Trainer, StocksToTrade