
Patterns are just one variable to consider before entering a trade.
Before you jump into a trade based solely on pattern recognition, look at the bigger picture…
Where’s your risk? How much size will you take based on your risk tolerance? What’s your goal?
Those are all essential parts of your trading plan…
But what about resistance?
Where are the sellers and shorts that can dump shares on you and send the stock downwards?
Unfortunately, it could be a major reason for your losses.
So today I’ll show you an example of how to consider important levels when choosing your patterns and stocks to trade…
Why Trading Isn’t Just About Patterns
Yesterday in the SteadyTrade Team morning webinar, a member asked if Evofem Biosciences, Inc. (NASDAQ: EVFM) was a watch for a red-to-green move.
Learn how to trade red-to-green moves here.
I said if you take the red to green move, I think you’re early…
Why?
I liked the potential break above $1.40 more.
Because on Wednesday, EVFM topped out at $1.40 at 1 p.m. and 4 p.m.
It was a double top.
So if you bought the red-to-green move above $1.33, there was a very good chance you would buy into a triple top.
You can see that after the market opened, EVFM went from red to green but double topped again into resistance at $1.40.
Check out the chart…
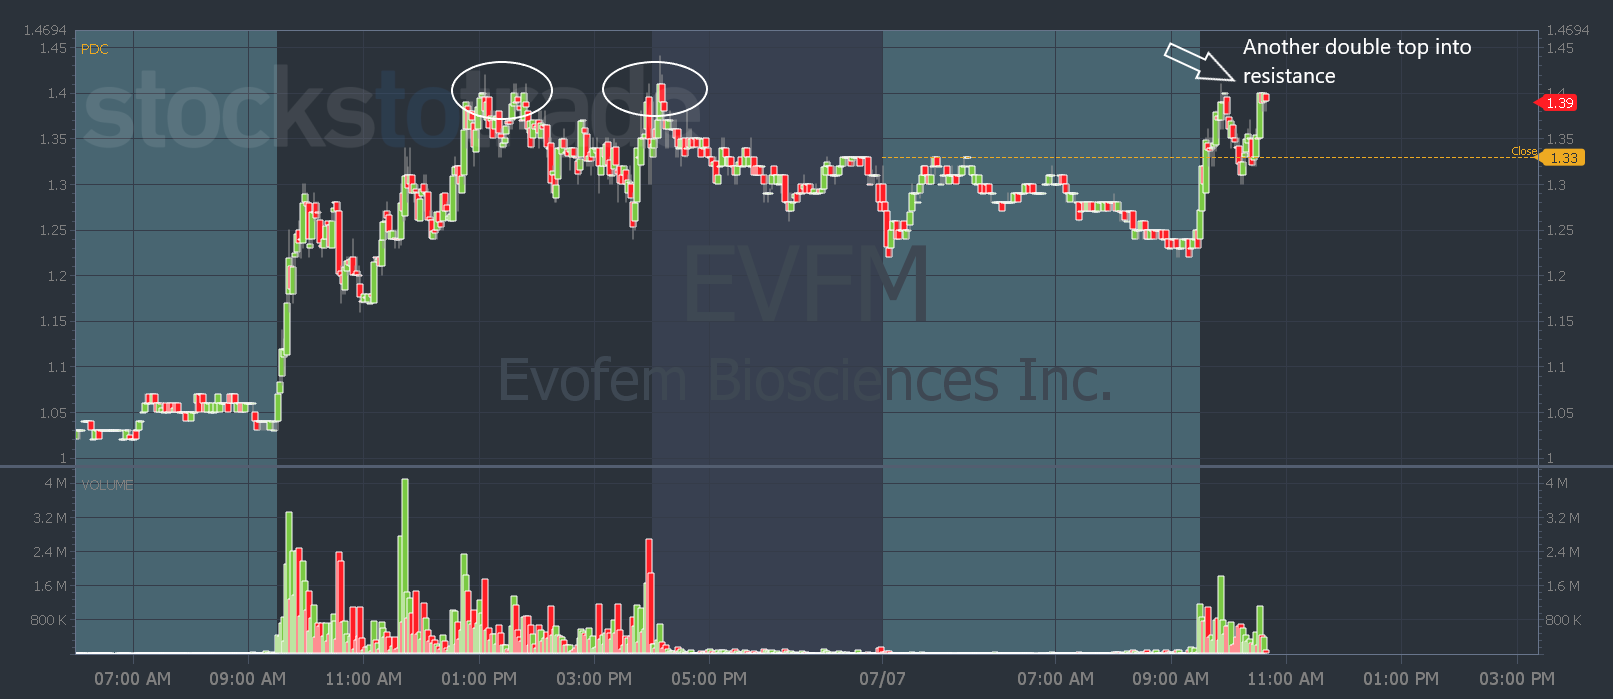
EVFM chart: 2-day, 2-minute candle — courtesy of StocksToTrade.com
That’s why I liked the $1.40 break more. Because if it broke above that level, it would be above resistance.
Learn the basics of support and resistance here.
And later yesterday morning is when the stock made its move…
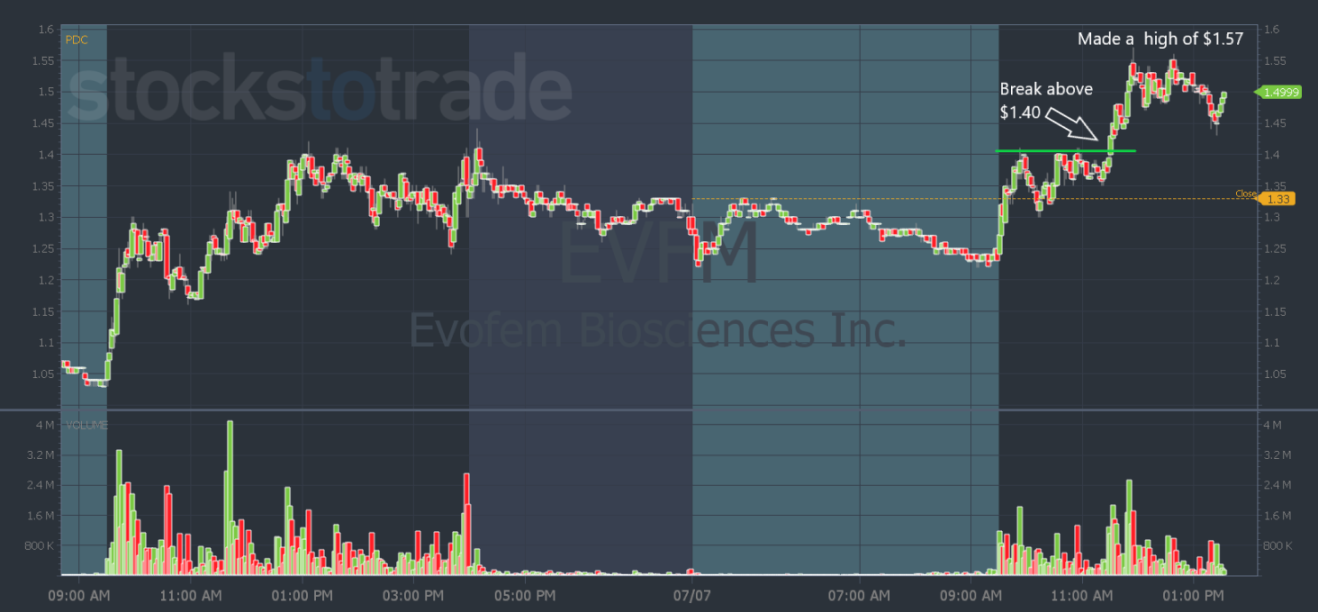
EVFM chart: 2-day, 2-minute candle — courtesy of StocksToTrade.com
It broke above $1.40 and made a high of $1.57.
So today, what’s the level I’ll watch?
Again, I want to see it break above yesterday’s highs. I’m not sure if EVFM has much juice left, but the less resistance overhead the better.
That’s what makes breakouts such powerful moves.
And it’s why it’s so important to zoom out on the chart…
Know where the buyers and sellers are. Look for entries where everyone else buys.
And avoid entries with a resistance level close by. That’s where longs will sell and shorts enter positions.
You want to combine key levels into your patterns and trading plans so you can avoid getting sold into.
If you’re not sure how to do it, watch this video.
And let me help you in the SteadyTrade Team. You can get answers like the one above in real time, before a mistake costs you money.
See you there for Money Monday!
Have a great day everyone.
Tim Bohen
Lead Trainer, StocksToTrade