
The more time you spend studying charts and price action, the more you’ll see patterns repeat.
As your pattern recognition gets better, you’ll start to know what’s tradeable and what’s not. But you’ll also come across charts that don’t fit.
This Weird Breakout Pattern Shows Up Week After Week

Table of Contents
The Big Picture
When you see a chart that doesn’t make sense, that tells you something weird is going on, okay?
Now, that’s not necessarily a bad thing. Sometimes it’s a regular event that you aren’t familiar with. Other times, it’s an outlier.
Either way, pay attention to what your brain is telling you, because if something doesn’t make sense you shouldn’t be trading it.
With that in mind, let’s look at two that come up every once in a while.
The Buyout
The first chart isn’t all that uncommon, but it sometimes catches new traders off guard.
Take a look at this Pacira BioSciences, Inc. (NASDAQ: PCRX) chart from yesterday morning (Oct. 8):
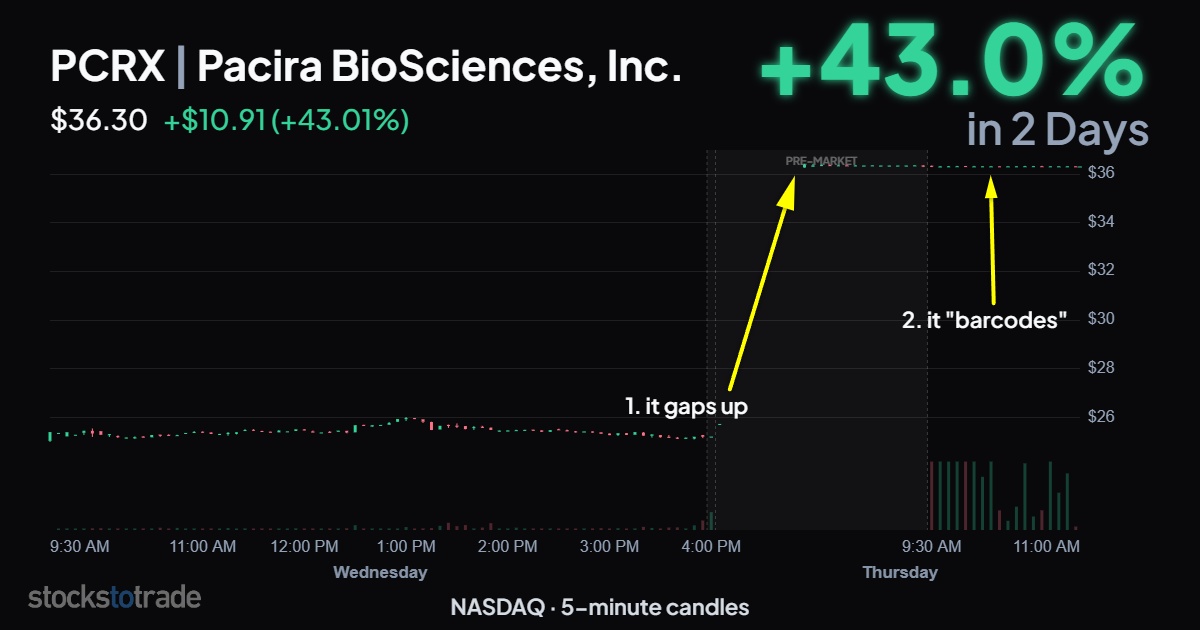
PCRX 10/7-8/26, 5-min candles, classic buyout chart pattern
Notice how PCRX gapped up and then traded straight sideways with almost zero price movement? We call that tight sideways price action barcoding.
When you see a chart that gaps up like that and then just barcodes, the very first thing you want to do is check the news.
I’d guess that 999 times out of 1,000 you’ll see that it’s a buyout:

The press release went on to say that “Vitaris has agreed to acquire all of the outstanding shares of common stock of Pacira for $36.50 in cash.” That’s almost exactly where PCRX was trading, okay?
The next chart pattern is a little more rare. But on Wednesday (Oct 7) everyone was posting on X about it.
The Liquidity Sweep
Here’s the Baiya International Group Inc. (NASDAQ: BIYA) premarket chart up until 8:20 a.m. ET:
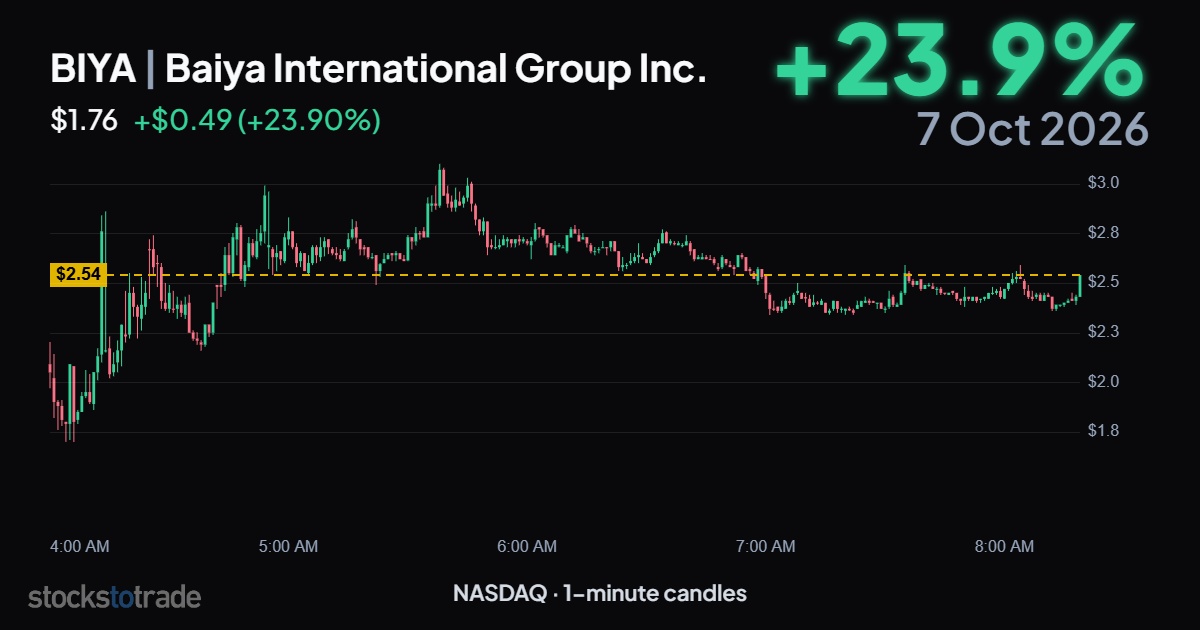
BIYA 10/7/27/26, 1-min candles, premarket until 8:20 a.m.
It looks like a typical penny stock chart you might consider trading, right?
But look what happened minutes later…
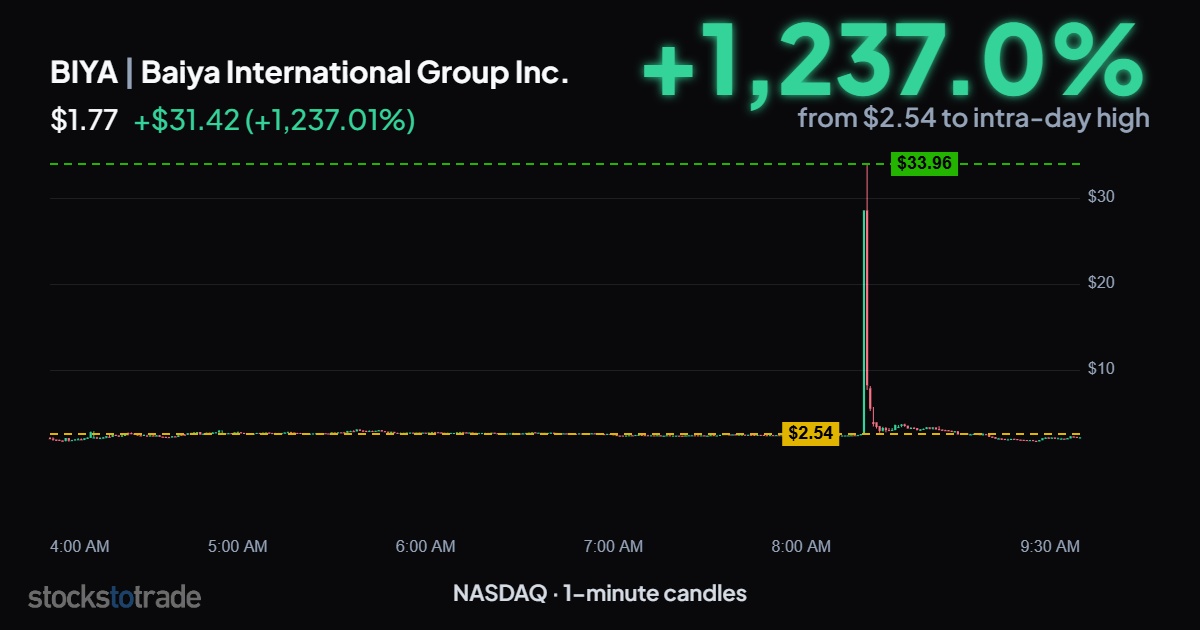
BIYA 10/7/26, 1-min candles, liquidity sweep
Now, when you’ve got a stock that goes from $2 to $34 in seconds, you have to assume something’s screwed up, okay?
In this case, it was likely an algo-triggered liquidity sweep. That’s where an algo triggers automatic stop losses. It can happen to both shorts and longs.
It turned out that all those trades got busted. Nasdaq stepped in and canceled them.
That made short sellers who got caught in it happy. It also made a lot of longs very angry.
Some long-biased traders found themselves in unsettled trades hours later. One guy posted on X that he had a +$55k win turn into a -$3k loss.
Now, busted trades don’t happen very often. I’ve seen it maybe 10 times in 20 years. So, it’s rare, but it happens.
My Take
For me, I would just never participate in that move anyway. I see something like that, and all I can think is “man, something’s weird here.”
One reason I like to point out charts like this is to save you time. Neither of those stocks was tradable. If you know what to look for, it’s easy to take a quick look at the chart and have a pretty good idea of what’s happening.
Remember, the chart always tells a story.
Watchlist
OLB Group, Inc. (NASDAQ: OLB) is on a multi-day run after announcing a share buyback and suspension of its at-the-market (ATM) offering program.
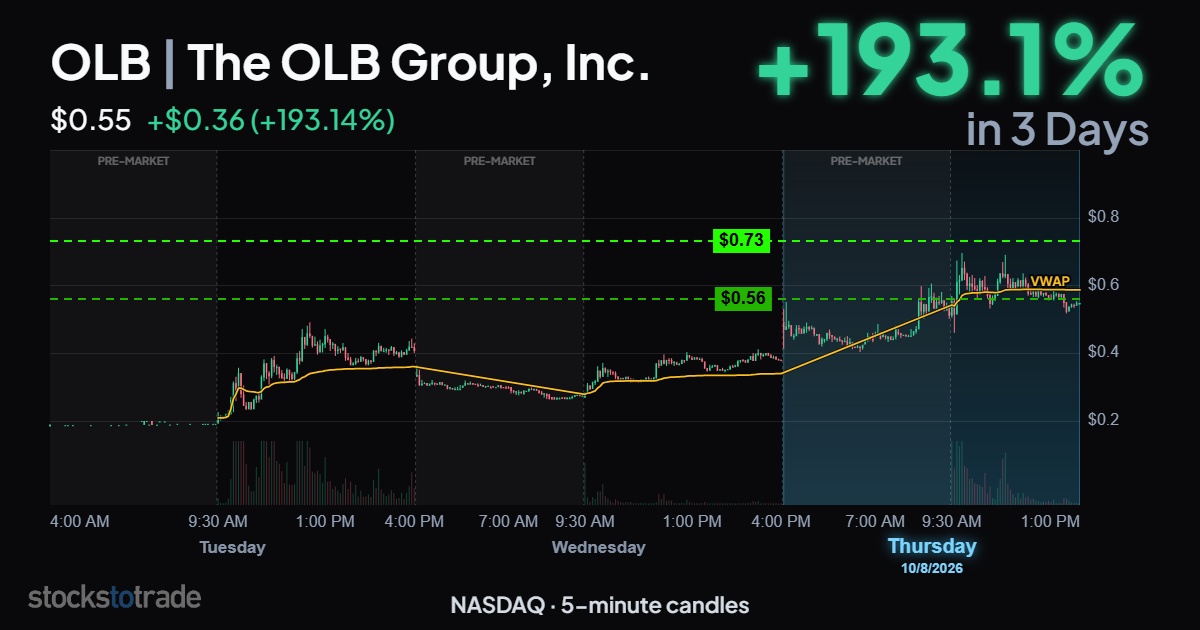
OLB 10/6-8/26, multi-day runner
Yesterday morning, OLB double-tapped $0.70, just below major resistance (M/R). Going into the afternoon, it was consolidating close to both VWAP and the Oracle signal ($0.56).
If it holds, I like it at the Oracle signal with a target into the M/R. If it keeps getting rejected at the M/R but holds VWAP, look for breaks above the M/R.
On My Radar
- According to the WTO, AI investment is driving global trade to new heights
- SpaceX (NASDAQ: SPCX), Oracle (NASDAQ: ORCL), and Broadcom (NASDAQ: AVGO) are looking at huge financing deals for AI chips
- Early retirement may not be good for your brain (I think trading keeps you sharp as a tack and Higgins agrees)
- No Brainer: 1-year of Jeff Zananiri’s Monthly Money Flow research for $1