

Yunji Inc. stocks have been trading up by 122.76 percent amid surging investor optimism over improved e-commerce growth prospects.
Market Insights For Active YJ Traders
- Intraday price spiked from roughly the $1s into the mid-teens before closing near $3.40, signaling an extreme liquidity event and aggressive momentum in Yunji Inc.
- Weekly chart shows a quiet base in the low $1s followed by a single week explosion up to $4.80, then a sharp pullback toward $2.74.
- Valuation for YJ screens as deeply discounted, with a price-to-sales near 0.13 and price-to-book around 0.04 despite over $1.35B in total assets.
- Balance sheet lists about $219.37M in cash and short-term investments against roughly $274.41M in total liabilities, giving Yunji Inc. room to navigate short-term swings.
- Traders are tracking whether recent volatility turns into a new uptrend or fades back into the prior low-volume range.
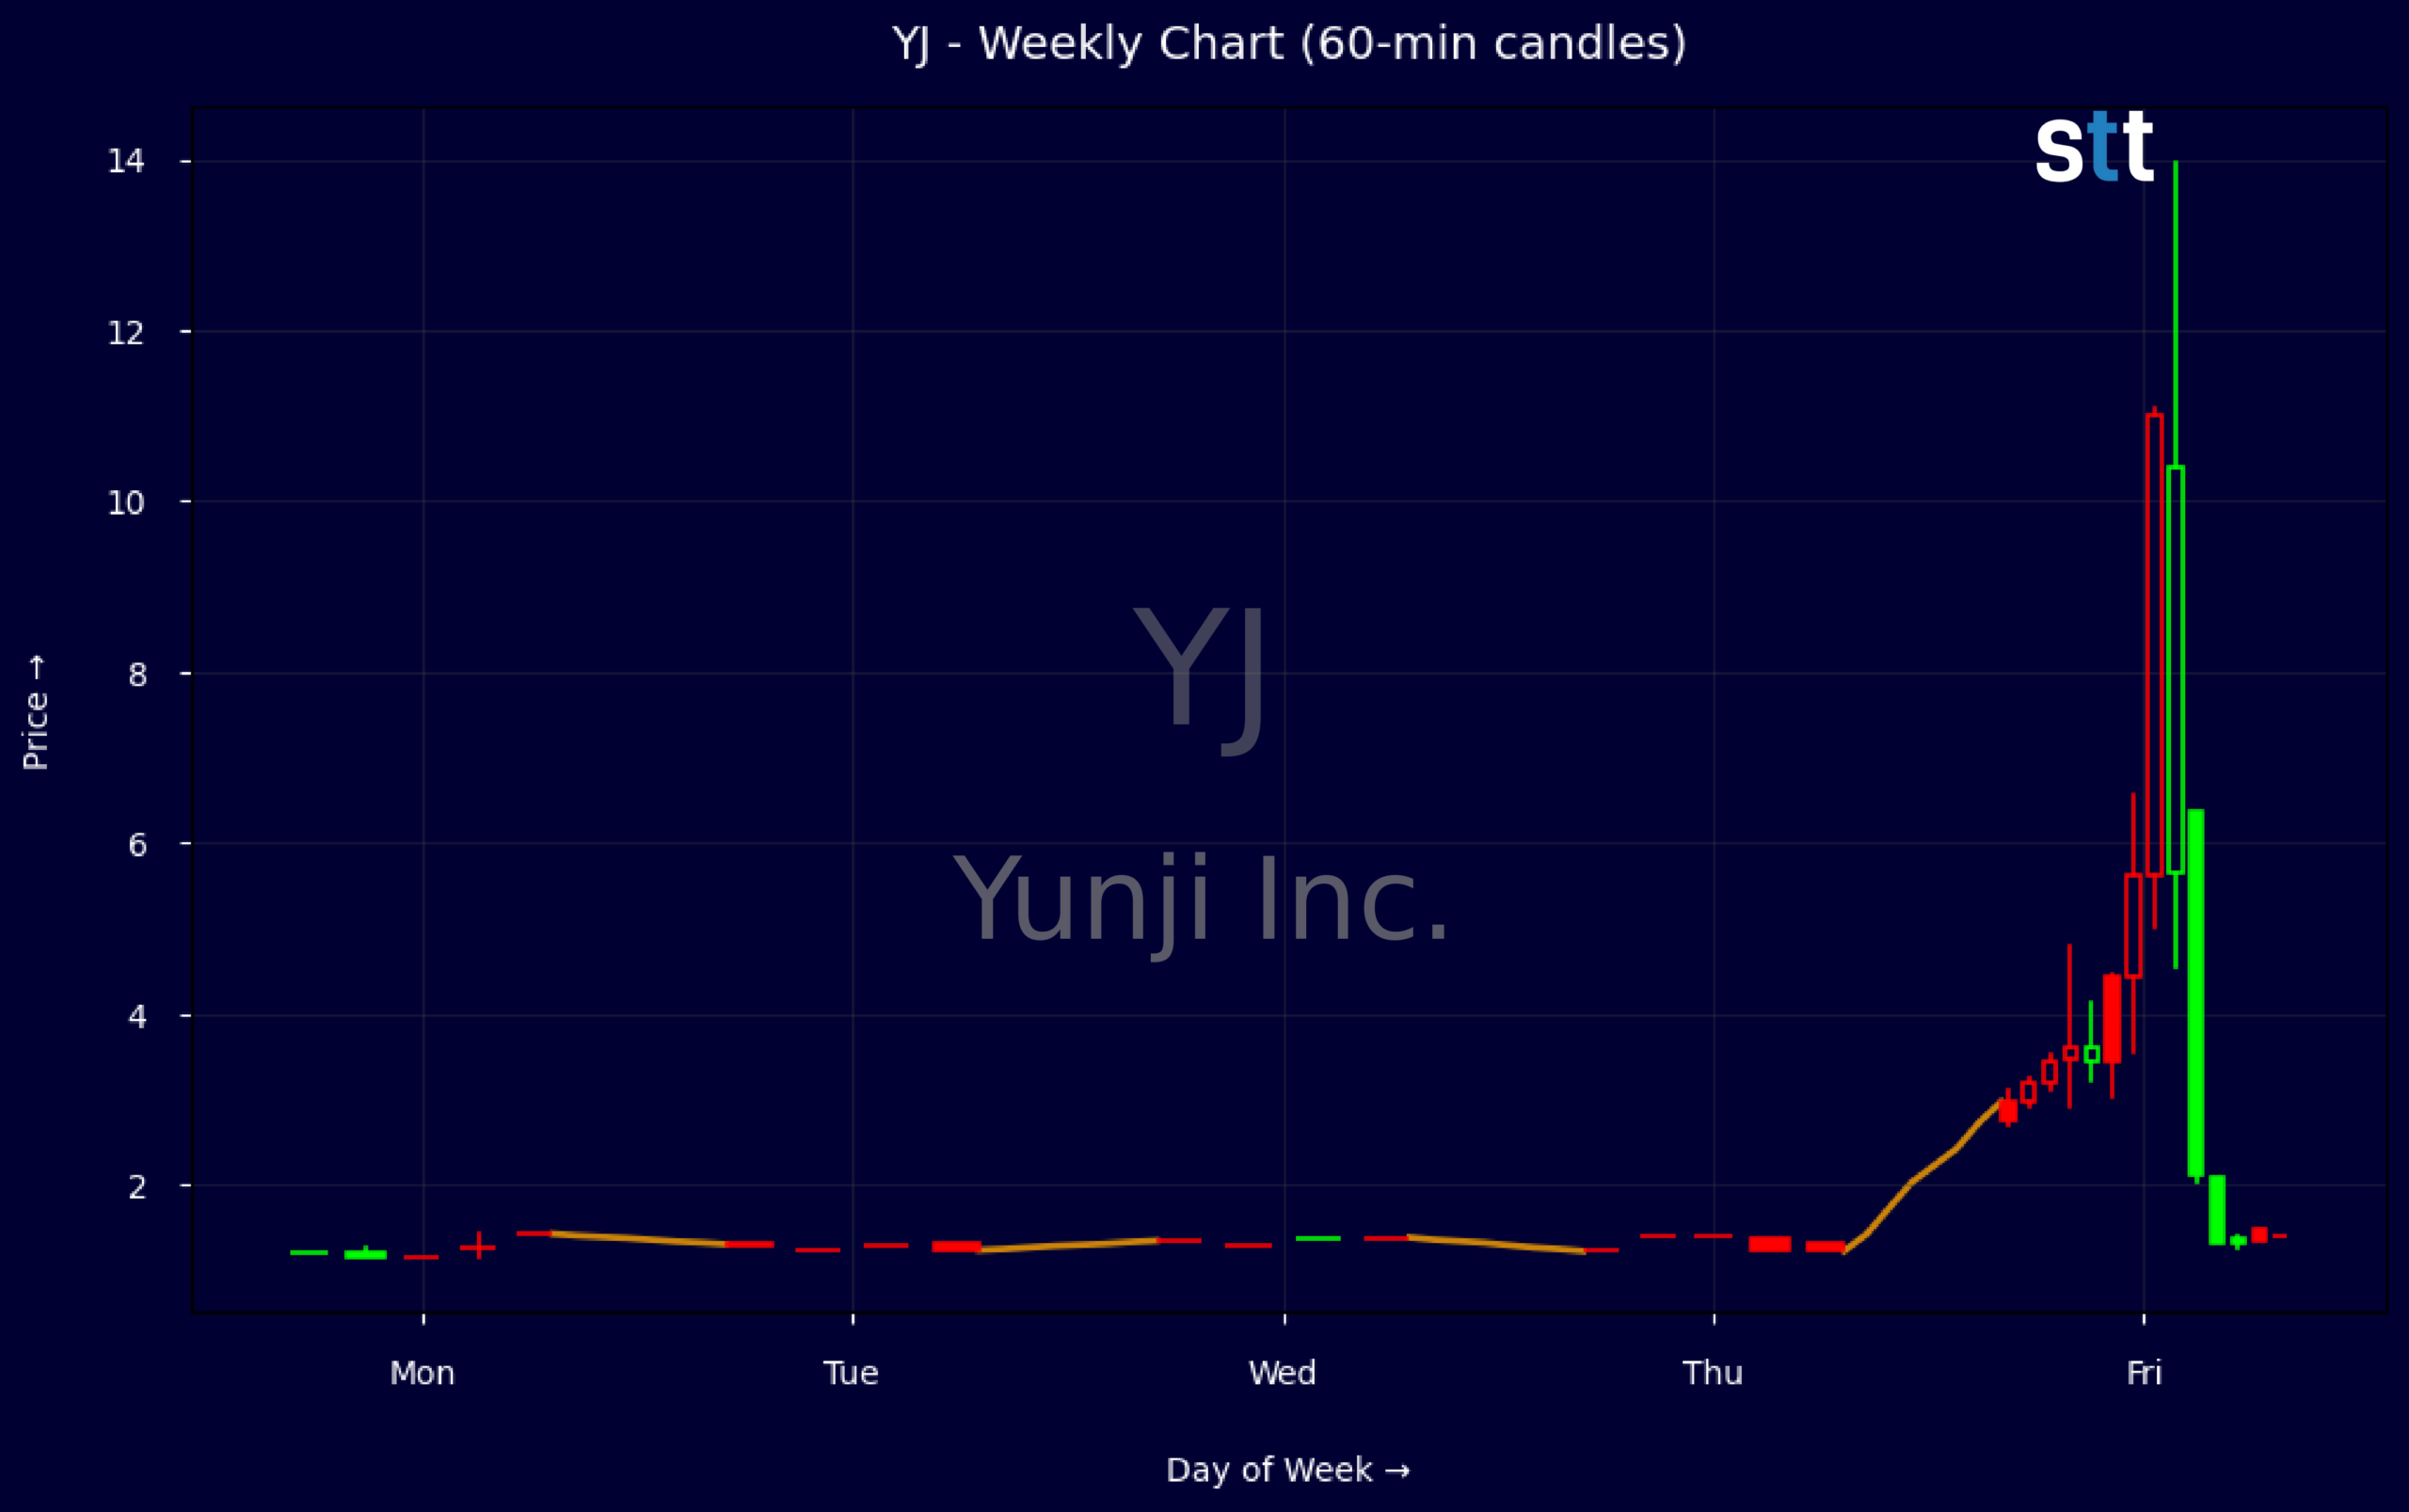
Weekly Update Aug 03 – Aug 07, 2026: On Saturday, August 08, 2026 Yunji Inc. stock [NASDAQ: YJ] is trending up by 122.76%! Discover the key drivers behind this movement as well as our expert analysis in the detailed breakdown below.
Consumer Discretionary industry expert:
Analyst sentiment – negative
Yunji (YJ) sits in a distressed but asset-rich position within China’s discretionary e-commerce niche. Revenue of ~$418m masks structurally negative growth (three- and five-year revenue CAGR both -100), and ROIC at -12.9% highlights ongoing value destruction despite modest ROA of 0.38%. The balance sheet is unusually clean: equity of ~$1.08bn vs. only ~$12m in noncurrent liabilities and long-term debt of just ~$7.8m, driving leverage of 1.3 and book value per share of 189.87 against a 0.04x P/B, signaling deep market skepticism rather than insolvency risk.
Technically, YJ just executed a violent upside break. The stock traded tightly between 1.21–1.40 for four sessions, then exploded to an intraday high of 4.80 before closing at 2.74, implying a multi-bagger intraday spike likely driven by a volume surge and short-covering. The dominant trend is now short-term bullish but highly unstable. Actionable level: 2.20–2.30 is the key support to watch; a sustained hold above 3.00 on strong volume would confirm ongoing momentum.
More Breaking News
- WFF Stock Plunges Then Bases As Volatility Grips Chart
- NRXP Stock Eyes FDA Catalyst As Ketamine Momentum Builds
- CareDx CDNA Soars After Earnings Beat And Guidance Hike
- MPT Stock Slides As Traders Weigh Debt, Dividend Risk
With no identifiable company-specific news, the move appears technical and speculative rather than fundamentally driven, especially versus Consumer Discretionary and Retail – Discretionary peers that typically trade nearer 1–2x book and on positive revenue trajectories. YJ’s extreme discount and net-cash profile make it a trading vehicle, not a core holding. Base case: mean reversion toward 2.00 if momentum fades, upside trading band 3.50–4.00 on continuation, structural resistance near 4.80.
Quick Financial Overview
Yunji Inc. (YJ) just printed the kind of chart that grabs every short-term trader’s attention. Weekly data show the stock grinding between roughly $1.21 and $1.40 before suddenly launching to a $4.80 high and closing that week at $2.74. That move is a massive expansion in range and tells you fresh demand hit the tape, even if the close shows sellers pushing back hard.
The intraday snapshot backs this up. Price opened around the high $1s and ripped into the $13–$14 zone before fading to a $3.40 close on heavy volatility. For traders, that’s classic blow-off behavior: huge upside extension, then profit-taking and possible short pressure into the close. If YJ can now hold above the prior $1.20–$1.40 zone, it shifts from dead money to a live trading vehicle.
Under the hood, the financials paint a complex picture. Revenue sits near $417.65M, but multi-year revenue trends show a steep decline, so this is not a growth story right now. At the same time, Yunji Inc. reports total assets around $1.35B, equity near $1.08B, and cash plus short-term investments of about $219.37M, versus total liabilities of roughly $274.41M. With a price-to-sales near 0.13 and price-to-book near 0.04, YJ trades at a deep discount, which can fuel sharp re-rating moves when sentiment flips, but the long revenue slide is the trade-off every active trader must weigh.
Conclusion
Yunji Inc. is now on every volatility scanner, and for good reason. A quiet base near $1 followed by a vertical spike toward the teens and a close near $3.40 tells you liquidity and emotion just flooded into YJ. The key question for short-term traders is simple: was that a one-day anomaly, or the first shot of a broader re-pricing toward something closer to its asset and book value metrics?
From a risk perspective, the chart demands respect. Weekly candles show a full reset from a low-volume drift to wide intraday swings, which means position sizing and hard stops matter more than usual. At the same time, the balance sheet and low valuation ratios give Yunji Inc. some fundamental cushion, which can support aggressive speculative flows when the broader market is hungry for beaten-down names. For educational and research purposes, traders should map out the prior base around $1.20–$1.40 as a key defense zone and the recent $4–$5 area as the first serious resistance band. As I tell my students, “Your edge in names like YJ comes from respecting the volatility, letting the levels define your risk, and never confusing a fast trade with a safe trade.” In fast-moving names like this, disciplined preparation matters even more than the setup itself. As Tim Bohen, lead trainer with StocksToTrade says, “If you’re still guessing at the end of your analysis, it’s probably not a trade worth taking.”
This is stock news, not investment advice. StocksToTrade News delivers real-time stock market updates tailored to highlight the key catalysts driving short-term price movements. Our coverage is designed for active traders and investors who thrive in fast-moving markets, with a focus on volatile sectors like penny stocks, AI stocks, Robinhood stocks and other momentum plays. From earnings reports and FDA approvals to mergers, new contracts, and unusual trading volume, we break down the events that can spark significant price action.
Looking to level up your trading game? Explore StocksToTrade, the ultimate platform for traders. With powerful tools designed for swing and day trading, integrated news scanning, and even social media monitoring, StocksToTrade keeps you one step ahead.
Check out our quick startup guide for new traders!
- How to Read Stock Charts: A Guide for Beginners
- Trading Plan: 6 Steps to Create One
- How To Create a Stock Watchlist
Ready to build your watchlists? Check out these curated lists:
Once your watchlist is set, take the next step and trade with confidence using StocksToTrade’s robust platform. Don’t miss out — grab your 14-day trial for just $7 and experience the edge you need to thrive in today’s fast-paced markets.