

XTI Aerospace Inc. Common Stock faces heightened downside pressure after negative sentiment, with stocks have been trading down by -14.97 percent
Market Insights For Active XTIA Traders
- Price has faded from a $2.21 weekly high to sub-$1.80, showing sellers in control short term.
- Intraday action saw a sharp intraday drop from above $2.10 to the $1.80 area, signaling aggressive supply.
- Deep negative margins and returns highlight a high-risk turnaround profile for XTI Aerospace Inc. Common Stock.
- Weak liquidity ratios point to funding and dilution risk that traders must factor into any setup.
- Rising revenue growth battles heavy cash burn, keeping XTIA firmly in speculative territory.
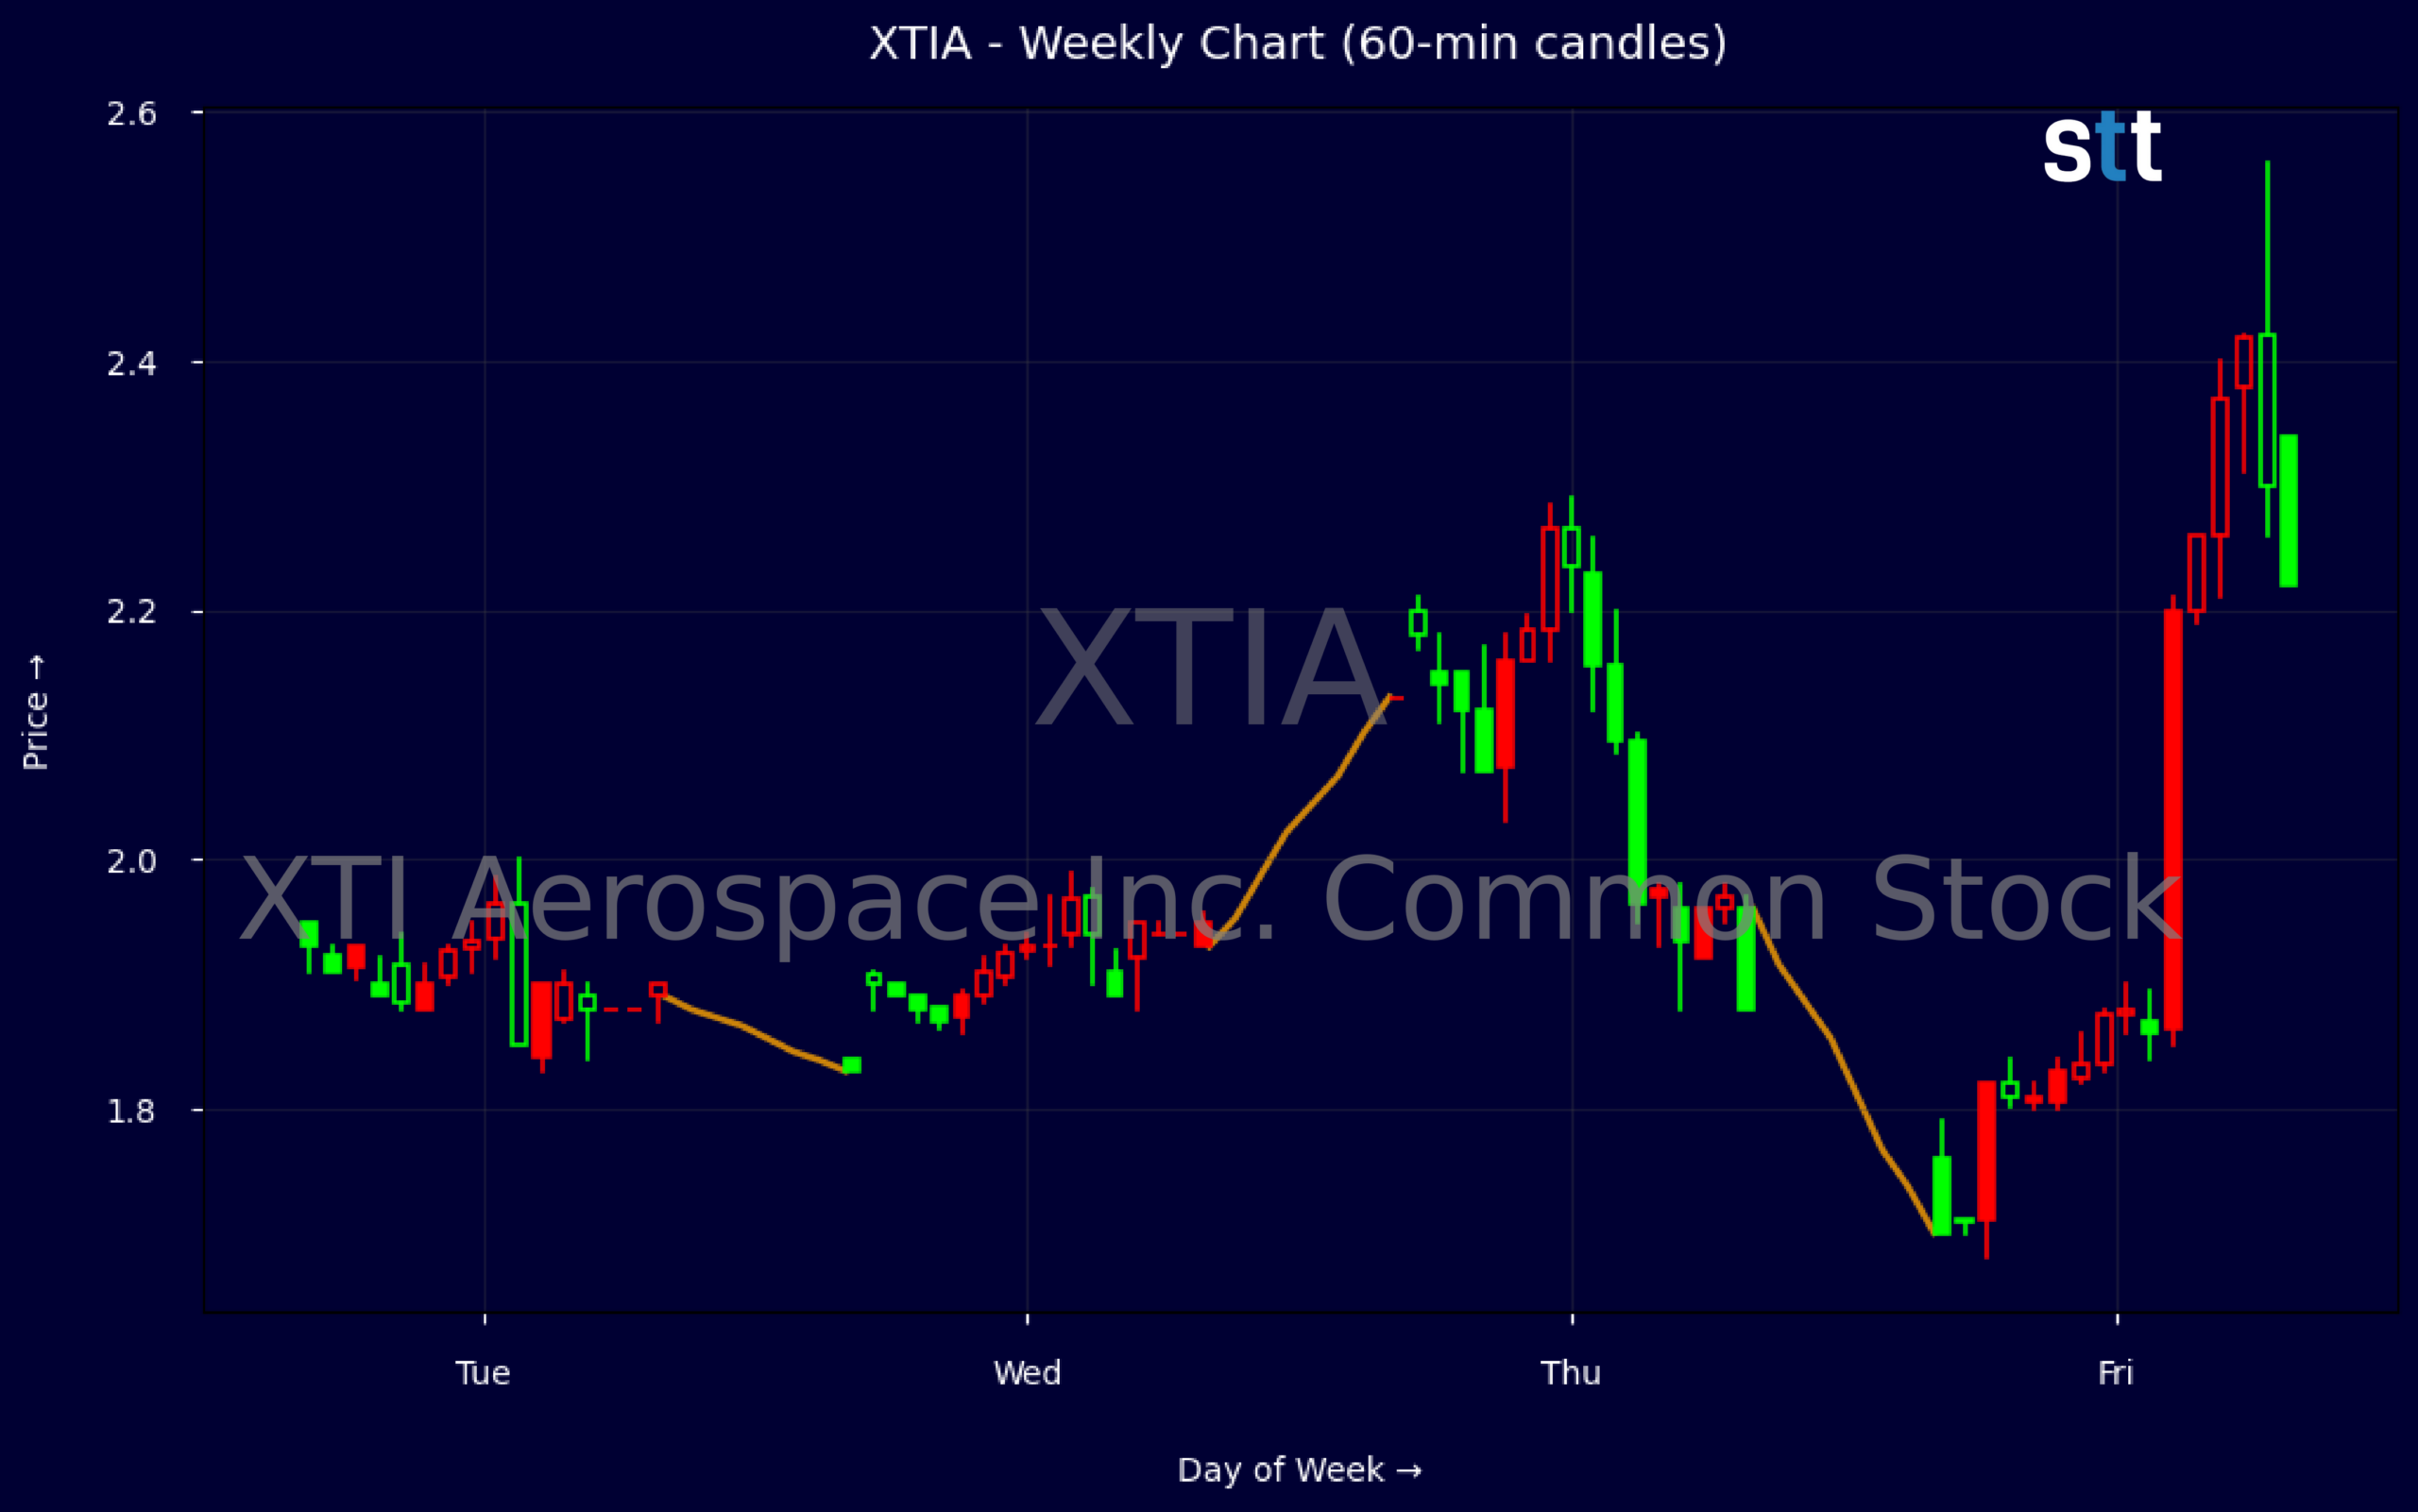
Weekly Update May 25 – May 29, 2026: On Sunday, May 31, 2026 XTI Aerospace Inc. Common Stock stock [NASDAQ: XTIA] is trending down by -14.97%! Discover the key drivers behind this movement as well as our expert analysis in the detailed breakdown below.
Industrials industry expert:
Analyst sentiment – negative
XTIA sits in a structurally weak financial position despite decent top-line momentum. Revenue of ~$22.5m with 3/5‑year CAGRs of ~59%/37% shows solid growth, but margins are catastrophic (EBIT margin ~‑144%, net margin ~‑184%) and ROA below ‑100% signals value destruction. Liquidity is fragile with current ratio 0.6, quick ratio 0.3, and heavily negative equity (book value per share ‑$0.69), leaving the balance sheet effectively insolvent and dependent on external financing.
Technically, XTIA trades like a high‑beta microcap with poor sponsorship. Weekly prices swung between $1.68 and $2.21, failing to hold the spike to $2.21 and closing near $1.76, indicating sellers in control and a short‑term downtrend from the $2.20 zone. Intraday 5‑minute candles show low, inconsistent volume, with sharp fades on any upticks. The actionable level is $1.65–1.70; below that, expect acceleration lower, while $2.10–2.20 is the first significant supply zone for reactive shorts.
More Breaking News
- SNDG ETF Slides As Volatility Pressures Bullish Traders
- AVGO Stock Holds High Ground As Broadcom Cash Machine Powers On
- NVDA Stock Rebounds As Traders Weigh Trump Sale News
- WKHS Stock Draws Traders As EV Orders Grow And AI Pivot Emerges
With no meaningful news flow or programmatic backlog disclosures, XTIA lacks visible catalysts relative to Industrials and Aerospace & Defense peers, which generally offer positive ROIC, stable backlogs, and dividends. XTIA trades as a speculative restructuring story with negative tangible equity and reliance on warrant/debt issuance. My verdict is Negative: risk/reward is skewed to the downside. Key resistance is $2.10–2.20; support is thin near $1.50 with potential air pockets below. Only aggressive traders should touch it.
Quick Financial Overview
XTIA shows classic high-volatility, small-cap behavior on the chart. Recent weekly candles reveal a push from roughly the mid-$1.80s up to about $2.21, followed by a sharp rejection and close back near $1.76. That failed push higher suggests breakout buyers were trapped and then forced out, which often leads to choppy, headline-sensitive trading. The intraday 5-minute action confirms that picture, with a slide from above $2.10 down toward $1.80 in one session, showing how quickly bids can disappear when supply hits the tape.
Financially, XTI Aerospace Inc. Common Stock is in a heavy-loss phase. The latest quarterly data shows about $27.70M in total revenue and roughly $5.15M in gross profit, but operating income is deep in the red at around -$10.39M. Net loss for the quarter is roughly -$35.27M, producing margins that sit far below zero and explaining the extreme negative return on assets numbers. For traders, that combination means any positive catalyst can spark fast squeezes, but the base case is still steep, continuing losses.
The balance sheet adds another layer of risk. Current assets of about $50.34M are outweighed by current liabilities near $90.95M, producing a current ratio around 0.6 and working capital deeply negative. Cash of roughly $15.19M gives some runway, but not a wide one against ongoing operating cash outflows of about -$10.45M in the quarter and free cash flow near -$10.59M. With common stock equity in negative territory, the numbers point toward ongoing dependence on external financing, which usually means dilution risk that short-term traders must price into any swing plan.
Conclusion
XTIA sits in a classic high-risk, high-volatility bucket where price is driven by sentiment and liquidity as much as by fundamentals. The recent rejection from the $2.20 area back into the mid-$1.70s shows that buyers could not hold momentum, and the intraday flush reinforces that weak hands can get washed out fast. For traders, XTI Aerospace Inc. Common Stock is best treated as a tactical vehicle, not a long-term comfort hold.
On the numbers, strong top-line growth over the past three and five years is overshadowed by heavy net losses, deeply negative margins, and intense cash burn. Liquidity ratios below 1.0 and negative equity tell you funding risk and potential dilution are real, not theoretical. That backdrop means any long setup in XTIA needs clear levels, tight risk, and defined timeframes. The stock can move, but the odds are shaped by balance-sheet stress.
From here, traders should watch how price behaves around recent lows near the mid-$1.70s and whether any bounce can reclaim and hold the $2.00 area with volume. In environments like this, emotional decision-making is especially dangerous, and having a predefined plan and the discipline to follow it matters more than chasing any single move. As Tim Bohen, lead trainer with StocksToTrade says, “The best trades are the ones you can make without emotion. Plan it, then execute it as if it’s routine.”. Until the company narrows losses or strengthens its balance sheet, this remains a speculative, news-sensitive ticker where discipline matters more than conviction. As I tell my students, “Your edge in names like XTIA doesn’t come from believing the story, it comes from respecting the risk and only trading the levels that the tape actually confirms.” “,”scores”:{“risk-level”:”high”},”trade”:”false
This is stock news, not investment advice. StocksToTrade News delivers real-time stock market updates tailored to highlight the key catalysts driving short-term price movements. Our coverage is designed for active traders and investors who thrive in fast-moving markets, with a focus on volatile sectors like penny stocks, AI stocks, Robinhood stocks and other momentum plays. From earnings reports and FDA approvals to mergers, new contracts, and unusual trading volume, we break down the events that can spark significant price action.
Looking to level up your trading game? Explore StocksToTrade, the ultimate platform for traders. With powerful tools designed for swing and day trading, integrated news scanning, and even social media monitoring, StocksToTrade keeps you one step ahead.
Check out our quick startup guide for new traders!
- How to Read Stock Charts: A Guide for Beginners
- Trading Plan: 6 Steps to Create One
- How To Create a Stock Watchlist
Ready to build your watchlists? Check out these curated lists:
Once your watchlist is set, take the next step and trade with confidence using StocksToTrade’s robust platform. Don’t miss out — grab your 14-day trial for just $7 and experience the edge you need to thrive in today’s fast-paced markets.