

XTI Aerospace Inc. Common Stock sank as investors reacted to negative sentiment, with stocks have been trading down by -14.97 percent.
Market Insights For Active XTIA Traders
- Price faded from a $2.21 high to roughly $1.76 this week, signaling heavy selling into strength.
- Intraday action shows a sharp drop from above $2.10 to around $1.80, highlighting aggressive downside pressure.
- Revenue growth is solid, but XTI Aerospace Inc. Common Stock carries very deep losses and negative equity.
- Thin liquidity, weak margins, and heavy cash burn keep XTIA firmly in high-risk, short-term trading territory.
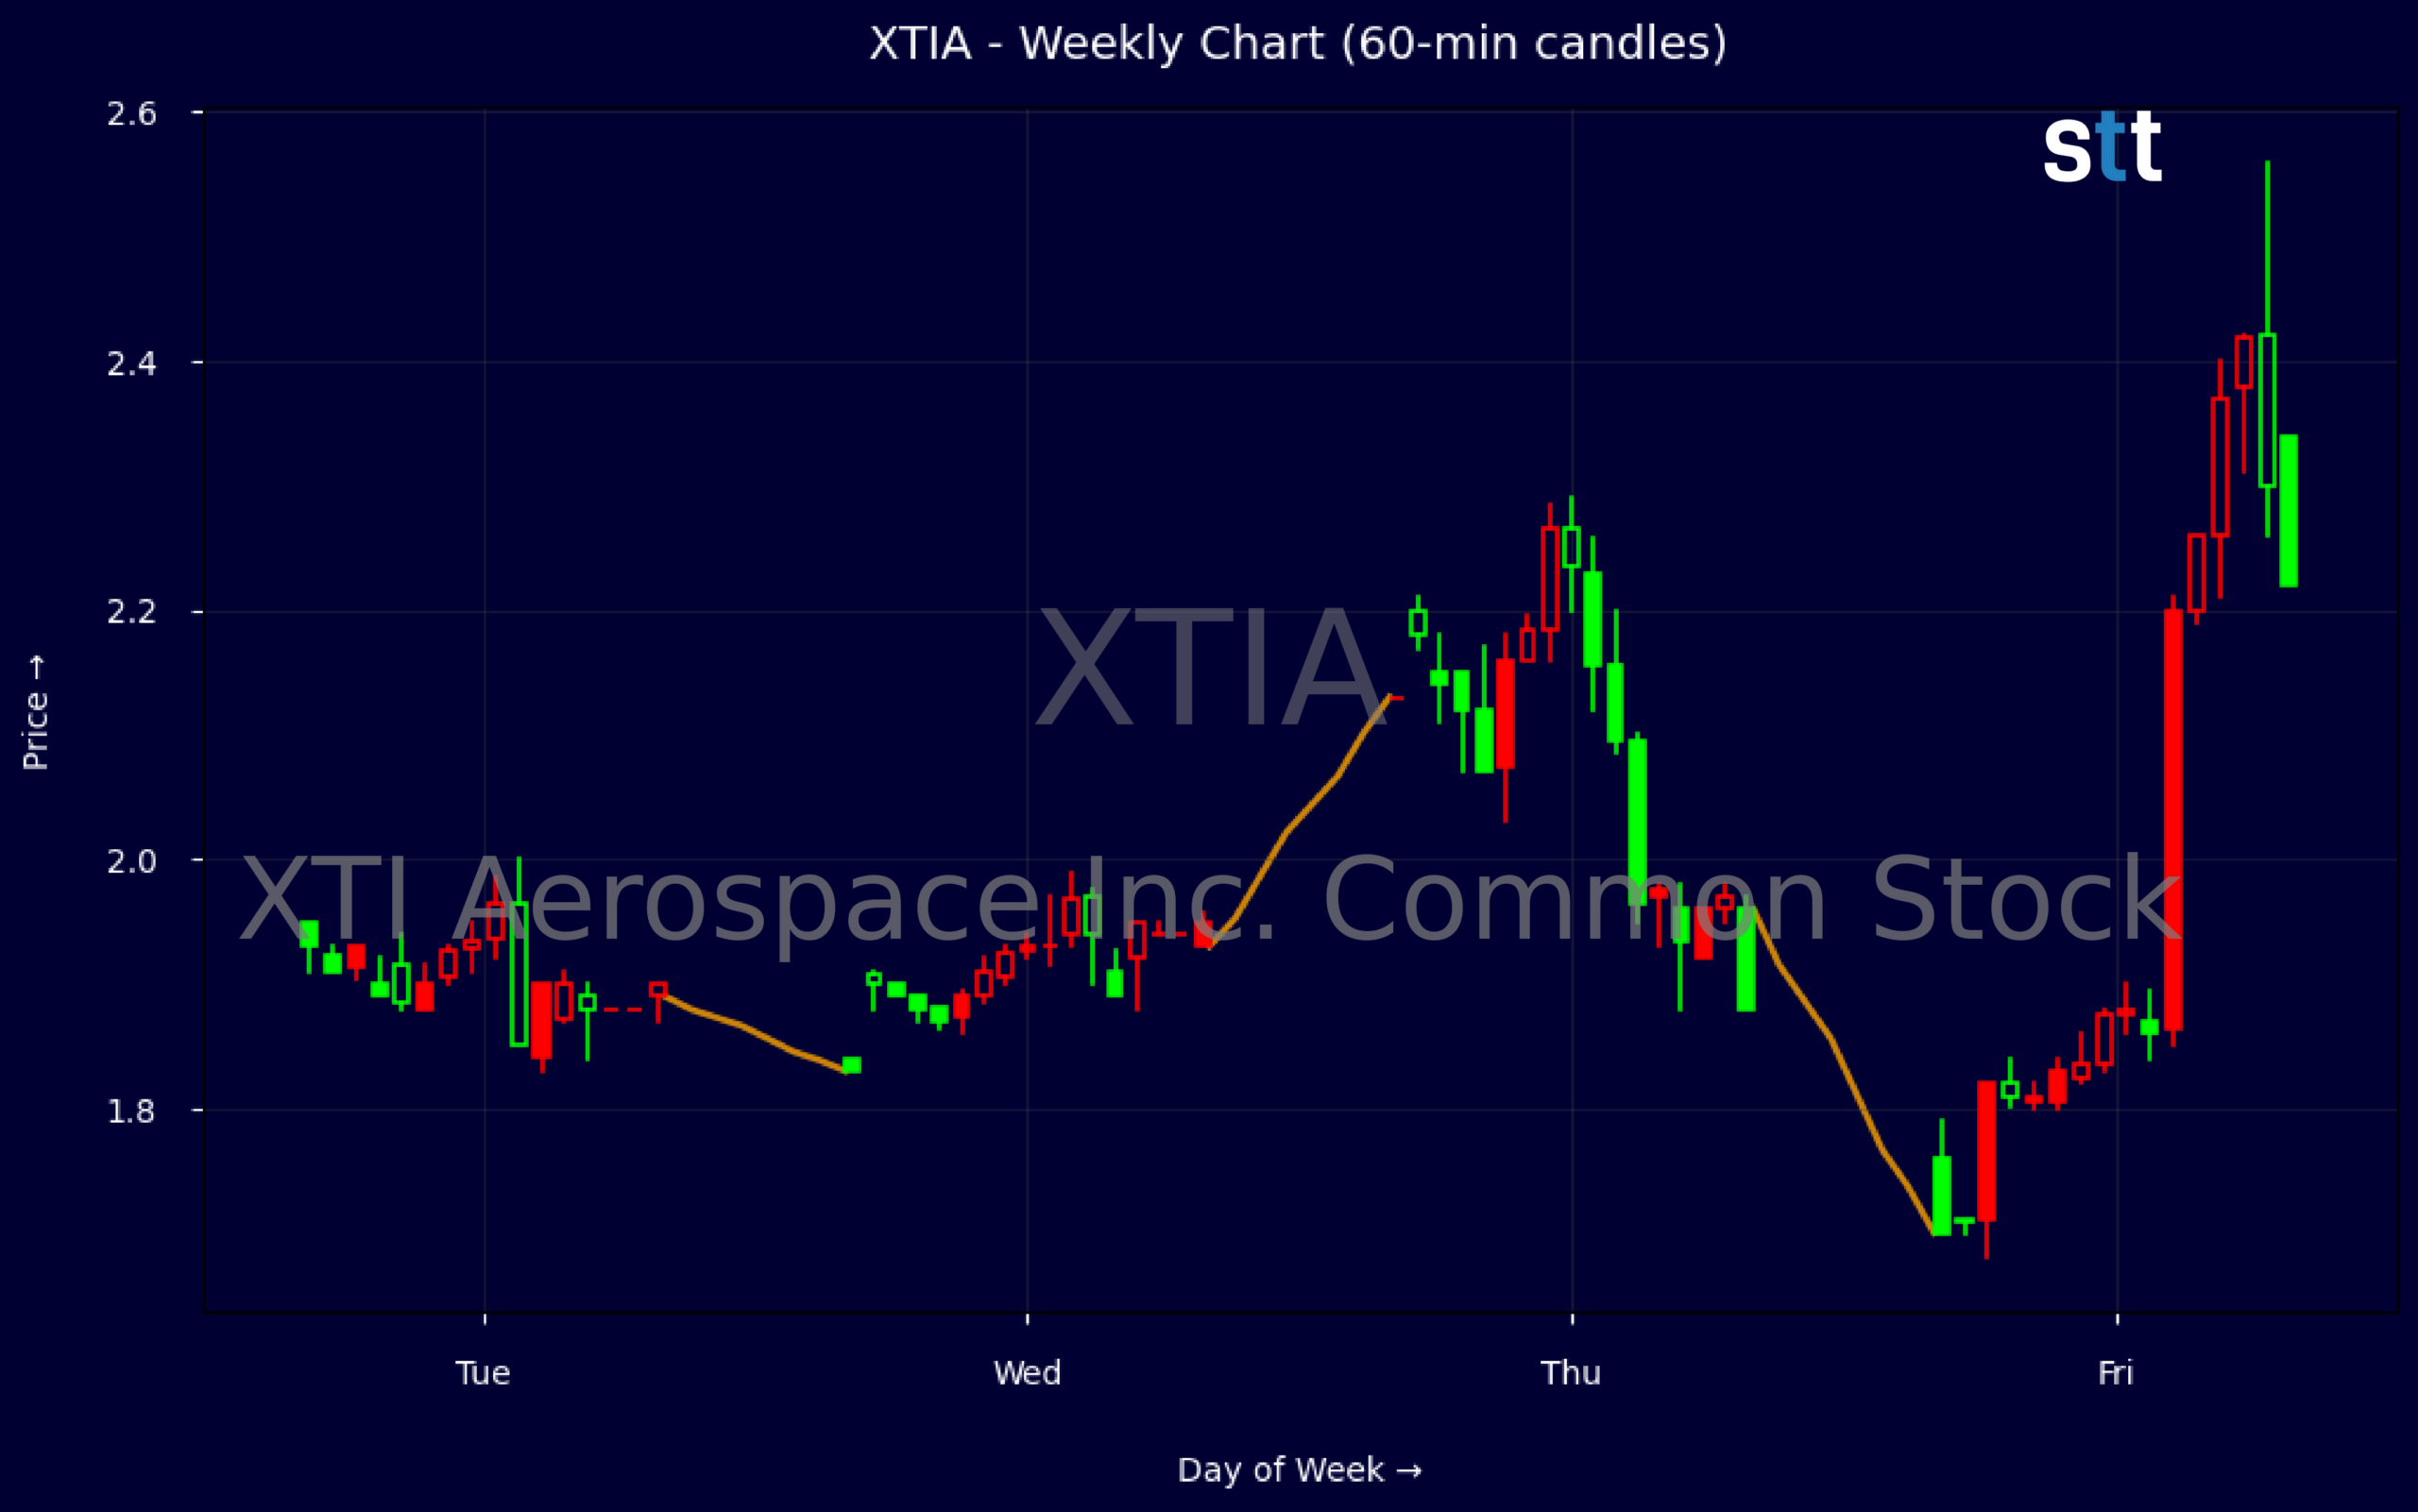
Weekly Update May 25 – May 29, 2026: On Saturday, May 30, 2026 XTI Aerospace Inc. Common Stock stock [NASDAQ: XTIA] is trending down by -14.97%! Discover the key drivers behind this movement as well as our expert analysis in the detailed breakdown below.
Industrials industry expert:
Analyst sentiment – negative
XTIA sits in a structurally weak financial position despite mid‑double‑digit multi‑year revenue growth (3‑yr CAGR ~59%). Gross margin is only 19.6%, overwhelmed by extreme negative EBIT margin (-144%) and ROA below -100%, reflecting an uneconomic business model at current scale. Liquidity is strained with a 0.6 current ratio and negative working capital of ~($40)M; equity is negative, price‑to‑book is meaningless, and the company is effectively equity‑insolvent, living on external financing and stock comp.
Technically, XTIA is in a short‑term downtrend after a failed breakout. This week’s range (high 2.21, low 1.68) shows a rejection above 2.20 and a weak close near the lows at 1.76. Intraday 5‑minute candles show fading bounces and heavier selling into minor rallies, consistent with distribution. The actionable level is 1.70: below that, momentum shorts are favored with tight risk to 1.85; only above 2.20 would a durable bullish reversal be tradable.
More Breaking News
- CareDx CDNA Rips Higher After Big Earnings Beat And Guidance Hike
- CROX Stock Jumps As Barclays Sees Multi-Year Growth
- GoDaddy GDDY Jumps As Earnings Beat And AI Airo Shine
- MPT Stock Slides As Traders Focus On Debt And Cash Flow
With no material news flow and given its metrics, XTIA screens substantially weaker than broader Industrials and Aerospace & Defense, which typically show positive ROA, solid equity cushions, and stable free cash flow. XTIA’s persistent cash burn and reliance on warrant/debt funding make dilution and financial stress the dominant catalysts. I see resistance at 2.20–2.25, support at 1.50, and a 3–6 month downside‑biased trading range of 1.25–2.00. Risk‑reward favors underweight or outright avoidance for institutional capital.
Quick Financial Overview
XTI Aerospace Inc. Common Stock shows a clear disconnect between growing revenue and very weak profitability. Recent quarterly revenue stands near $27.70M, with annual revenue reported around $22.49M and strong multi‑year growth rates. Yet margins are deeply negative: EBIT margin is roughly -144%, and net margins are worse, with return on assets below -100%. That tells traders this is a heavy cash‑burn story, not a stable earnings play.
On the balance sheet, XTI Aerospace Inc. Common Stock carries negative equity of about -$26.61M, while total liabilities exceed total assets. Current assets sit well below current liabilities, with a current ratio of 0.6 and quick ratio of 0.3, signaling tight near‑term liquidity. Cash of about $15.19M helps, but working capital is heavily negative, and financing cash flow is propping up operations.
For tape readers, XTIA’s weekly chart shows wide swings and clear volatility. Price pushed up to roughly $2.21 before closing the latest bar around $1.76, leaving a long upper rejection and signaling sellers in control. Intraday, the stock dropped from about $2.11 to $1.81 in a single 5‑minute bar, suggesting thin order books and possible air pockets when bids step away.
Conclusion
XTIA: High Volatility, High Risk, Short-Term Focus
For traders, XTI Aerospace Inc. Common Stock is a pure speculation vehicle right now, not a balance‑sheet comfort story. The combination of strong top‑line growth and brutally negative margins means the business is still in heavy build‑out or turnaround mode. The negative book value and sub‑1.0 liquidity ratios highlight financing and dilution risk if cash burn stays elevated. That backdrop helps explain why recent price strength toward the low $2s was quickly sold.
On the chart, the rejection from around $2.21 and close near $1.76 sets a clear short‑term range. Bulls will want to see price reclaim and hold above the $2.00 area with rising volume before assuming any sustainable squeeze. Bears will watch for continuation below recent lows, where liquidity could thin out and widen intraday moves. XTIA’s violent 5‑minute candle from just above $2.10 to roughly $1.80 is a live example of the execution risk.
For educational and research purposes, traders should treat XTIA as a tactical trade, not a comfort hold. Position size, hard stops, and strict risk limits matter more here than in steadier names. As Tim Bohen, lead trainer with StocksToTrade says, “There’s a pattern in everything; you just have to stick around long enough to see it.” That mindset applies directly to XTIA: patterns in volatility, volume, and intraday levels will emerge over time, but exploiting them still depends on disciplined execution. As I often tell my students, “When a stock has weak finances and wild candles like XTIA, your edge isn’t predicting the future — it’s managing your risk better than everyone else in the trade.”
This is stock news, not investment advice. StocksToTrade News delivers real-time stock market updates tailored to highlight the key catalysts driving short-term price movements. Our coverage is designed for active traders and investors who thrive in fast-moving markets, with a focus on volatile sectors like penny stocks, AI stocks, Robinhood stocks and other momentum plays. From earnings reports and FDA approvals to mergers, new contracts, and unusual trading volume, we break down the events that can spark significant price action.
Looking to level up your trading game? Explore StocksToTrade, the ultimate platform for traders. With powerful tools designed for swing and day trading, integrated news scanning, and even social media monitoring, StocksToTrade keeps you one step ahead.
Check out our quick startup guide for new traders!
- How to Read Stock Charts: A Guide for Beginners
- Trading Plan: 6 Steps to Create One
- How To Create a Stock Watchlist
Ready to build your watchlists? Check out these curated lists:
Once your watchlist is set, take the next step and trade with confidence using StocksToTrade’s robust platform. Don’t miss out — grab your 14-day trial for just $7 and experience the edge you need to thrive in today’s fast-paced markets.