

X-Energy Inc. stocks have been trading down by -7.86 percent amid concerns over project delays and financing uncertainties.
Market Insights For XE Traders
- Weekly chart shows XE fading from $18.57 toward the mid-$14s, signaling a clear near-term downtrend.
- Intraday action highlights heavy selling, with price sliding from above $16 to near the weekly low in one bar.
- Financials show steep losses and negative margins, pointing to a high-risk, story-driven name.
- Balance sheet carries negative equity and large non-current liabilities, raising questions around long-term capital structure.
- Traders are focusing on liquidity, cash burn, and whether recent support levels can hold.
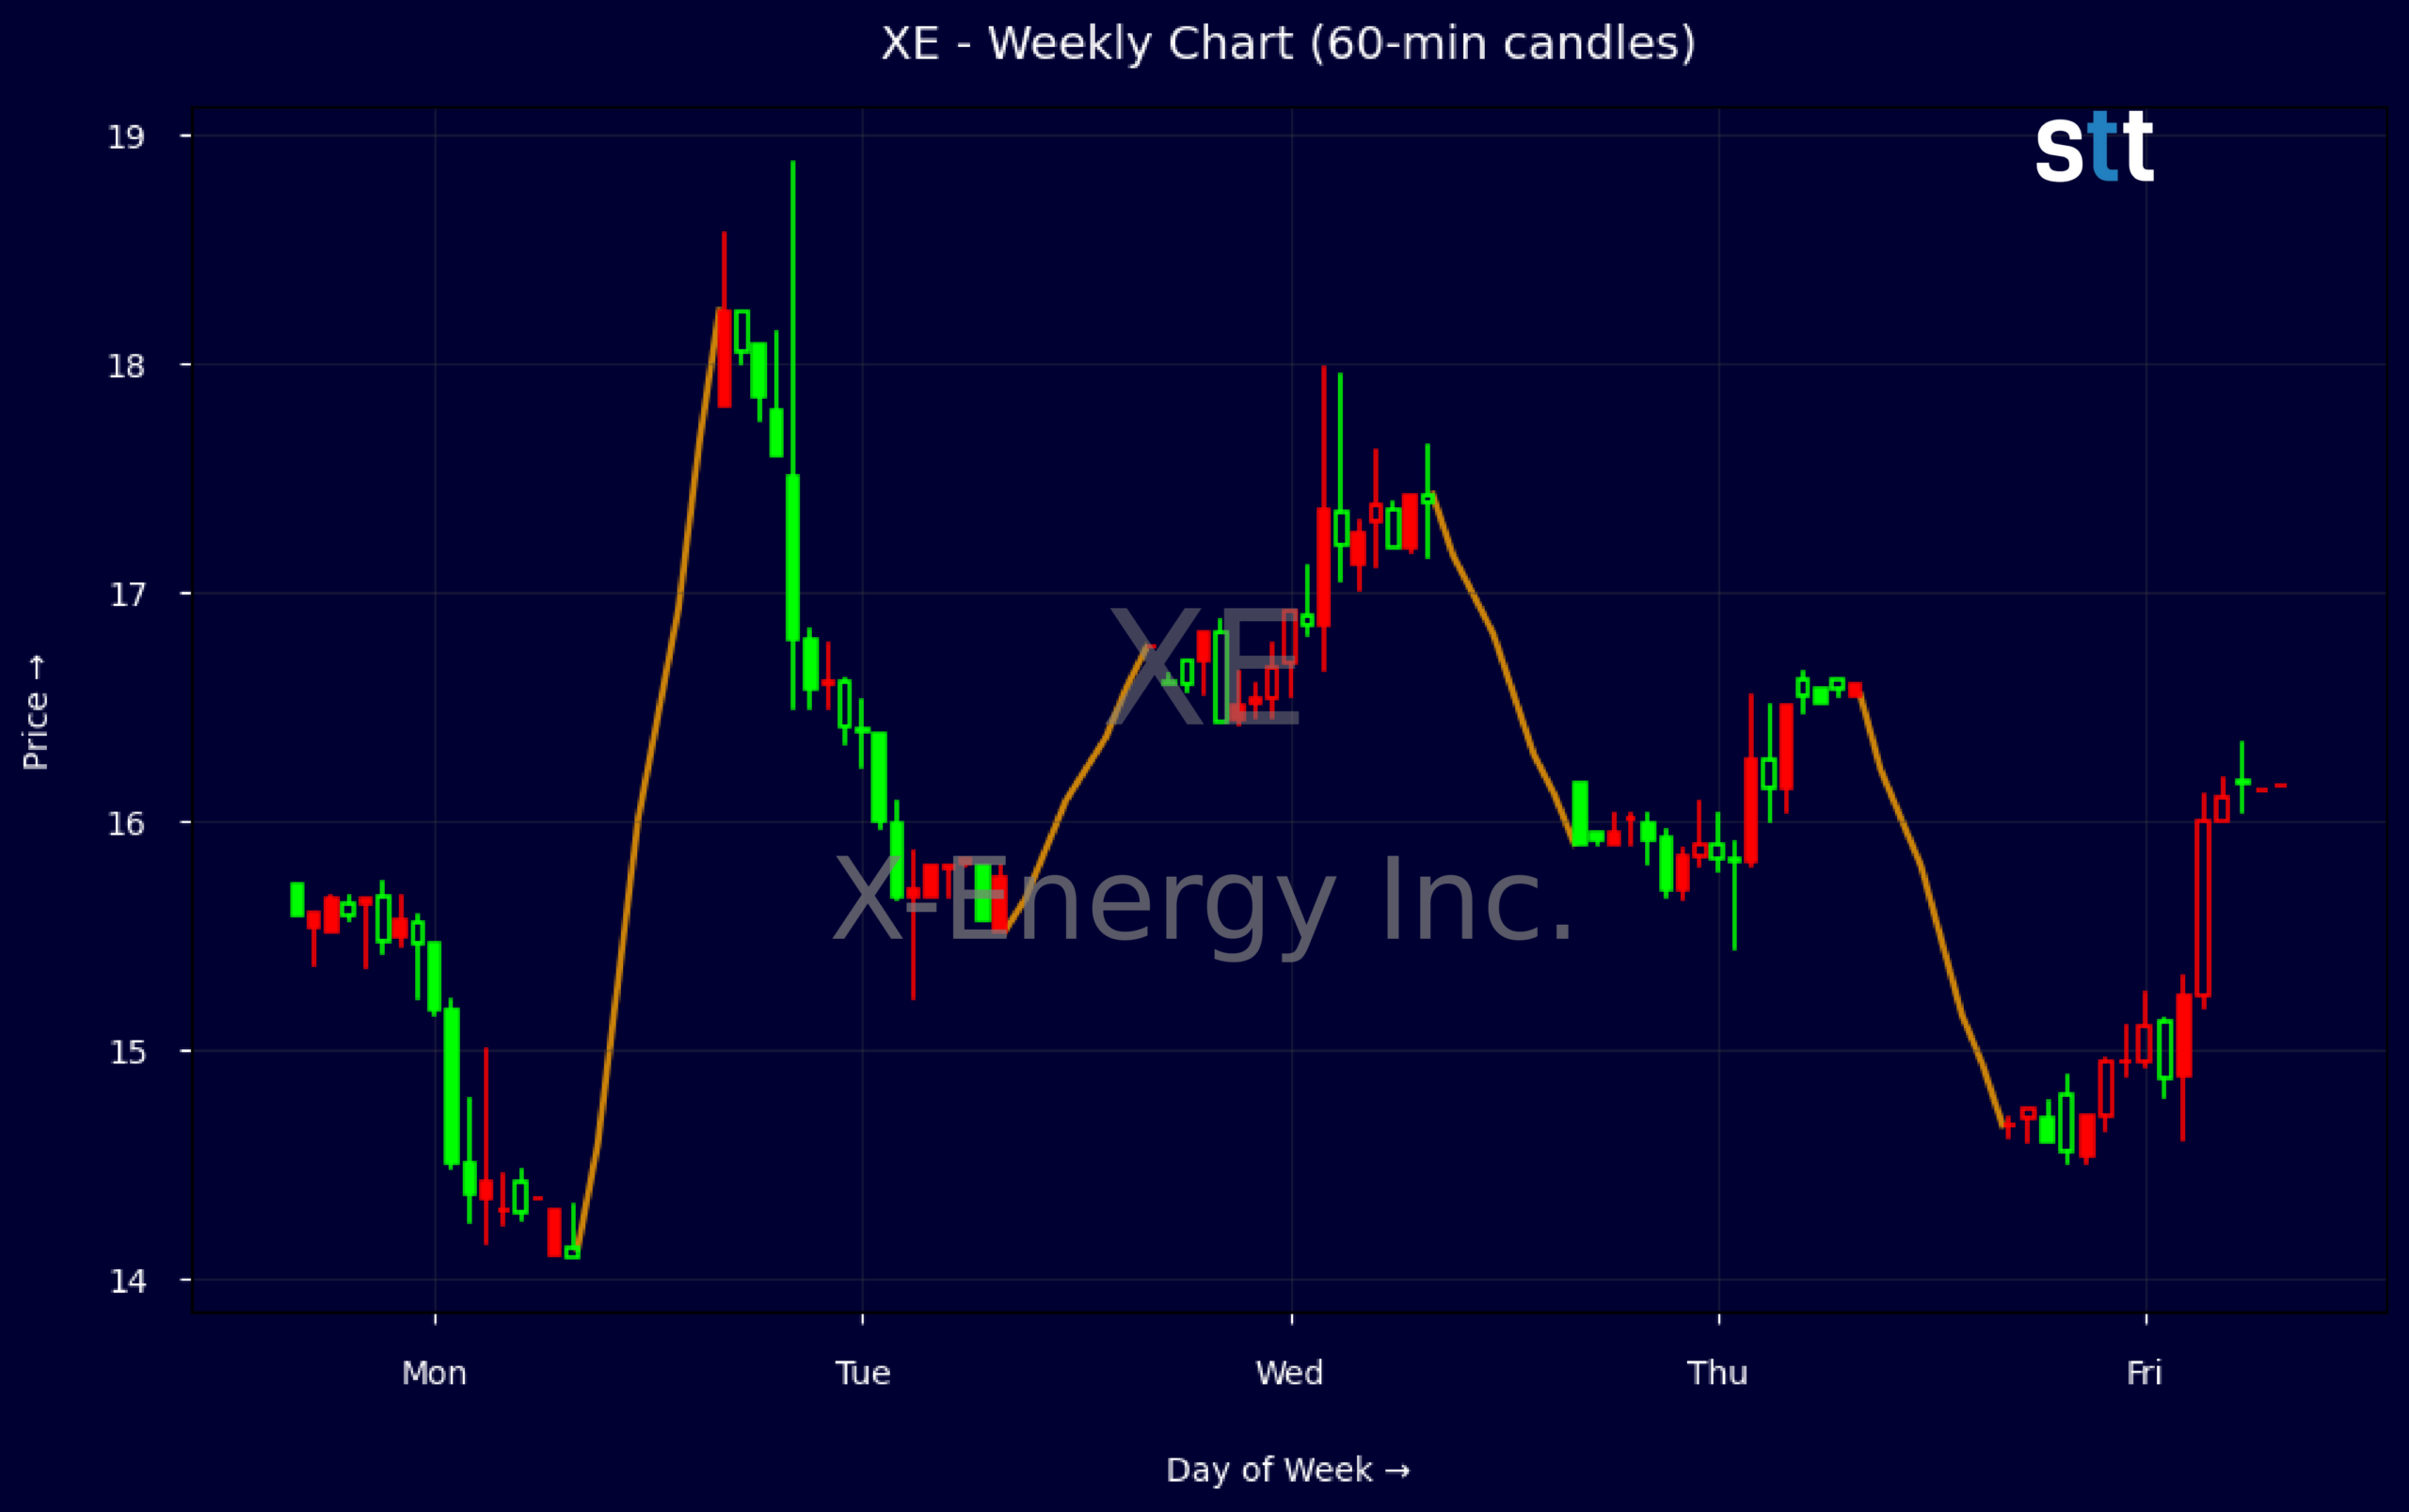
Weekly Update Jul 20 – Jul 24, 2026: On Sunday, July 26, 2026 X-Energy Inc. stock [NASDAQ: XE] is trending down by -7.86%! Discover the key drivers behind this movement as well as our expert analysis in the detailed breakdown below.
Industrials industry expert:
Analyst sentiment – negative
Xerox (ticker XE) is in a structurally weak fundamental position. The latest quarter shows revenue of only ~$43.4 million against an EBIT loss of $166 million and a gross loss, implying an extremely distressed margin profile and confirmed by a pretax margin of -308%. ROA of -19.9% and ROIC of -90.2% highlight value destruction. Negative equity of ~$1.39 billion and price-to-book of -9.05 signal a highly leveraged, covenant-sensitive balance sheet despite reported working capital strength.
Technically, XE is in a short-term downtrend after failing to hold the $18.50 area last week. Price has rolled from 18.57 to a recent 14.51–14.89 range, closing at 14.67, with intraday 5‑minute candles showing consistent lower highs and weak recovery volume on bounces. The dominant trend is bearish, with supply heavy above 16.50. A clear actionable level is support at 14.50; a decisive break below with rising volume favors short entries targeting the low‑13s.
More Breaking News
- WKHS Stock Draws Traders As EV Orders Grow And AI Pivot Emerges
- NRXP Stock Builds Momentum As FDA Ketamine Catalyst Nears
- No Analysis Provided
- Regeneron Stock Jumps As Libtayo Data Fuels Bullish Targets
With no identifiable positive news or restructuring milestones, XE trades at a fundamental and technical discount versus diversified Industrials and Industrial Goods benchmarks that offer positive ROIC and stable cash generation. Sector peers are compounding capital; XE is eroding it. I see limited probability of a sustained re‑rating absent a hard reset of the capital structure. Near term, strong resistance sits at 16.75–17.00, support at 14.50; base case skew is for a move toward 12.50 over the next quarter.
Quick Financial Overview
X-Energy Inc. (XE) has been under steady pressure on the weekly chart. Price pushed up to a recent high around $18.57 but has since rolled over, with the most recent weekly close near $14.67. That is a sizable retreat from the high and keeps XE trading below prior resistance in the upper teens, a sign that buyers have lost control for now.
The intraday snapshot tells the same story in a tighter frame. A single 5-minute candle shows XE opening above $16 and selling off sharply toward $14.51–$14.56, essentially tagging the weekly low. This kind of straight-line move usually reflects aggressive supply and weak bids. For short-term traders, that combination often leads to choppy bounces and failed rallies until the tape proves otherwise.
The fundamental backdrop is heavy. For the latest quarter ending 2026/03/31, X-Energy Inc. booked about $43.4M in total revenue against a net loss of roughly $166.2M. Pretax margin sits around -308%, with EBITDA near -$165.8M and operating cash flow at about -$67.3M. Free cash flow of roughly -$110.2M and a price-to-book ratio around -9.05 underscore a highly leveraged, loss-making profile, while return on assets near -19.9% and a -90.2% one-year ROIC highlight how far the business is from economic breakeven.
Conclusion
X-Energy Inc. sits in a tough spot where price action and fundamentals line up on the risk side. The weekly chart shows a failed push above $18 and a steady drop into the mid-$14s, while the intraday candle reflects intense selling in a very short window. That tells traders one clear thing: XE is in a weak tape, and rallies are suspect until proven otherwise.
On the financial side, XE is a classic high-burn, high-uncertainty name. Deep quarterly losses, sharply negative margins, and free cash flow around -$110.2M mean the company must rely on external capital or asset moves to keep funding operations. Negative equity and large non-current liabilities add another layer of capital-structure risk that short-term traders cannot ignore, even if they are only looking to play volatility. In an environment like this, risk management has to come first; as Tim Bohen, lead trainer with StocksToTrade says, “Success in trading is more about cutting losses quickly than finding winners.” That mindset is especially critical in names where the downside can accelerate quickly on any negative catalyst.
For traders, XE can still offer opportunity, but it demands strict risk control and clear levels. The key question is whether the $14–$15 zone can stabilize the stock, or if another leg down is coming before any meaningful base forms. As I tell my students, “You do not get paid for being early in names like X-Energy Inc.; you get paid for trading what the tape and the balance sheet are both telling you right now.”
This is stock news, not investment advice. StocksToTrade News delivers real-time stock market updates tailored to highlight the key catalysts driving short-term price movements. Our coverage is designed for active traders and investors who thrive in fast-moving markets, with a focus on volatile sectors like penny stocks, AI stocks, Robinhood stocks and other momentum plays. From earnings reports and FDA approvals to mergers, new contracts, and unusual trading volume, we break down the events that can spark significant price action.
Looking to level up your trading game? Explore StocksToTrade, the ultimate platform for traders. With powerful tools designed for swing and day trading, integrated news scanning, and even social media monitoring, StocksToTrade keeps you one step ahead.
Check out our quick startup guide for new traders!
- How to Read Stock Charts: A Guide for Beginners
- Trading Plan: 6 Steps to Create One
- How To Create a Stock Watchlist
Ready to build your watchlists? Check out these curated lists:
Once your watchlist is set, take the next step and trade with confidence using StocksToTrade’s robust platform. Don’t miss out — grab your 14-day trial for just $7 and experience the edge you need to thrive in today’s fast-paced markets.