
Weatherford International plc stocks have been trading up by 7.79 percent amid strong investor optimism over improving energy-sector fundamentals.
Click Here for a Millionaire's POV on Trading WFRD
SUBSCRIBE FOR ALERTSJOIN 50,000+ ACTIVE TRADERS
What Traders Need To Know
- Q3 EPS of $1.66 cleared consensus near $1.27–$1.33 on $1.14B revenue, with EBITDA margin expanding to 22.2%.
- Year-over-year revenue slipped from $1.23B to $1.14B on Middle East disruptions, but profitability, free cash flow, and leverage improved sharply.
- Management completed the NCS Multistage acquisition, moved redomestication toward Delaware, redeemed costly 2030 notes, and locked in multiple long-duration international contracts.
- Major banks cut price targets on WFRD for Middle East and Saudi-related slowdowns but mostly kept Buy or Overweight ratings.
- Street consensus stays overweight on Weatherford International plc with a mean target near $114 versus a recent share price around $82 after a 3.7% pullback.
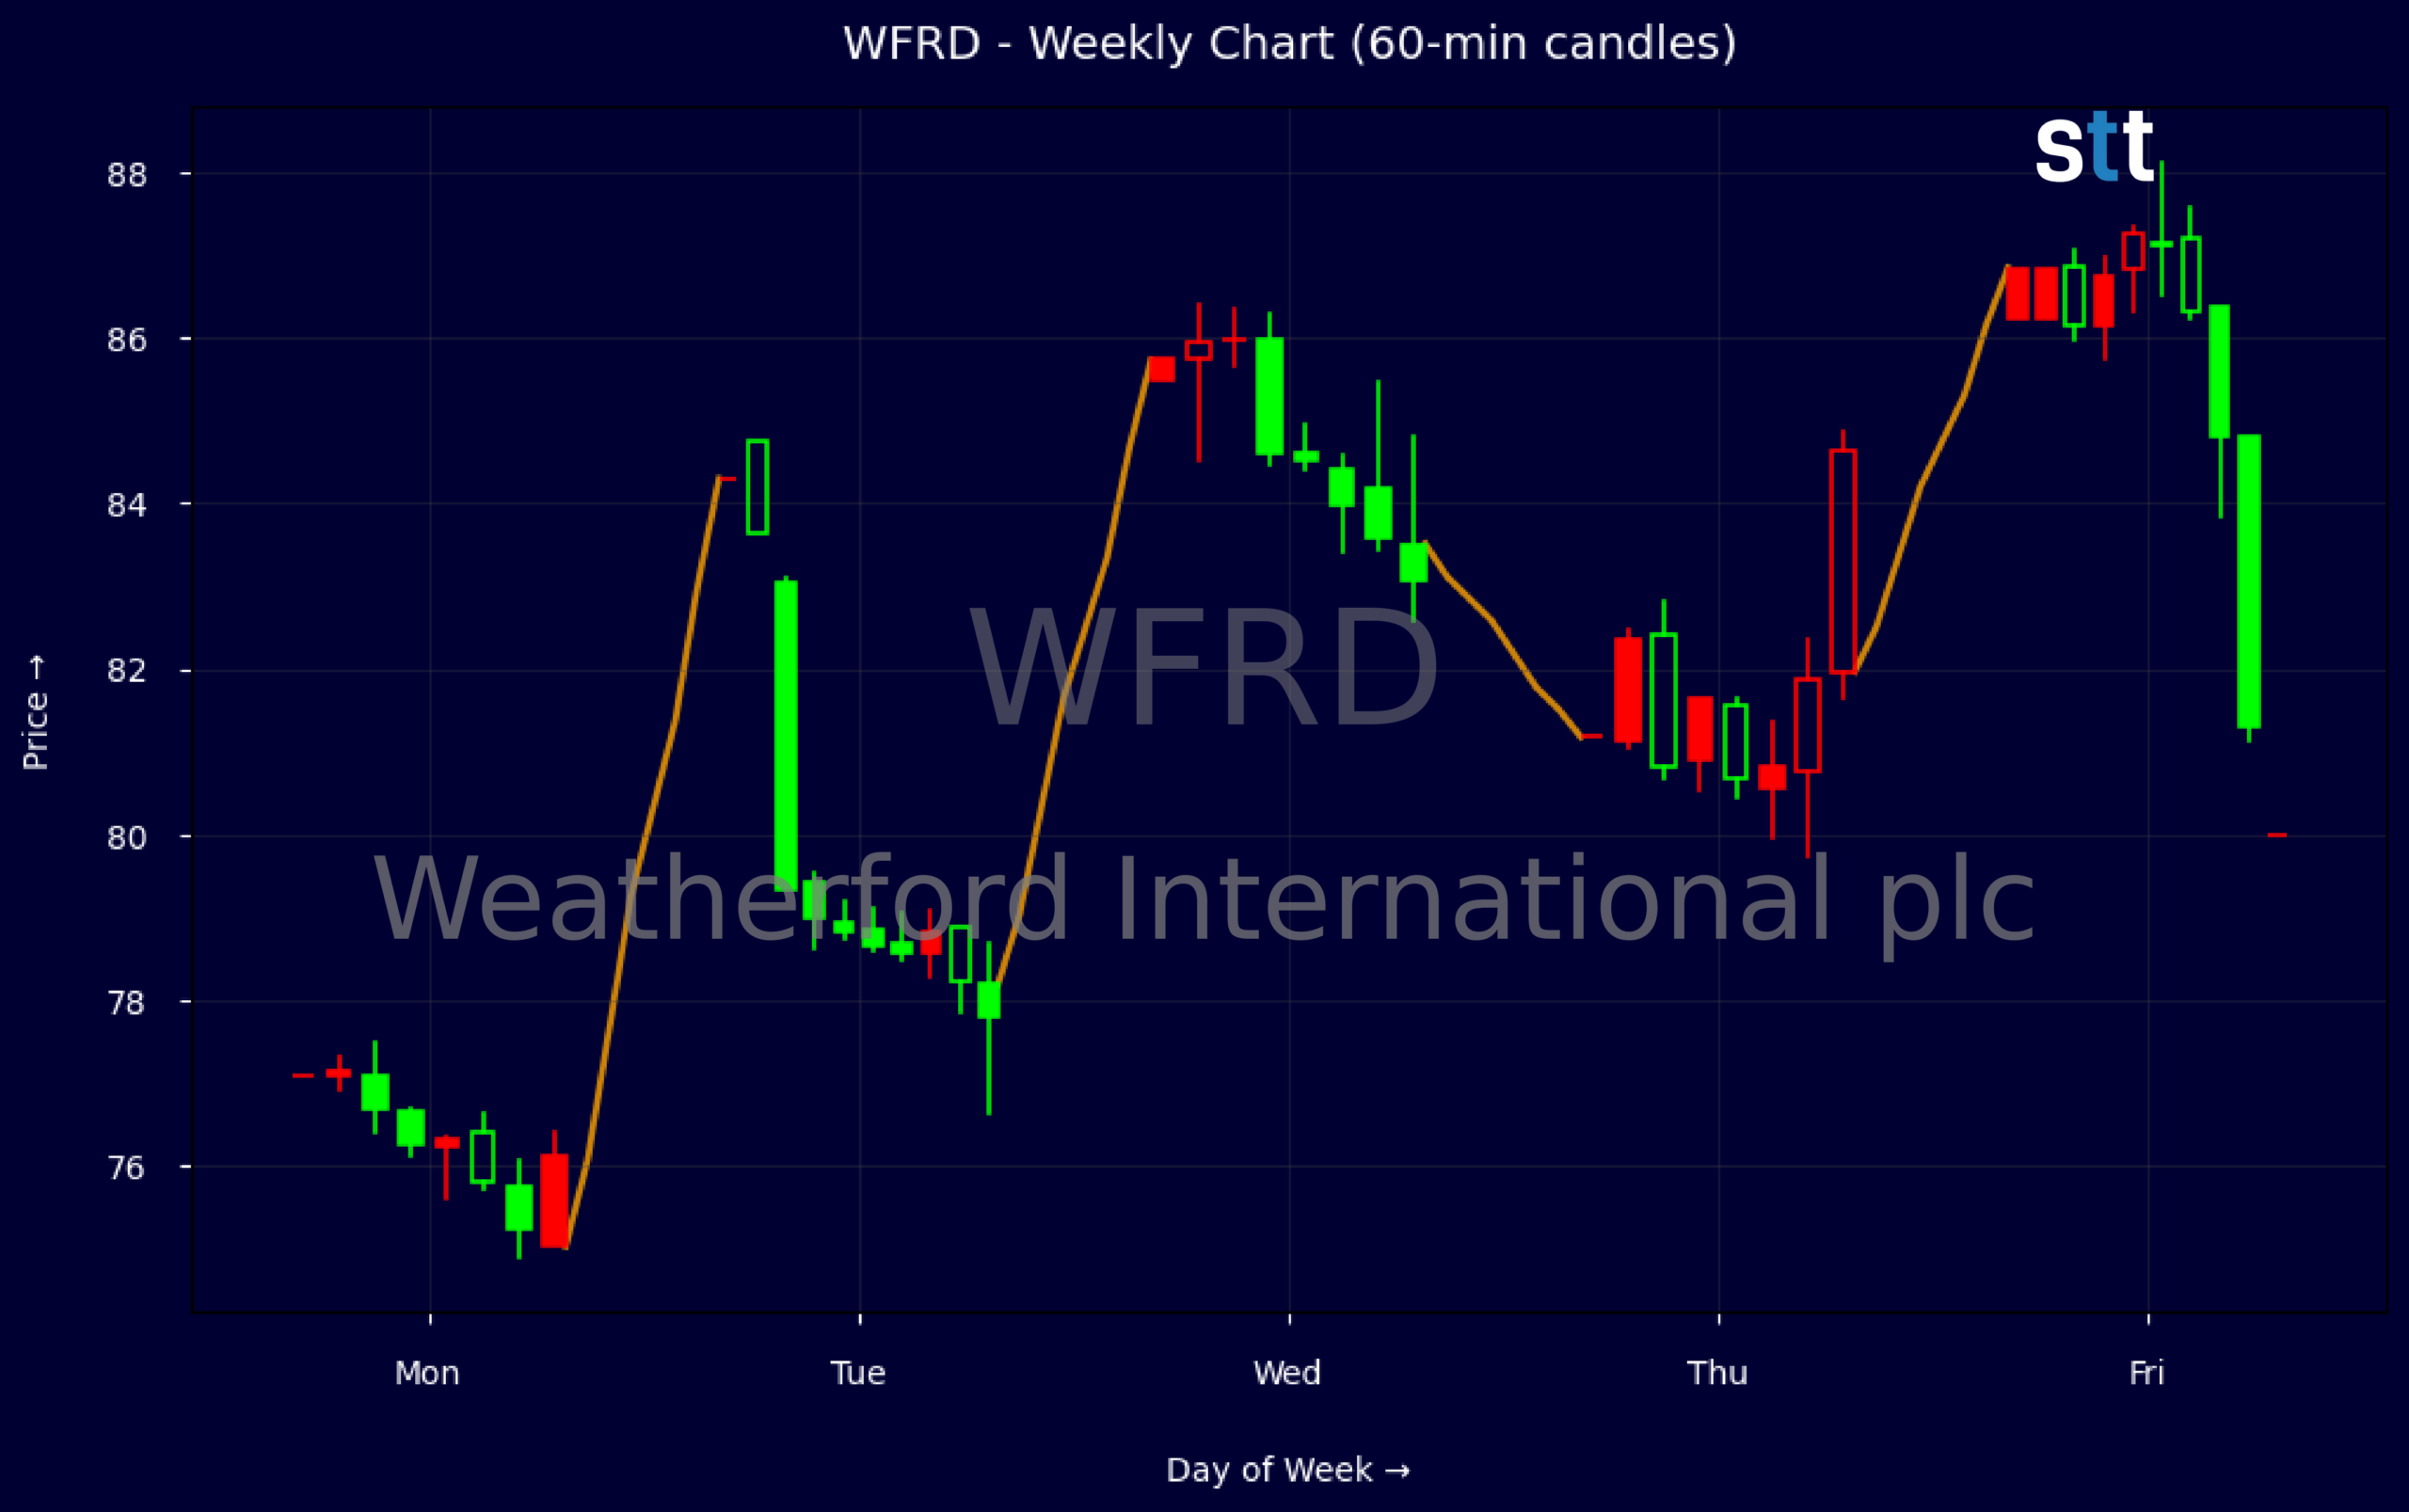
Weekly Update Oct 19 – Oct 23, 2026: On Friday, October 23, 2026 Weatherford International plc stock [NASDAQ: WFRD] is trending up by 7.79%! Discover the key drivers behind this movement as well as our expert analysis in the detailed breakdown below.
Energy industry expert:
Analyst sentiment – positive
Weatherford (WFRD) sits as a top‑tier, high‑beta oilfield services name with superior profitability versus most Energy Services peers. EBIT margin at 10.3% and EBITDA margin ~16–22% (quarterly) on $4.9B TTM revenue reflect successful pricing and mix despite a three‑year revenue CAGR drag. ROE above 22% and ROIC ~15–16% confirm disciplined capital deployment. Leverage is moderate (total debt/equity 0.91, interest coverage 9.5x), supported by $147M quarterly FCF and ample liquidity ($1.16B cash, current ratio 2.3x).
Technically, WFRD remains in a clear primary uptrend: the weekly sequence from ~$77 to ~$86 shows higher highs and higher lows with strong institutional support on earnings strength. Recent 5‑minute candles (post‑print) indicate elevated volume and repeated buying interest above $82, turning that zone into near‑term support. A concrete trading level is $82–83: buy pullbacks into that band with a stop near $78 and upside focus on the low‑90s near prior congestion.
More Breaking News
- AARD Stock Slides As FDA Hold And Class Actions Mount
- HTZ Rallies As Oro Mobility Lands $80M Growth Deal
- SLB Stock Climbs As New Mega Contracts Power Momentum
- CBRG ETF Slides From Highs As Volatility Grips Traders
Fundamentally and vs. broader Energy benchmarks, WFRD offers superior growth in earnings and FCF with mid‑20s EBITDA margins versus more cyclical, lower‑margin fossil fuel peers. Q3 EPS of $1.66 crushed consensus on better margins and cash conversion, while NCS Multistage integration, deleveraging, and long‑duration contracts underpin 2027+ visibility despite Middle East headwinds. Street targets (mean ~$114) imply material upside from the mid‑80s; I see near‑term resistance at $95 and medium‑term fair value at $110–115.
Quick Financial Overview
Weatherford International plc printed a strong Q3 on the bottom line. EPS came in at $1.66, beating estimates in the $1.27–$1.33 range, while revenue of $1.14B was slightly ahead of consensus but down from $1.23B a year ago. Margin quality was the standout, with EBITDA at $214M and margin pushing to 22.2%, well above the company’s longer-term level near the mid-teens.
Key ratios back up this improvement. Gross margin sits around 46.7%, and profit margins in the high single digits combine with a price-to-earnings ratio near 15.4 and price-to-sales of about 1.17, suggesting WFRD is not aggressively priced versus its earnings power. Returns on equity above 22% and on capital in the mid-teens show that Weatherford International plc is converting its asset base into solid profits. Free cash flow of roughly $147M this quarter, on operating cash flow of $192M, supports a dividend around $0.28 per quarter and an annual yield near 1.4%, with an ex-dividend date in early 2026/11.
The balance sheet is steadier than in past cycles. Total debt-to-equity is under 1.0, interest coverage is close to 9.5, and current ratio around 2.3 suggests WFRD has room to ride out regional volatility. Recent redemption of high-coupon 2030 notes and steady working capital gains support that story. On the tape, weekly price data show a climb from the low-$80s toward the mid-$80s, with recent closes near $86. The intraday 5-minute chart shows steady buying from the open near $82.5 up into the high-$86s, then a tight range into the close, signaling controlled accumulation rather than a blow-off spike.
Conclusion
Weatherford International plc is trading in that useful zone where fundamentals look strong, but headline risk is still scaring off some capital. Earnings are beating, margins are widening, and free cash flow is healthy, yet revenue softness tied to Middle East disruptions and Saudi-related activity suspensions keeps the market cautious. That is why RBC, Barclays, Citi, UBS, and Piper Sandler all trimmed price targets, even as they kept Buy or Overweight calls.
For traders, the disconnect between a mean target near $114 and a spot price around the low-to-mid $80s is the key tension. The weekly chart shows a rebound off the low-$80s with higher closes, while the intraday grind higher and tight afternoon range suggest dip buying and no panic supply. Balance sheet repair, the NCS Multistage acquisition, and long-duration contracts all argue for stronger earnings power if regional headwinds ease.
The flip side is clear: any escalation in Middle East disruptions or weaker-than-expected Q4 could pressure WFRD back toward recent lows before the longer-term thesis plays out. Short-term traders should respect that volatility, define risk carefully, and avoid chasing extended candles on news spikes. As I tell my students, “Weatherford rewards traders who let the chart confirm what the earnings already suggest and only size up when price, volume, and fundamentals all point in the same direction.” In that context, disciplined execution is everything; as Tim Bohen, lead trainer with StocksToTrade says, “The best trades are the ones you can make without emotion. Plan it, then execute it as if it’s routine.”
This is stock news, not investment advice. StocksToTrade News delivers real-time stock market updates tailored to highlight the key catalysts driving short-term price movements. Our coverage is designed for active traders and investors who thrive in fast-moving markets, with a focus on volatile sectors like penny stocks, AI stocks, Robinhood stocks and other momentum plays. From earnings reports and FDA approvals to mergers, new contracts, and unusual trading volume, we break down the events that can spark significant price action.
Looking to level up your trading game? Explore StocksToTrade, the ultimate platform for traders. With powerful tools designed for swing and day trading, integrated news scanning, and even social media monitoring, StocksToTrade keeps you one step ahead.
Check out our quick startup guide for new traders!
- How to Read Stock Charts: A Guide for Beginners
- Trading Plan: 6 Steps to Create One
- How To Create a Stock Watchlist
Ready to build your watchlists? Check out these curated lists:
Once your watchlist is set, take the next step and trade with confidence using StocksToTrade’s robust platform. Don’t miss out — grab your 14-day trial for just $7 and experience the edge you need to thrive in today’s fast-paced markets.