
Veradermics Incorporated stocks have been trading up by 11.24 percent following highly positive sentiment from its latest clinical trial news.
Click Here for a Millionaire's POV on Trading MANE
SUBSCRIBE FOR ALERTSJOIN 50,000+ ACTIVE TRADERS
Key Takeaways
- Price action in MANE has shifted from a sharp pullback to steady grinding, with Veradermics Incorporated closing near the high of day around $121.
- Daily chart shows MANE recovering from a dip near $106, reclaiming the short-term range and signaling momentum back in buyers’ hands.
- Veradermics Incorporated sits on over $319.3M in cash with minimal long-term debt, giving traders confidence in the company’s runway.
- Despite negative earnings and cash burn, MANE raised over $414.3M via stock issuance, reinforcing its ability to fund operations.
- Traders are now focused on whether MANE can hold the $115–$118 zone as a new support base for the next leg.
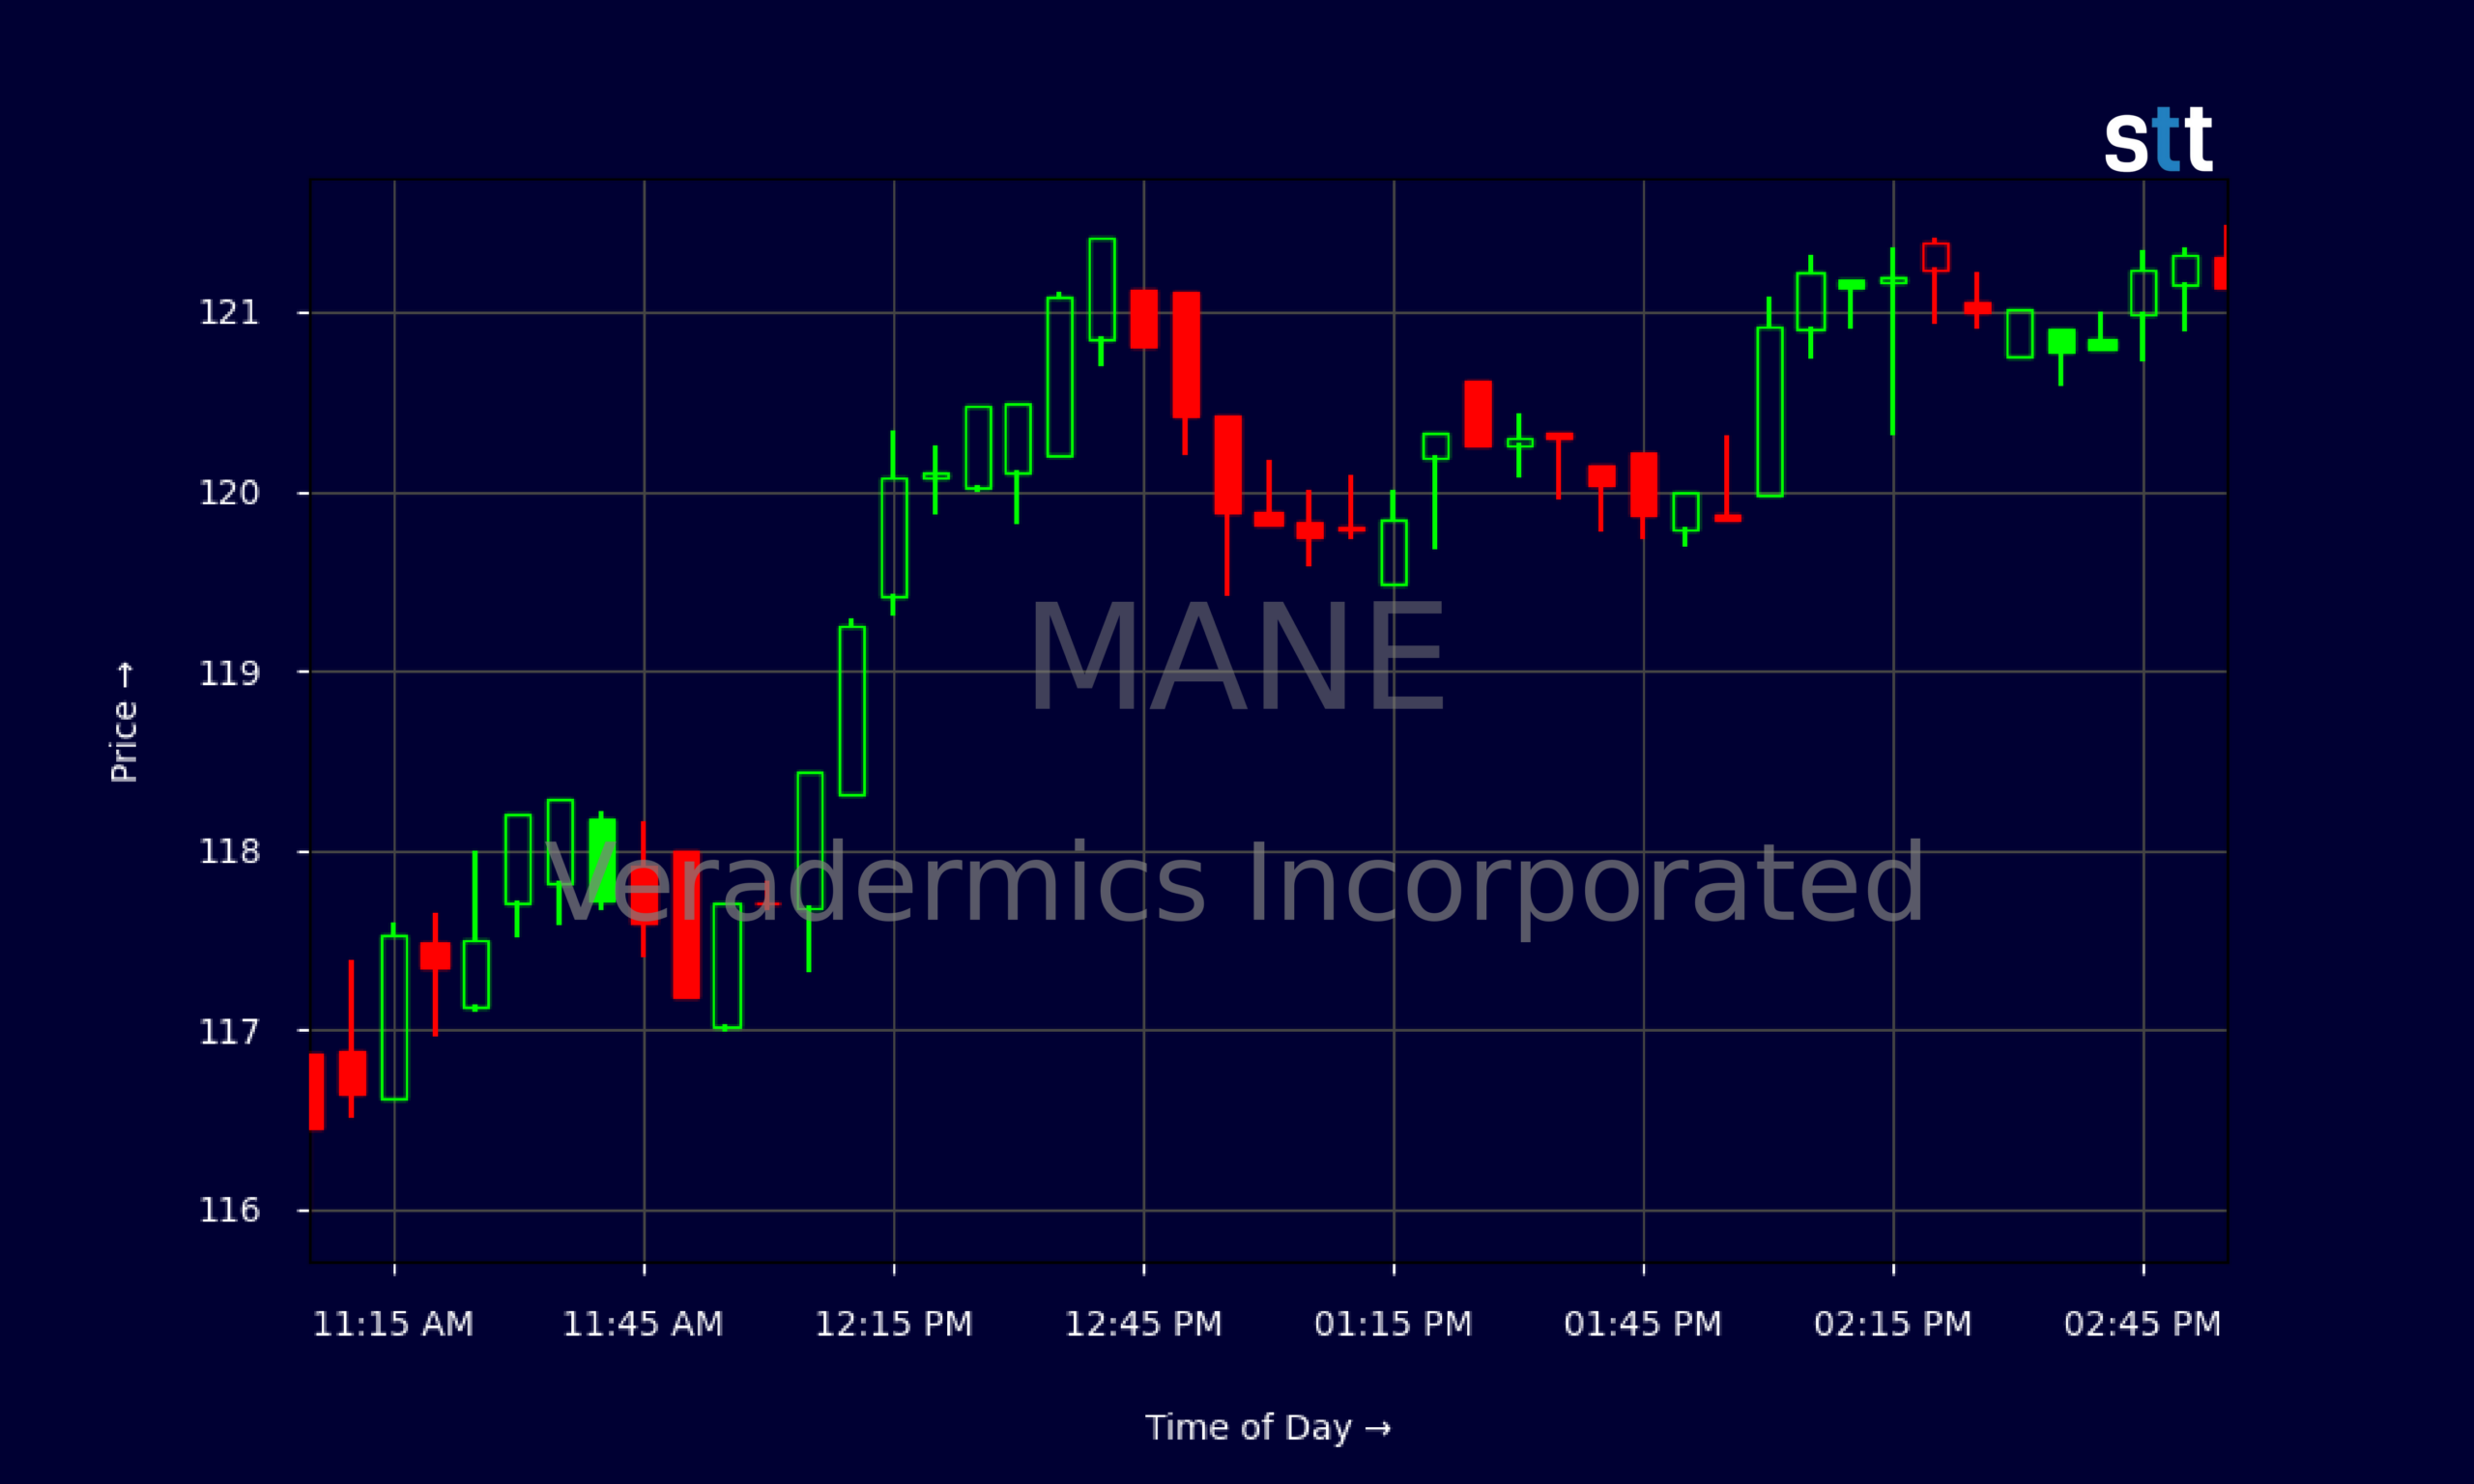
Live Update At 15:02:28 EDT: On Monday, October 19, 2026 Veradermics Incorporated stock [NYSE: MANE] is trending up by 11.24%! Discover the key drivers behind this movement as well as our expert analysis in the detailed breakdown below.
Quick Financial Overview
Veradermics Incorporated, trading under ticker MANE, is a classic early-stage, high-cash, high-burn story. The most recent quarterly report shows MANE with about $825.7M in total assets and a hefty $813.6M in equity. Cash and equivalents sit around $319.3M, while long-term debt is only about $0.4M. That’s basically no leverage. For traders, this matters: MANE is not a balance-sheet time bomb.
The flip side is the income statement. Veradermics Incorporated posted a quarterly net loss of roughly $23.5M, with negative EBITDA and basic EPS of -$0.58. Research and development ran about $18.6M, and general and administrative expenses near $10.9M. MANE is clearly spending heavily to build value, not to show profits.
More Breaking News
- AAME Stock Jumps As Traders React To Mystery 8-K
- AAL Stock Slides As Wall Street Slashes Price Targets
- MEDS Stock Surges As AI Health Ecosystem Gains Traction
- FMX Stock Holds Up As UBS Trims Price Target, Bond Deal Shines
Operating cash flow was about -$14.5M, and free cash flow was slightly negative as well. The gap was filled by aggressive equity financing — roughly $414.3M in new stock issuance plus warrant proceeds. For active traders, MANE screens as a cash-rich, loss-making growth play, where price trends and liquidity often matter more than traditional valuation ratios.
Why Traders Are Watching MANE Price Action
Traders are glued to the MANE chart because the behavior has shifted from liquidation to controlled accumulation. Look at the daily candles: Veradermics Incorporated flushed from a recent high in the $129–$135 zone down to a low around $106.51, then snapped back. The latest close near $121.05 marks a strong bounce, with MANE reclaiming most of the prior breakdown.
The pattern on MANE’s daily chart shows a series of higher lows after the washout, with closes creeping up from $108.82 to $121.05 over just a few days. That’s the kind of “from panic to patience” transition that short-term traders love to stalk. It signals that weak hands likely bailed near the lows, and dip-buyers stepped in around the $110–$115 band.
Intraday, MANE opened near $115.34 and quickly reclaimed the $118–$119 zone by mid-morning. From there, Veradermics Incorporated spent the afternoon grinding above $119, with a steady staircase of higher lows into the close around $121. That’s classic trend-day action: shallow pullbacks, no major fades, and strong closing strength.
Combine that with the balance sheet — over $319.3M in cash and minimal debt — and traders see room for Veradermics Incorporated to keep funding its research cycle. The losses are real, but MANE has runway. This combo of technical recovery and financial cushion is why so many short-term traders are tracking MANE every tick.
Conclusion
For active traders, MANE is less about current profit and more about survival, runway, and price action. Veradermics Incorporated checks the first two boxes: a huge equity base around $813.6M, cash over $319.3M, and only about $0.4M in long-term debt. That gives MANE time to execute without the overhang of heavy leverage, even with quarterly losses of roughly $23.5M.
On the chart, MANE is showing exactly what momentum traders want to see after a shakeout. Veradermics Incorporated broke down from the $130+ area, bottomed near $106, then clawed back above $120 with a strong close and intraday trend structure. Holding above the $115–$118 band turns that zone into a key support line in the sand. Lose it, and MANE can quickly revisit the lows. Hold it, and traders will eye a push back toward $125–$130.
The trading lesson from MANE right now is simple: respect both the chart and the cash. As Tim Sykes likes to say, “The market doesn’t reward hope, it rewards preparation and discipline.” In the same spirit, and as a reminder not to chase when the setup isn’t there, traders should remember what As Tim Bohen, lead trainer with StocksToTrade says, “Time and experience have taught me that missed opportunities are part of the game. There’s always another setup around the corner.”. Traders studying Veradermics Incorporated should map their levels, watch volume, and stay ready to cut losses fast if MANE breaks support — or ride momentum when the next breakout confirms. This is educational and research material only, meant to help traders better read a name like MANE, not to tell anyone what to do with their money.
This is stock news, not investment advice. StocksToTrade News delivers real-time stock market updates tailored to highlight the key catalysts driving short-term price movements. Our coverage is designed for active traders and investors who thrive in fast-moving markets, with a focus on volatile sectors like penny stocks, AI stocks, Robinhood stocks and other momentum plays. From earnings reports and FDA approvals to mergers, new contracts, and unusual trading volume, we break down the events that can spark significant price action.
Looking to level up your trading game? Explore StocksToTrade, the ultimate platform for traders. With powerful tools designed for swing and day trading, integrated news scanning, and even social media monitoring, StocksToTrade keeps you one step ahead.
Check out our quick startup guide for new traders!
- How to Read Stock Charts: A Guide for Beginners
- Trading Plan: 6 Steps to Create One
- How To Create a Stock Watchlist
Ready to build your watchlists? Check out these curated lists:
Once your watchlist is set, take the next step and trade with confidence using StocksToTrade’s robust platform. Don’t miss out — grab your 14-day trial for just $7 and experience the edge you need to thrive in today’s fast-paced markets.