

U-BX Technology Ltd. stocks have been trading up by 62.84 percent amid heightened investor interest following recent market coverage.
Market Insights For Active UBXG Traders
- Recent weekly action shows U-BX Technology Ltd. running from the low $3s to above $8 before settling near $7.80, signaling aggressive speculative interest.
- Intraday, the stock ripped from just over $6 to nearly $10 in one 5‑minute bar, then closed well off the highs, highlighting heavy profit taking.
- Balance sheet data shows low liabilities versus equity, giving UBXG room to absorb trading volatility without obvious near-term financial strain.
- Revenue of about $29.7M against a modest market value and low price-to-book ratio suggests traders are pricing in uncertainty despite solid asset backing.
- Sharp swings and wide intraday ranges make risk management and sizing critical for anyone trading UBXG.
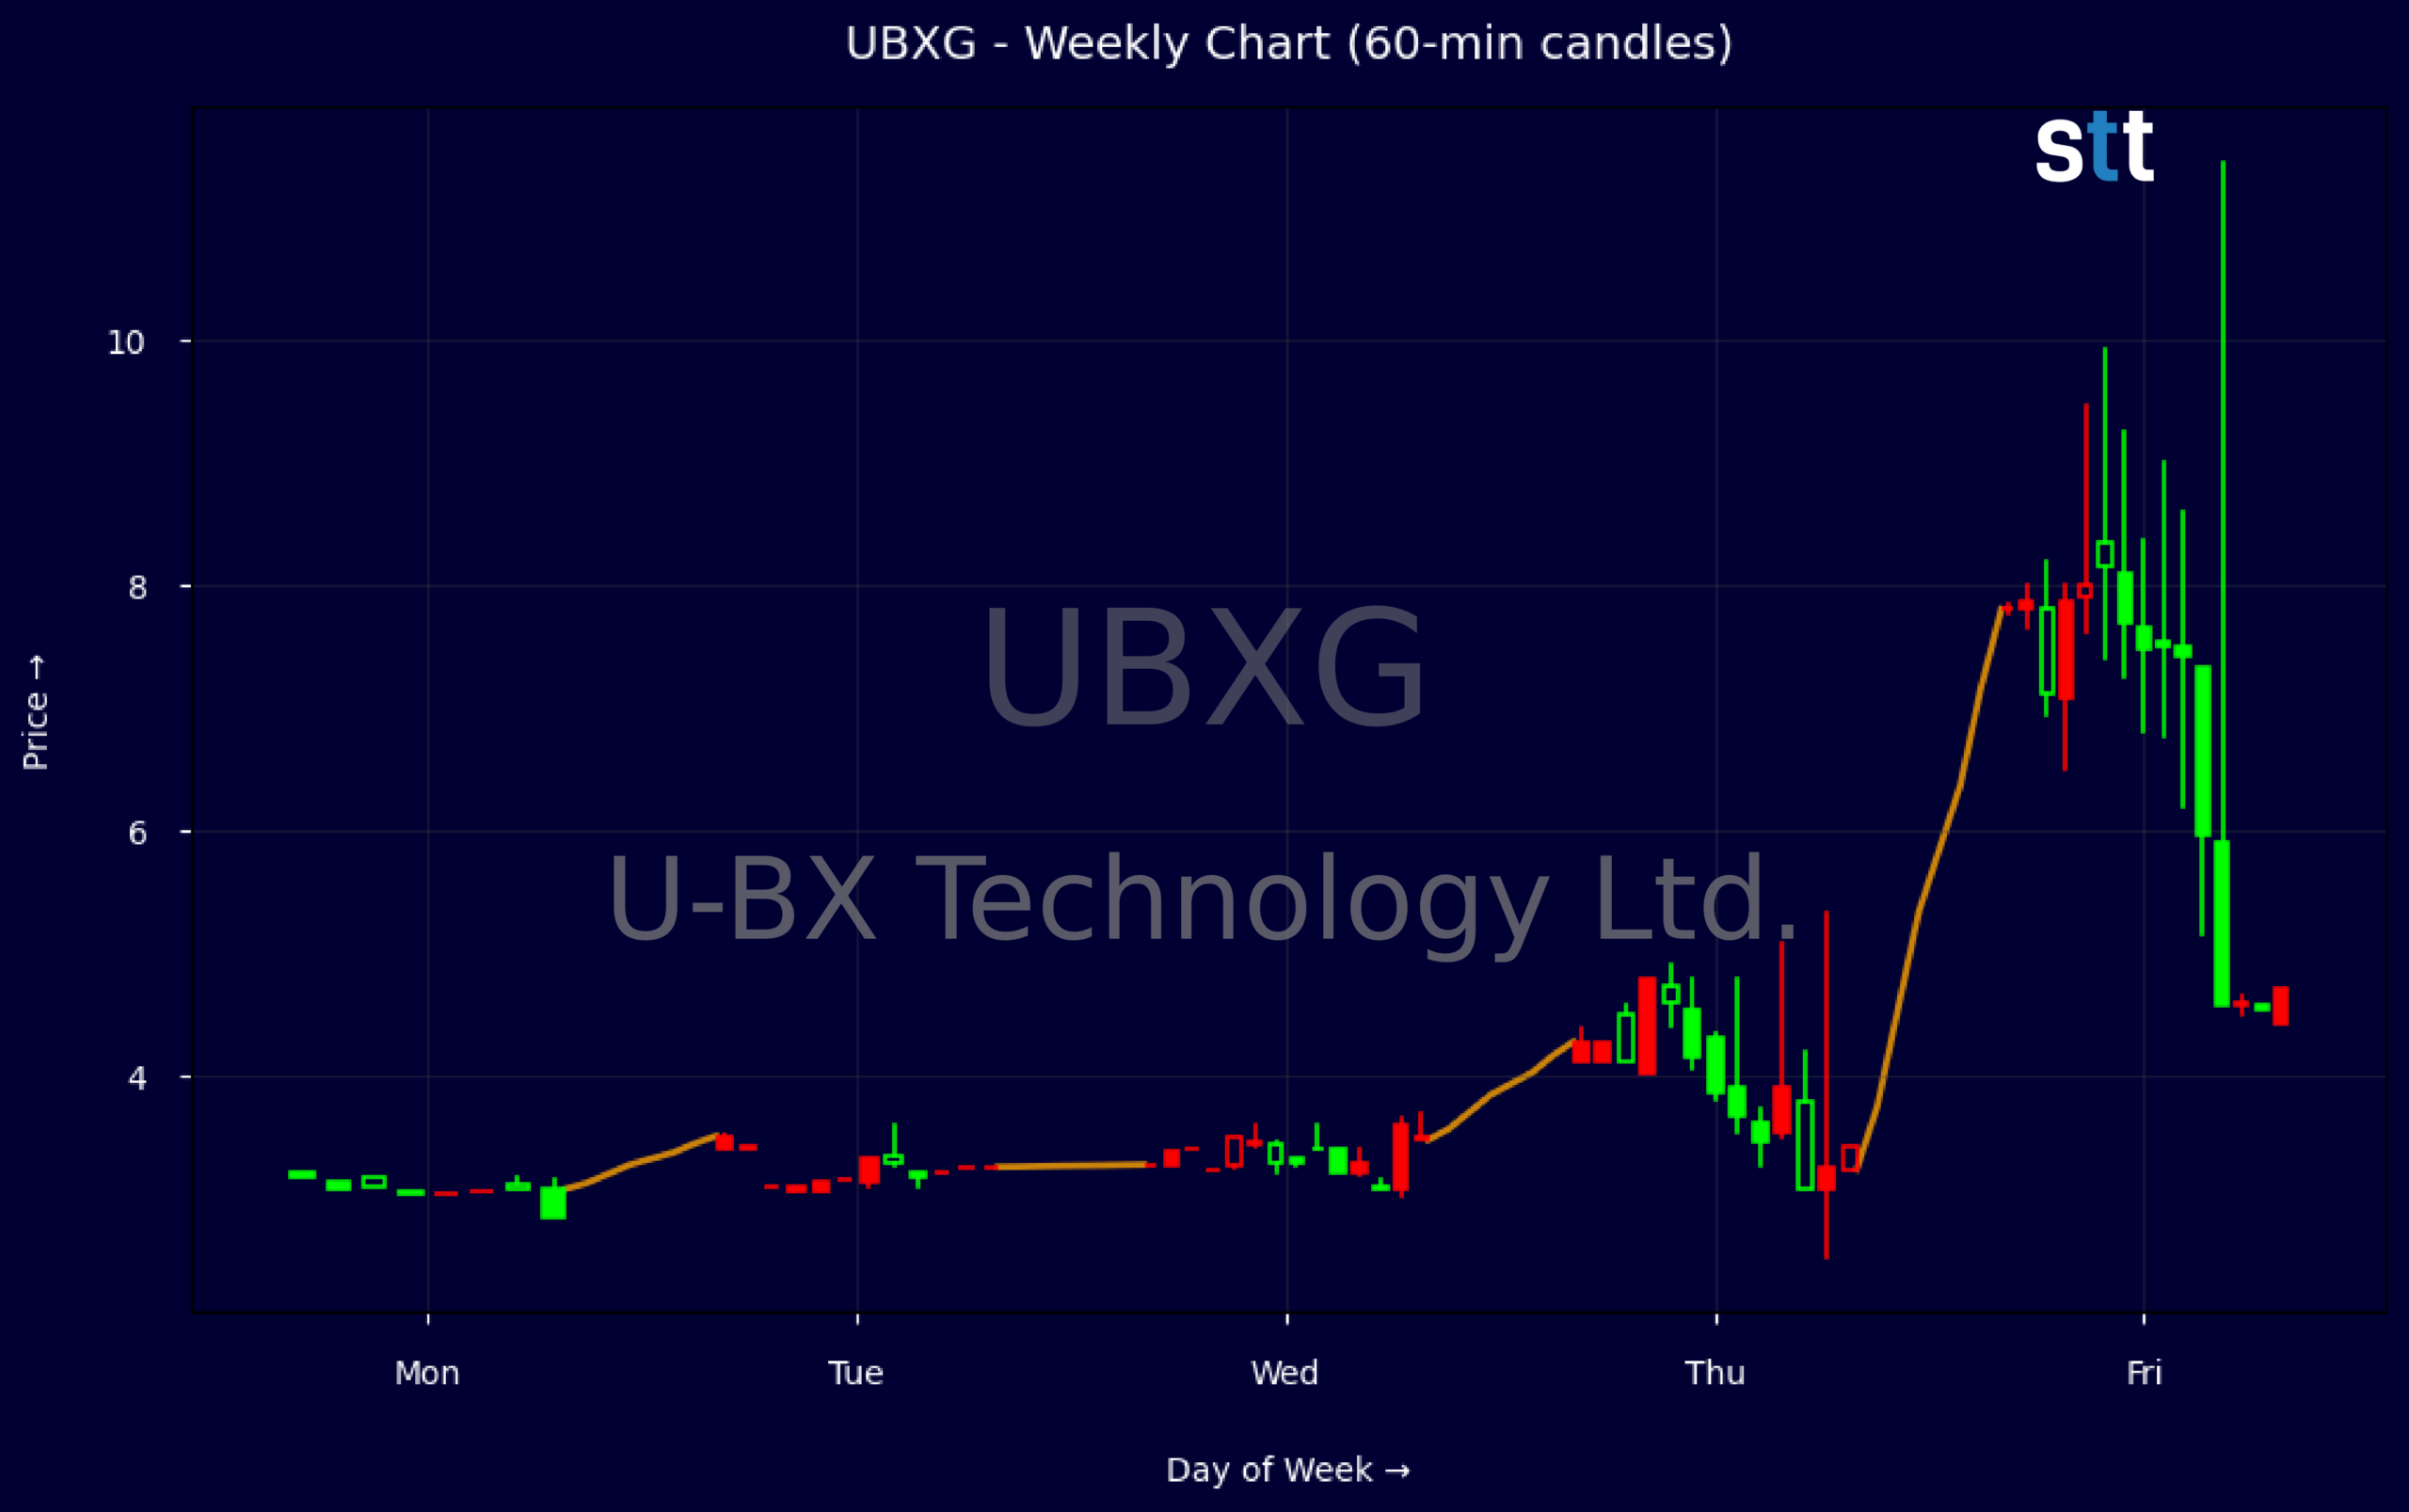
Weekly Update Jun 08 – Jun 12, 2026: On Sunday, June 14, 2026 U-BX Technology Ltd. stock [NASDAQ: UBXG] is trending up by 62.84%! Discover the key drivers behind this movement as well as our expert analysis in the detailed breakdown below.
Technology industry expert:
Analyst sentiment – neutral
UBXG is a micro-cap with $29.7M in revenue and an extremely clean balance sheet: $11.2M cash, negligible long-term debt, and equity of $19.0M. Enterprise value is negative (~-$1.3M), implying the market values the operating business at less than net cash and PPE. However, negative ROIC (-15.8%) and accumulated losses (retained earnings -$3.8M) highlight weak profitability and execution risk. Price-to-sales of 2.1x and price-to-book of 0.3x signal deep value, contingent on business viability.
Technically, UBXG is in a strong near-term uptrend. The weekly data show a sharp breakout from the low $3s to an $8.19 intraday high, closing the week at $7.80 after a gap day at $4.40 and a vertical extension, consistent with a high-volume momentum spike. Intraday 5-minute candles (implied by range and close behavior) indicate aggressive buying with elevated turnover near $7–8. The first actionable level is $6.50: above it, momentum longs are favored; a decisive break below signals exhaustion.
More Breaking News
- INSM Extends Brinsupri Global Reach As Traders Eye Guidance
- BMNR Stock Pulls Back As Traders Gauge Risk
- SOFI Stock Slips As Analyst Warns Of $1B Headwind
- NOK Stock Slides As Earnings Strength Fails To Impress Traders
With no fresh news disclosed, the move appears technically and liquidity-driven rather than fundamentally catalyzed. Relative to Technology and Software & IT Services benchmarks, UBXG trades at a discount to book and at a modest sales multiple, but also lags materially on profitability and scale. Near term, resistance sits at $8.00–8.25, support at $6.50, with a tactical trading band of $6.50–9.00. Verdict: speculative trading vehicle, not yet an institutional-quality core holding.
Quick Financial Overview
UBXG (U-BX Technology Ltd.) combines thin float price action with a balance sheet that looks relatively strong on paper. Total assets of about $20.98M against total liabilities of roughly $1.96M leave equity around $19.02M, which is sizable relative to the current share price zone. Cash of roughly $11.18M means more than half of total assets are in cash and equivalents, giving the company room to operate without immediate funding pressure.
Revenue sits near $29.7M, implying a price-to-sales ratio of about 2.07, which is moderate for a smaller, speculative name. The price-to-book near 0.3 tells traders the market is valuing U-BX Technology Ltd. well below its stated net assets per share of $10.25 book value. At the same time, a negative one-year return on invested capital around -15.81% warns that turning assets into profit has been a struggle.
On the chart, weekly data show UBXG breaking from roughly $3.08–$3.22 up through $4.40 and then spiking to a $7.87 open and $8.19 high, with a $7.80 close. That is a multi-hundred-percent move in days. Intraday, a single 5‑minute candle from about $6.04 to $9.92 before closing at $7.87 displays extreme volatility and an inability to hold the very top of the range, a sign of both strong demand and aggressive selling overhead.
Conclusion
This is stock news, not investment advice. StocksToTrade News delivers real-time stock market updates tailored to highlight the key catalysts driving short-term price movements. Our coverage is designed for active traders and investors who thrive in fast-moving markets, with a focus on volatile sectors like penny stocks, AI stocks, Robinhood stocks and other momentum plays. From earnings reports and FDA approvals to mergers, new contracts, and unusual trading volume, we break down the events that can spark significant price action.
Looking to level up your trading game? Explore StocksToTrade, the ultimate platform for traders. With powerful tools designed for swing and day trading, integrated news scanning, and even social media monitoring, StocksToTrade keeps you one step ahead.
Check out our quick startup guide for new traders!
- How to Read Stock Charts: A Guide for Beginners
- Trading Plan: 6 Steps to Create One
- How To Create a Stock Watchlist
Ready to build your watchlists? Check out these curated lists:
Once your watchlist is set, take the next step and trade with confidence using StocksToTrade’s robust platform. Don’t miss out — grab your 14-day trial for just $7 and experience the edge you need to thrive in today’s fast-paced markets.