

Trulieve Cannabis Corp. Subordinate stocks have been trading down by -10.82 percent amid heightened regulatory and legalization uncertainty.
Market Insights For Active TRLV Traders
- Weekly chart shows TRLV dropping from above $12 to near $10, signaling a sharp pullback and rising short-term selling pressure.
- Intraday action compressed from the low $11s to just above $10, highlighting aggressive intraday selling and potential capitulation.
- Strong gross margin near 60% and solid liquidity give Trulieve Cannabis Corp. Subordinate financial flexibility despite recent net losses.
- Negative profit margins and weak return metrics keep TRLV in turnaround territory, favoring short-term trading over long-term holding.
- Traders are watching whether current levels form a base or break to new lows, as volatility sets up near-term trading opportunities.
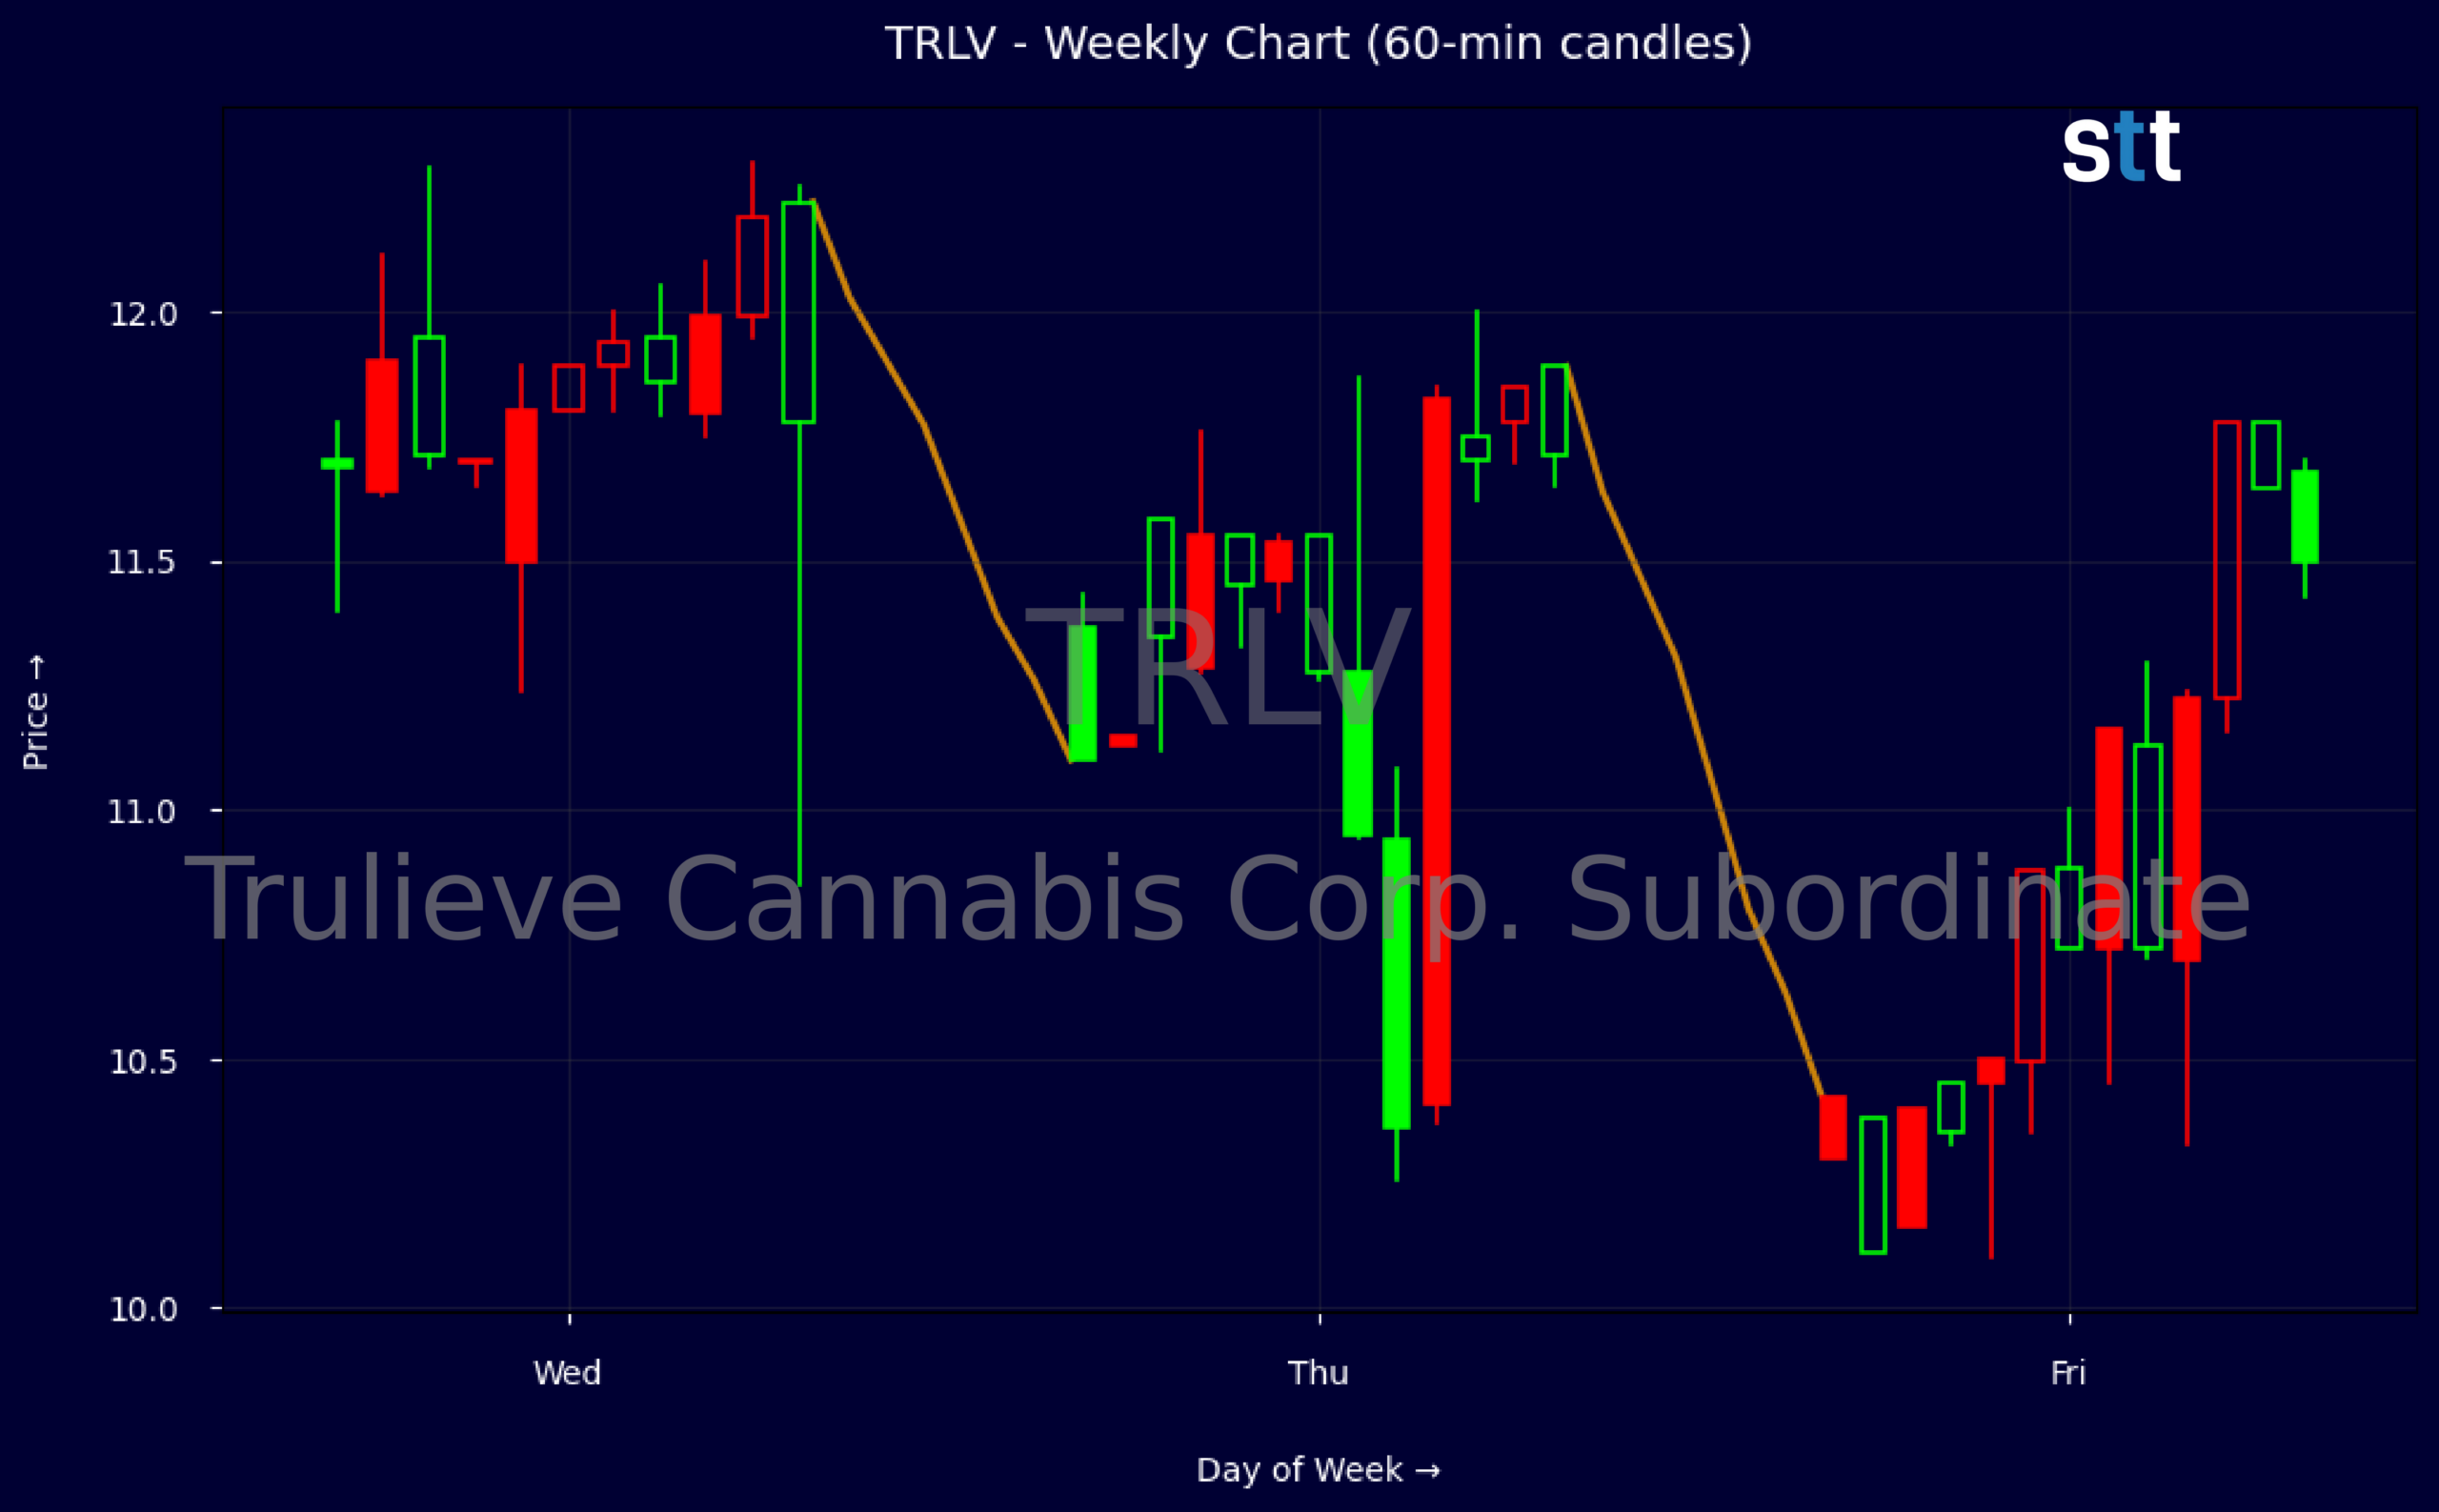
Weekly Update Jun 08 – Jun 12, 2026: On Saturday, June 13, 2026 Trulieve Cannabis Corp. Subordinate stock [NYSE: TRLV] is trending down by -10.82%! Discover the key drivers behind this movement as well as our expert analysis in the detailed breakdown below.
Healthcare industry expert:
Analyst sentiment – neutral
TRLV occupies a niche but defensible position in healthcare services, with $1.18B in revenue and a solid 59.7% gross margin, but structurally weak profitability (profit margin -7%, ROE -9.6%, ROA -4.9%). EBIT margin of 13.4% and EBITDA margin of 28.2% show an economically sound core, yet interest burden and below-scale operations suppress net returns. Balance sheet strength is a clear positive: current ratio 5.3, quick ratio 3.0, debt/equity 0.54, and interest coverage 5.5 provide ample liquidity and covenant safety.
Free cash flow generation is the main offsetting strength to weak GAAP earnings. Latest quarter free cash flow of $55.7M on $286.8M revenue implies an attractive FCF multiple (~8x) versus enterprise value of ~$2.26B and price-to-sales of 1.56, reasonable for a recurring-revenue healthcare platform. Working capital trends are constructive (positive $10.9M shift), and cash balance of $353M gives flexibility for selective M&A or de-levering. However, large goodwill/intangibles ($1.26B) and negative retained earnings highlight historic overpayment and execution missteps.
Technically, TRLV is in a short-term downtrend. The weekly sequence shows a rollover from 12.29 to a 10.1087 intraday low and a weak close at 10.3, confirming lower highs and lower lows. Intraday 5-minute action (declining closes, heavier volume on down candles) validates distribution rather than accumulation. The first important trading level is support near 10.00; a decisive break with volume opens downside toward 9.20, while oversold bounces are likely capped near 11.50 resistance absent fresh catalysts.
More Breaking News
- CareDx CDNA Soars After Earnings Beat And Guidance Hike
- No Analysis Provided
- FDXF Stock Climbs As Momentum Traders Target Freight Play
- CareDx CDNA Rips Higher After Big Earnings Beat And Guidance Hike
The lack of recent company-specific news leaves the stock trading on technicals and sector sentiment. Versus broader Healthcare and Pharma benchmarks, TRLV offers better balance-sheet strength and FCF yield but materially worse ROIC and earnings quality, justifying a valuation discount. Base case is range-bound to slightly negative: accumulate only on confirmed holds above 10.00 with a medium-term target of 12.00 and firm resistance at 12.50; a weekly close below 10.00 warrants exit or short positioning.
Quick Financial Overview
Trulieve Cannabis Corp. Subordinate shows a mix of strong revenue scale and persistent profitability challenges. Recent quarterly revenue of about $286.8M and trailing revenue around $1.18B confirm that TRLV operates at meaningful size. Gross margin near 59.7% is strong, which tells traders the core business can generate high value from each dollar of sales. The problem is further down the income statement, where net margin sits near -7%, and return on equity and assets are firmly negative.
On the balance sheet, TRLV carries roughly $2.78B in total assets and about $1.63B in total liabilities, with stockholders’ equity near $1.17B. Debt metrics look manageable: total debt to equity around 0.54 and interest coverage at 5.5 suggest the company is not under immediate balance sheet stress. Liquidity is a clear positive, with a current ratio near 5.3 and quick ratio around 3, backed by roughly $352.9M in cash. For traders, that means runway is not the near-term issue; execution and operating efficiency are.
The cash flow statement is one of the brighter spots for TRLV. Operating cash flow of about $55.7M and free cash flow around $55.7M in the latest quarter support the price-to-free-cash ratio near 8.1, which is not stretched. On the tape, weekly data show TRLV sliding from the $12.29 area down toward $10.30 over three weeks, with each week printing lower closes. Intraday, a single bar fading from the mid-$11s to just above $10 underlines heavy selling and possible forced exits. This combination of improving cash flow, weak earnings, and accelerating downside price action sets up a classic battleground between bargain hunters and momentum shorts.
Conclusion
This is stock news, not investment advice. StocksToTrade News delivers real-time stock market updates tailored to highlight the key catalysts driving short-term price movements. Our coverage is designed for active traders and investors who thrive in fast-moving markets, with a focus on volatile sectors like penny stocks, AI stocks, Robinhood stocks and other momentum plays. From earnings reports and FDA approvals to mergers, new contracts, and unusual trading volume, we break down the events that can spark significant price action.
Looking to level up your trading game? Explore StocksToTrade, the ultimate platform for traders. With powerful tools designed for swing and day trading, integrated news scanning, and even social media monitoring, StocksToTrade keeps you one step ahead.
Check out our quick startup guide for new traders!
- How to Read Stock Charts: A Guide for Beginners
- Trading Plan: 6 Steps to Create One
- How To Create a Stock Watchlist
Ready to build your watchlists? Check out these curated lists:
Once your watchlist is set, take the next step and trade with confidence using StocksToTrade’s robust platform. Don’t miss out — grab your 14-day trial for just $7 and experience the edge you need to thrive in today’s fast-paced markets.