
Tidewater Inc. stocks have been trading up by 8.18 percent amid bullish sentiment on offshore energy and fleet utilization.
Click Here for a Millionaire's POV on Trading TDW
SUBSCRIBE FOR ALERTSJOIN 50,000+ ACTIVE TRADERS
What Traders Need To Know
- Price has climbed from the low $80s to about $86 this week, showing steady demand and controlled pullbacks.
- Intraday action shows tight ranges and higher lows, a sign of accumulation rather than panic selling.
- Revenue around $1.35B and profit margins near the high teens back the recent strength in TDW.
- A current ratio above 3 and moderate debt levels give Tidewater Inc. flexibility if offshore markets soften.
- Chart structure and solid cash generation keep TDW on many swing traders’ watchlists.
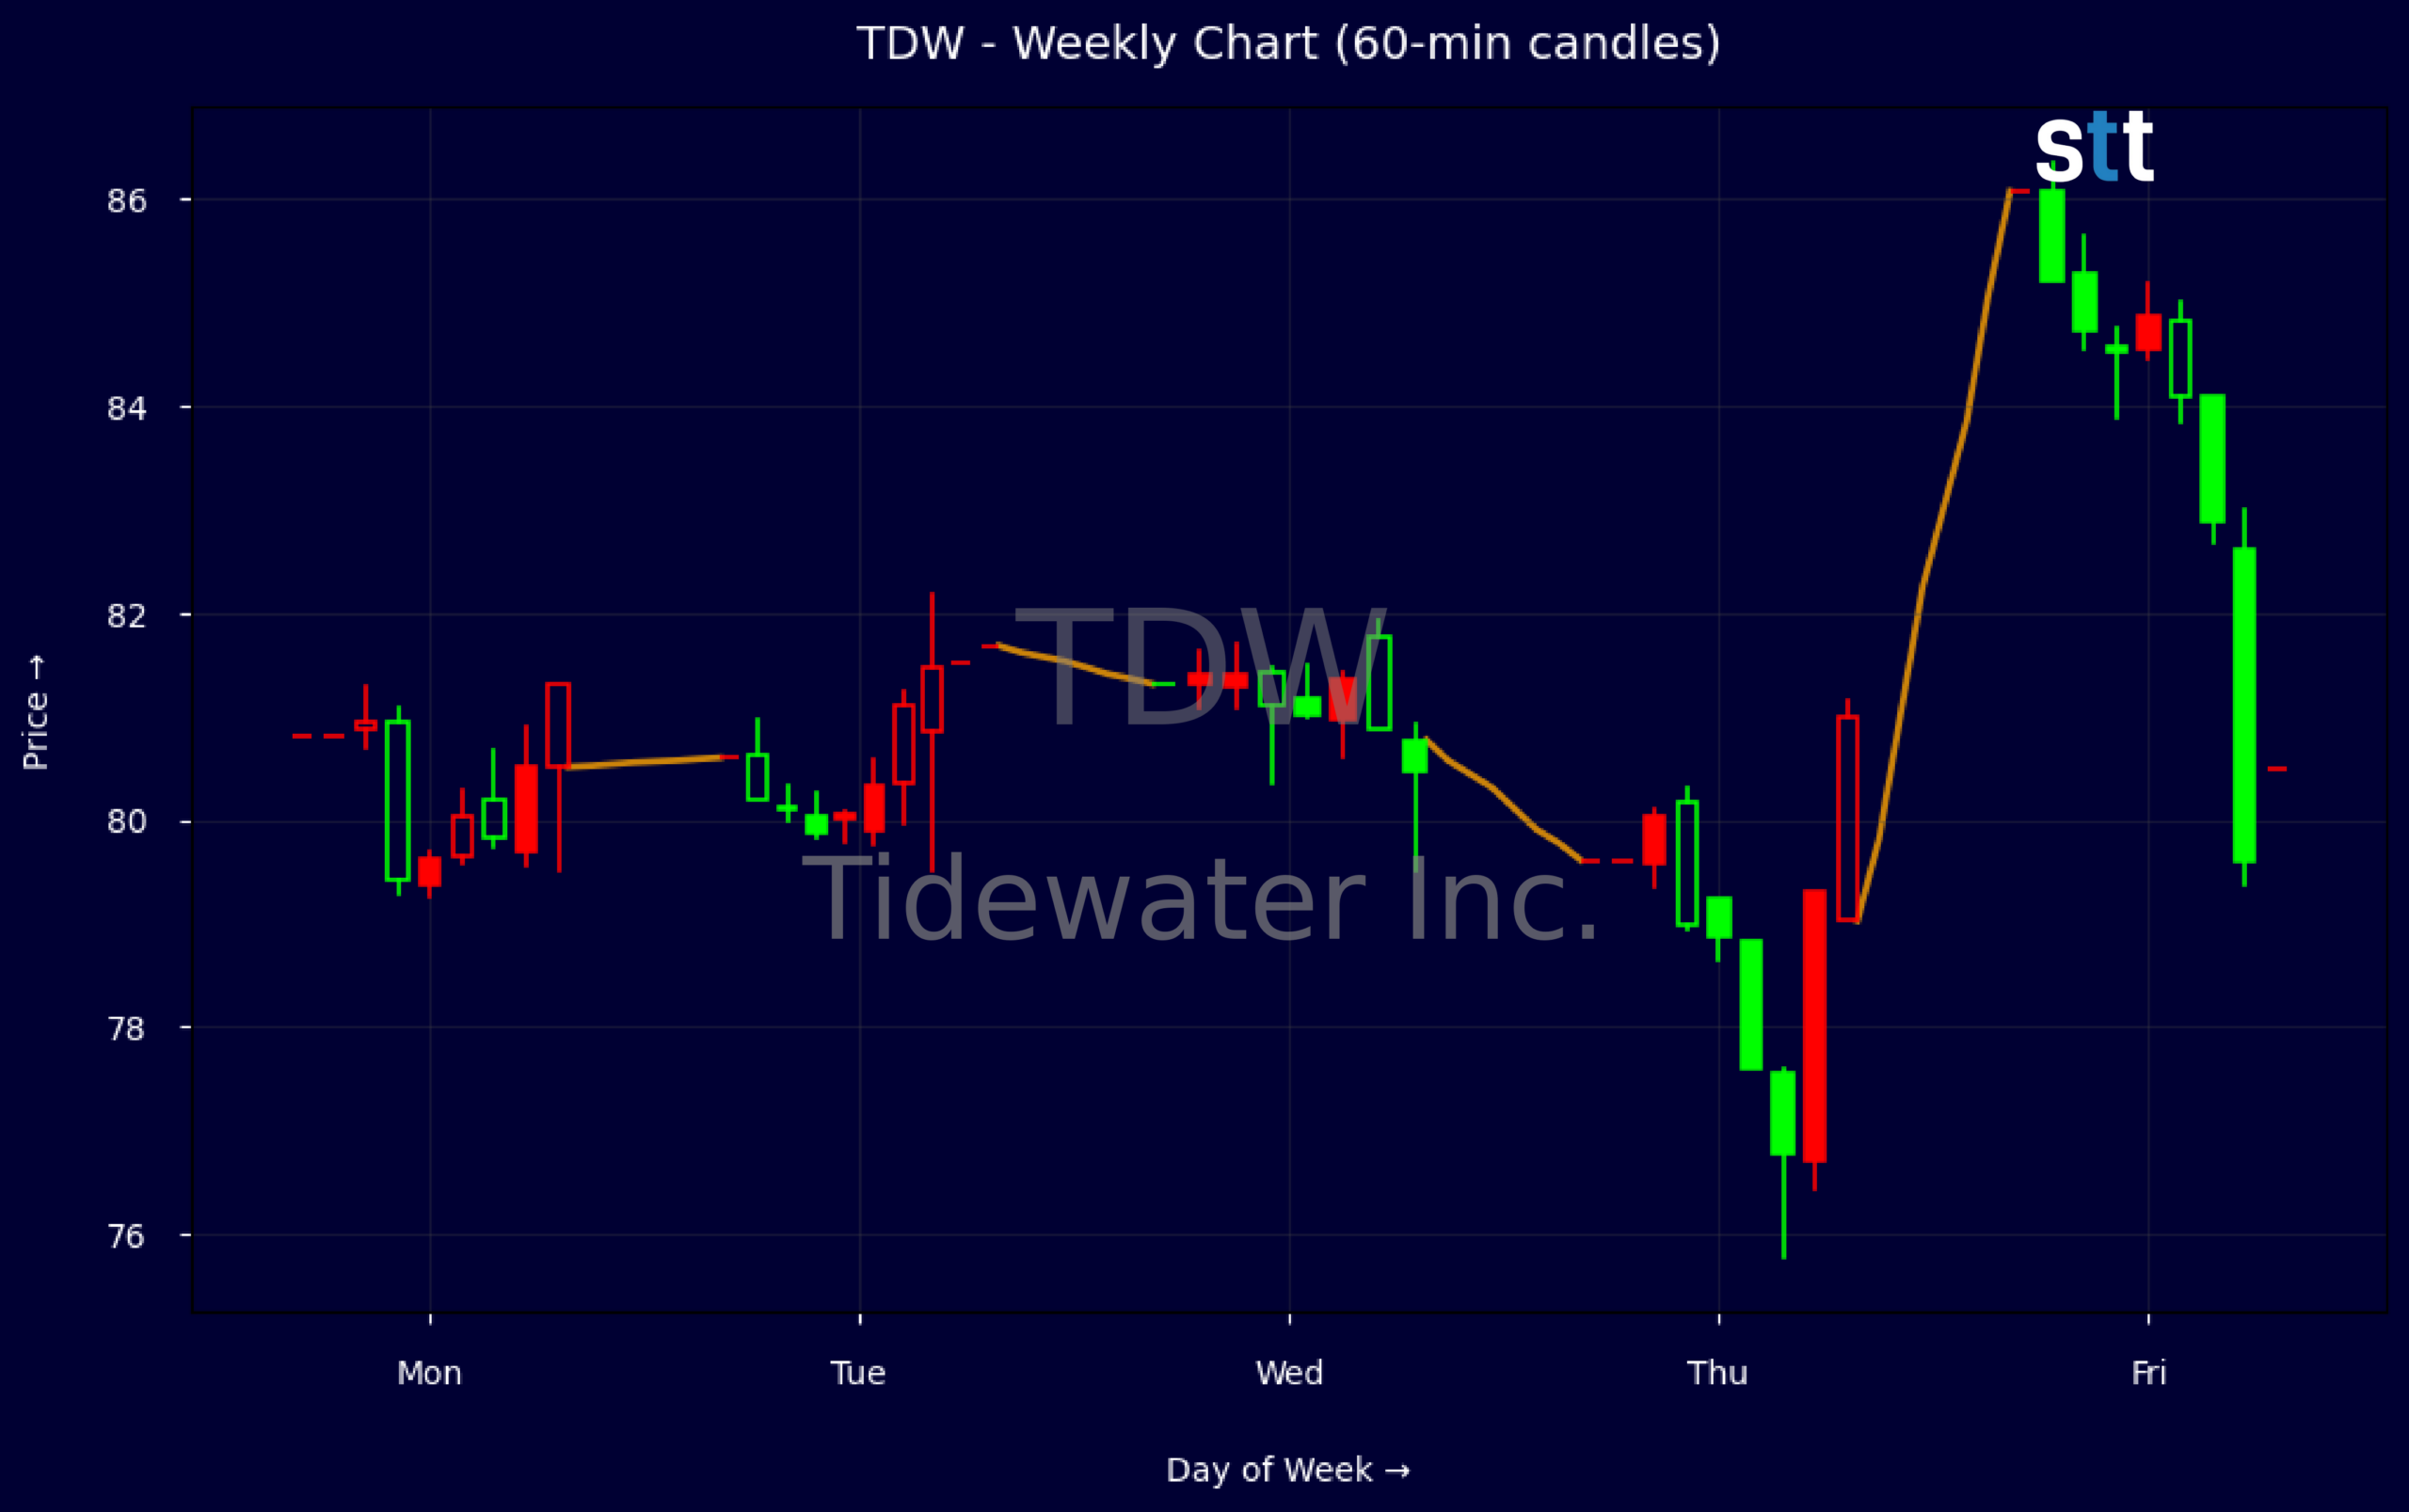
Weekly Update Oct 19 – Oct 23, 2026: On Friday, October 23, 2026 Tidewater Inc. stock [NYSE: TDW] is trending up by 8.18%! Discover the key drivers behind this movement as well as our expert analysis in the detailed breakdown below.
Energy industry expert:
Analyst sentiment – positive
Tidewater (TDW) is a leading global offshore vessel operator, now in a clear upcycle with solid fundamentals following a deep industry downturn. Revenue of ~$1.35B and EBITDA margin of 16.3% reflect expanding dayrates but still-rising cost inflation. ROE of 19.5% and ROIC near 17% confirm strong capital productivity, while net margin above 18% and asset turnover of 0.6 are healthy for a capital-heavy fleet. Leverage is moderate (D/E 0.47), liquidity robust (current ratio 3.6, ~$614M cash).
Technically, TDW shows an aggressive bullish breakout: weekly prints jumped from ~$80–81 consolidation to $86.07, confirming buyers in control. The narrow intraday ranges around prior sessions signal orderly accumulation rather than volatility blow-off. Recent 5-minute action (not shown in detail) supports rising volume on up-moves and lighter volume on dips. Dominant trend is up; first actionable level is $80–82 as high-conviction support to buy pullbacks, with risk tightly defined below $78.
More Breaking News
- CCI Surges As Crown Castle Touted In SpaceX Tower Deal Talks
- SAIQ Stock Rockets As Satellite Momentum Draws Aggressive Trading
- TDW Stock Grinds Higher As Tidewater Holds Near Highs
- SPCH Holds Tight Range As Traders Watch Key Levels
With no adverse company-specific news and offshore activity ramping, TDW should continue to outperform broader Energy and Fossil Fuels indices given its operating leverage to dayrate improvements and disciplined balance sheet. Versus benchmarks, TDW offers superior growth and returns on capital, albeit with higher cyclicality. Near term, key support sits at $80–82, resistance around $90; I target $95–100 over 6–12 months, assuming stable macro and continued offshore spending strength.
Quick Financial Overview
Tidewater Inc. (TDW) is trading near the top of its recent weekly range, with price moving from about $80 at the start of the period to roughly $86 by the latest close. That climb, with no deep shakeouts on the weekly print, signals firm buying interest. For short-term traders, this kind of controlled grind higher often sets up pullback entries rather than big breakdowns.
On the intraday 5‑minute chart, TDW spent the session stepping higher from the low $80s in the morning toward the mid‑$80s and closing near $86. Dips were shallow and quickly bought, and the stock held above prior micro-supports throughout the afternoon. That type of intraday structure suggests systematic demand, not just one headline spike, and it gives day traders clear reference levels for risk.
Fundamentally, TDW is putting up about $1.35B in annual revenue with profit margins in the high teens and a gross margin near 28%. A P/E near 17 and price‑to‑sales a bit over 3 place it in a premium zone compared with deep value names, but the premium is backed by double‑digit returns on equity and improving cash flows. The balance sheet shows a current ratio around 3.6 and total debt to equity under 0.5, which means Tidewater Inc. has room to ride out sector swings while still funding its fleet and operations.
Conclusion
Tidewater Inc. is printing the kind of chart that many momentum traders look for: clear higher lows on the week and a session that closed near the high of the day. Price has worked from roughly $80 to $86 without big wicks or wide ranges, which tells you supply is getting absorbed rather than dumped. When you combine that with solid profitability, rising revenue, and clean liquidity, TDW screens as a name where dips can matter more than breakouts. As Tim Bohen, lead trainer with StocksToTrade says, “There’s a pattern in everything; you just have to stick around long enough to see it.”, and Tidewater’s current tape is a good example of why patient pattern recognition matters so much in trading.
At the same time, traders need to respect the risk side of the tape. A stock trading at about 3 times sales and over 3 times book can move fast if offshore energy sentiment turns. The intraday chart gives obvious levels: prior intraday support in the low‑to‑mid $80s is the first area to watch for failed bounces or fresh bids. For swing traders tracking Tidewater Inc., the key is to let the price action confirm strength above those levels before sizing up. As I often tell my students, “Your job is not to predict the next dollar in TDW, it’s to define your levels, wait for confirmation, and only then step in with controlled risk.”
This is stock news, not investment advice. StocksToTrade News delivers real-time stock market updates tailored to highlight the key catalysts driving short-term price movements. Our coverage is designed for active traders and investors who thrive in fast-moving markets, with a focus on volatile sectors like penny stocks, AI stocks, Robinhood stocks and other momentum plays. From earnings reports and FDA approvals to mergers, new contracts, and unusual trading volume, we break down the events that can spark significant price action.
Looking to level up your trading game? Explore StocksToTrade, the ultimate platform for traders. With powerful tools designed for swing and day trading, integrated news scanning, and even social media monitoring, StocksToTrade keeps you one step ahead.
Check out our quick startup guide for new traders!
- How to Read Stock Charts: A Guide for Beginners
- Trading Plan: 6 Steps to Create One
- How To Create a Stock Watchlist
Ready to build your watchlists? Check out these curated lists:
Once your watchlist is set, take the next step and trade with confidence using StocksToTrade’s robust platform. Don’t miss out — grab your 14-day trial for just $7 and experience the edge you need to thrive in today’s fast-paced markets.