

T1 Energy Inc. stocks have been trading up by 10.2 percent after securing a transformative long-term LNG supply contract
Key Takeaways
- TE has bounced from late-October lows near $2.08 to recent closes around $2.80, showing a short-term uptrend after heavy selling.
- T1 Energy Inc. posts $755.3M in revenue but runs negative margins, with TE still burning cash and relying on debt-funded growth.
- Intraday action on TE around $3.10 shows a tight, liquid range, hinting at a possible volatility expansion.
- T1 Energy Inc. carries high leverage with debt-to-equity near 2.8, making TE especially sensitive to sector and rate moves.
- Active traders are watching support in the mid-$2.50s and resistance near $3 for the next decisive trend in TE.
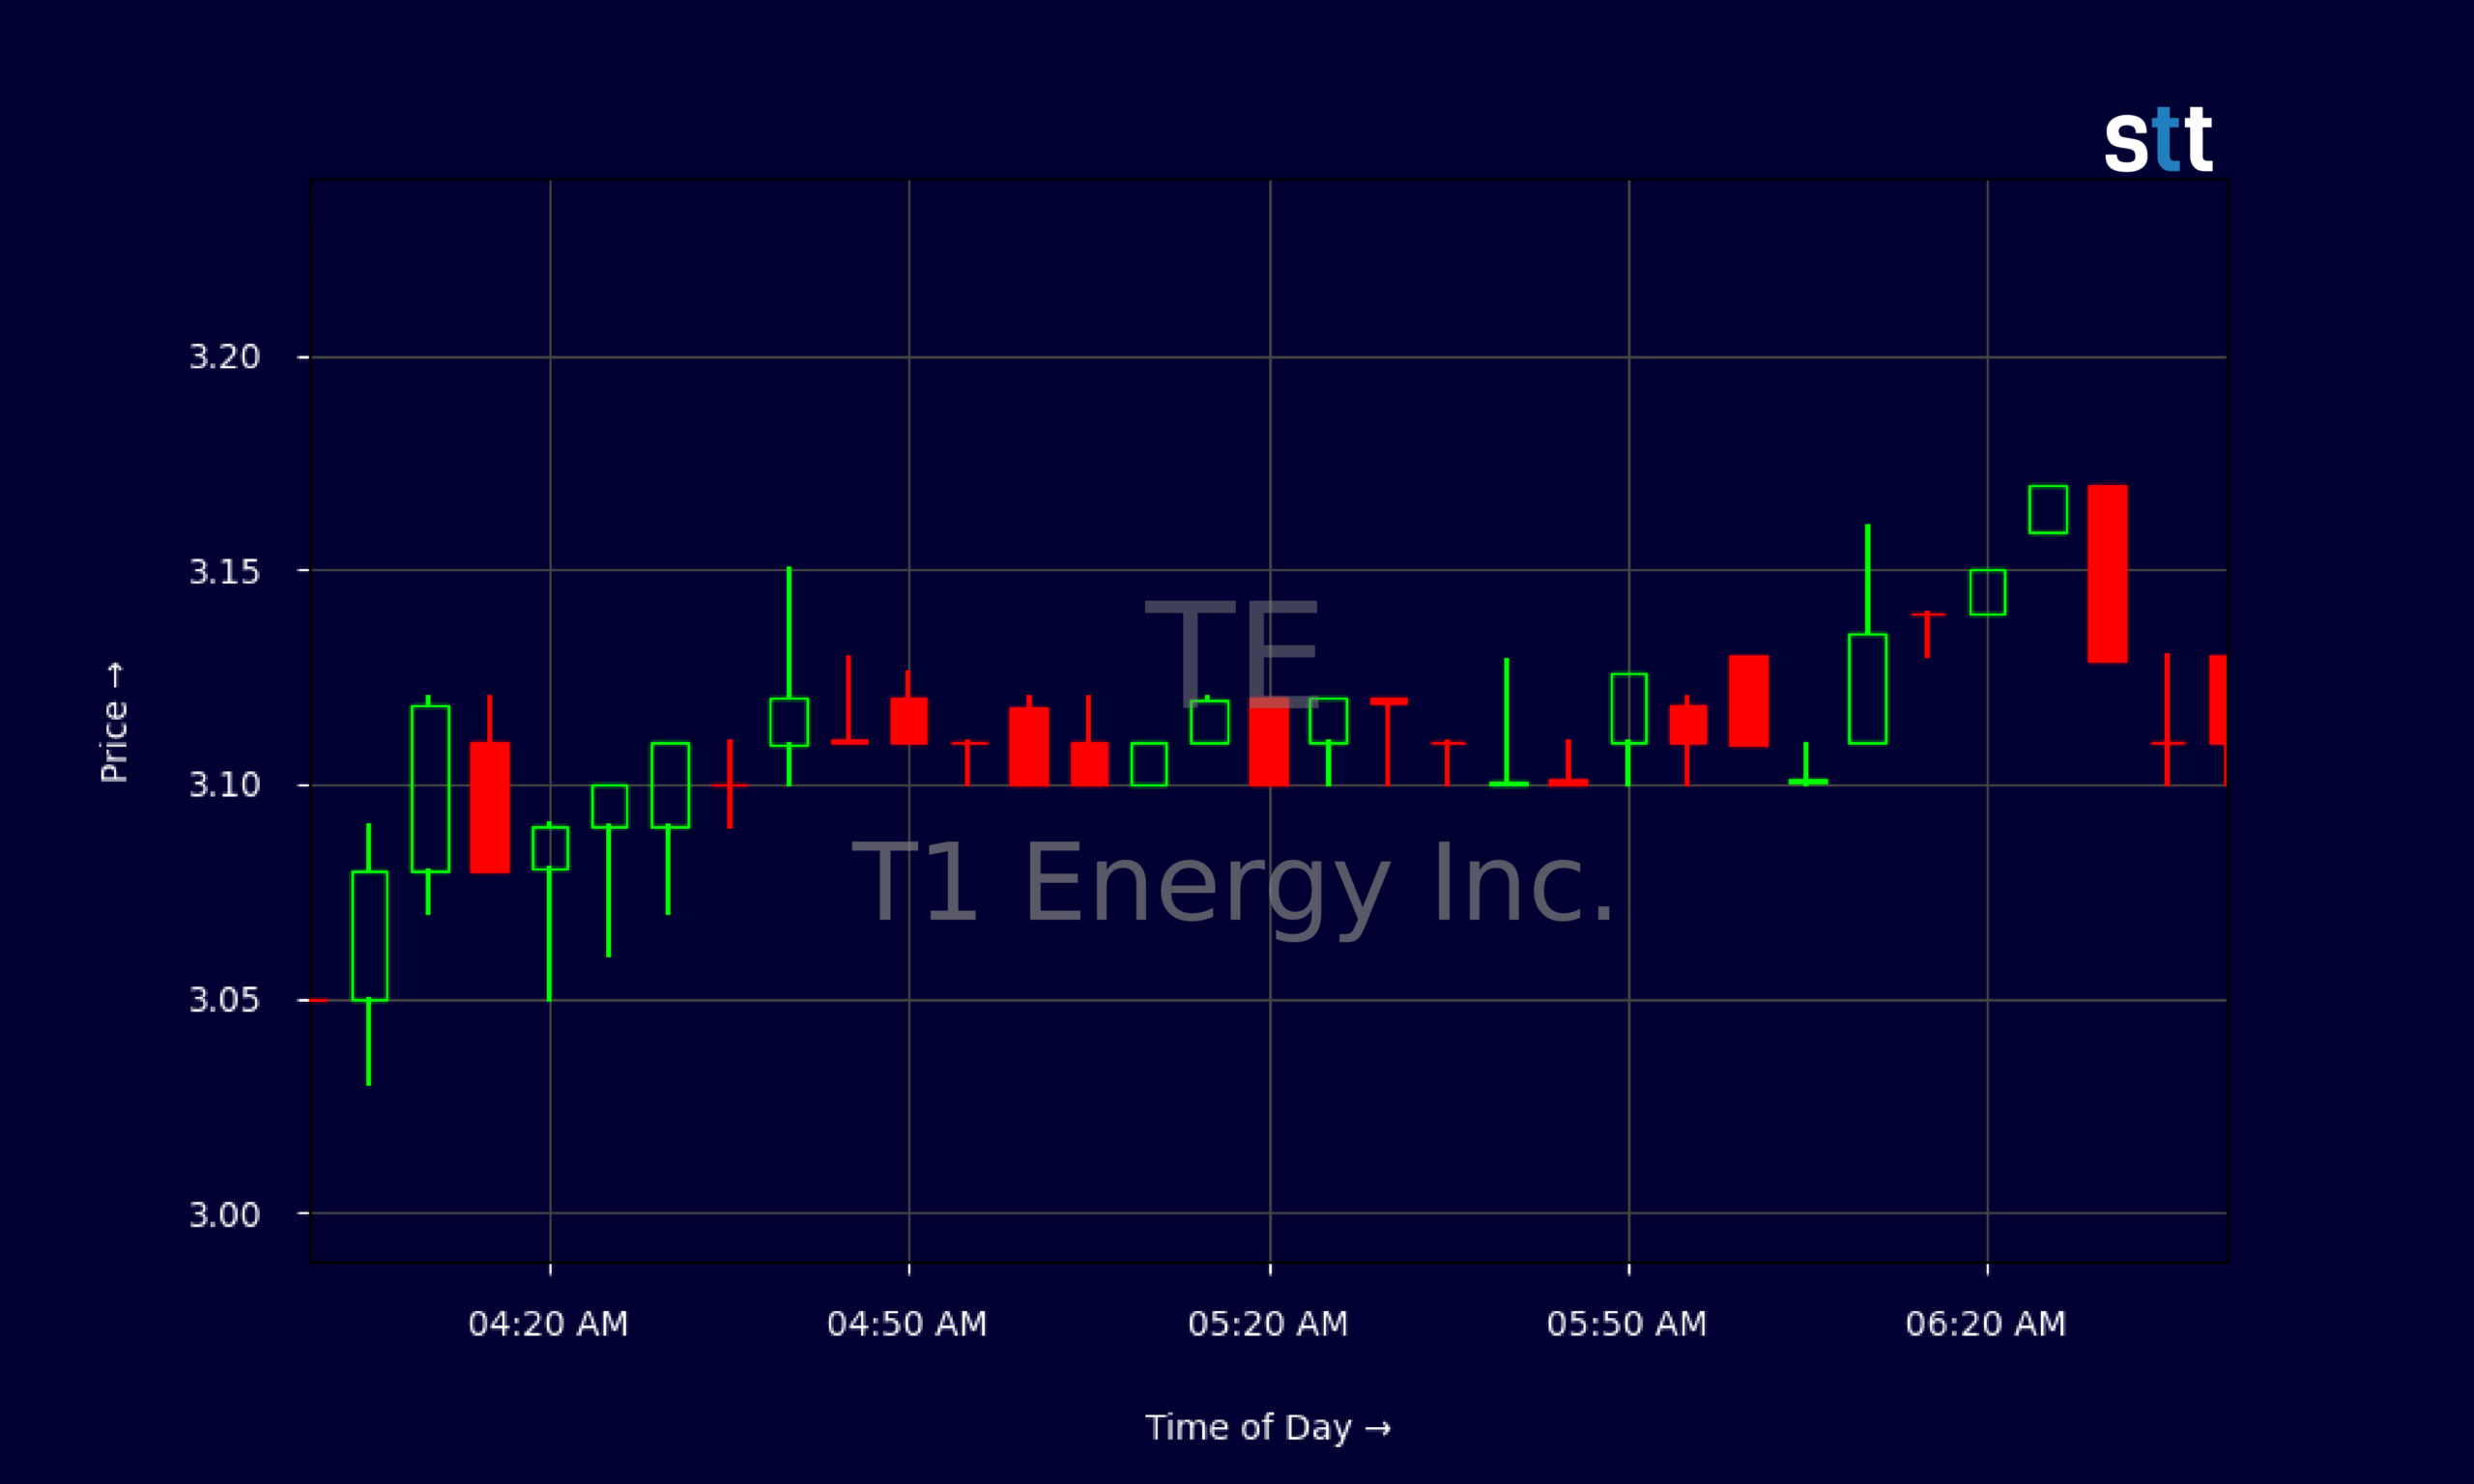
Live Update At 06:47:02 EST: On Wednesday, November 04, 2026 T1 Energy Inc. stock [NYSE: TE] is trending up by 10.2%! Discover the key drivers behind this movement as well as our expert analysis in the detailed breakdown below.
Quick Financial Overview
TE is trading like a classic high-risk, high-reward small-cap. On the income side, T1 Energy Inc. generated about $755.3M in revenue, yet its profit picture is rough. Gross margin is thin at 8.4%, and key metrics like EBIT margin at -28.8% and profit margin around -32% show that TE is still losing money on its core business. That loss flows through to the bottom line, with TE posting about -$43.5M in quarterly net income and roughly -$0.16 per share.
On the balance sheet, T1 Energy Inc. shows total assets of about $1.64B, but only $79.1M in cash against $549.9M in total debt (current plus long term). TE’s total debt-to-equity ratio of 2.83 and long-term debt making up 72% of capital underline the leverage risk. The current ratio around 1.3 offers some near-term breathing room, but the quick ratio of 0.3 says TE depends heavily on inventory and receivables.
More Breaking News
- Unity Software Stock Jumps As Google AI Deal Ignites Bull Case
- SK Hynix Slips 0% As NVIDIA Earnings Boost Fades
- SNAP Stock Slips As User Miss, Regulation Weigh On Outlook
- AEHL Stock Slides As Volatility Fades, Traders Eye Next Move
Cash flow tells the same story. T1 Energy Inc. posted negative operating cash flow of about -$30.1M and free cash flow of roughly -$131.2M in the latest quarter, with heavy capital spending. For traders, TE is a turnaround and momentum play, not a safety trade.
Why Traders Are Watching TE’s Price Action
The chart is where TE gets interesting. Over the last several weeks, T1 Energy Inc. shares slid from the low $3s, bottomed near $2.08 on 2026/10/26, then snapped back above $2.80. That move turned a clear downtrend into a potential short-term reversal. TE’s daily candles now show higher lows from $2.08 to $2.36, then to $2.49 and $2.62, building a rising base under price.
At the same time, T1 Energy Inc. is struggling to reclaim the key $3 level, which acted as support before the breakdown and now looks like overhead supply. On 2026/10/29, TE spiked to $2.91 but closed off highs at $2.86. On 2026/11/03, T1 Energy Inc. dipped early to $2.62 and still finished strong at $2.83. This is textbook “buy-the-dip vs. sell-the-rip” tug-of-war.
Look at the intraday 5‑minute chart near $3.10. TE trades in a super-tight band between roughly $3.05 and $3.17 for more than an hour. That’s coiled price action. When a stock like T1 Energy Inc. grinds in such a narrow range with repeated tests of the same levels, traders prepare for a volatility burst. A clean push through $3.20 with volume could trigger a squeeze toward the prior $3.30–$3.33 zone from mid-October. A rejection near $3.10–$3.20 and a push back under $2.70 would tell traders the bounce is stalling.
For active day and swing traders, TE is now a technical story: rising short-term trend, clear resistance above, defined support below, and a fundamental backdrop that adds risk premium to every move.
Conclusion
T1 Energy Inc. sits at the crossroad where fundamentals look weak, but trading setups look strong. TE is unprofitable, heavily leveraged, and burning cash to grow. Margins are negative, returns on equity and assets are deeply in the red, and free cash flow is sharply negative. Yet the market rarely waits for perfect fundamentals. It trades the tape in front of it.
Right now, that tape says TE is climbing off its lows. T1 Energy Inc. has put in a short-term floor around the low $2s and is battling sellers near $3. For disciplined traders, that defines the battlefield. Above $3.20, TE has room to run toward prior highs. Below roughly $2.50, the uptrend thesis cracks and T1 Energy Inc. can quickly revisit those October lows.
The key is treating TE like what it is: a volatile, speculative energy name where risk control matters more than being “right.” As Tim Sykes loves to repeat, “Cut losses quickly — that’s the rule that keeps you in the game.” Just as importantly, traders should avoid forcing a setup that isn’t truly there; as Tim Bohen, lead trainer with StocksToTrade says, “If you’re still guessing at the end of your analysis, it’s probably not a trade worth taking.” Traders studying TE should focus on exactly that: clear levels, tight risk, and no hesitation to exit if T1 Energy Inc. breaks their plan. This content is for educational and research purposes only, but the lessons from TE’s chart and numbers are real for any active trader.
This is stock news, not investment advice. StocksToTrade News delivers real-time stock market updates tailored to highlight the key catalysts driving short-term price movements. Our coverage is designed for active traders and investors who thrive in fast-moving markets, with a focus on volatile sectors like penny stocks, AI stocks, Robinhood stocks and other momentum plays. From earnings reports and FDA approvals to mergers, new contracts, and unusual trading volume, we break down the events that can spark significant price action.
Looking to level up your trading game? Explore StocksToTrade, the ultimate platform for traders. With powerful tools designed for swing and day trading, integrated news scanning, and even social media monitoring, StocksToTrade keeps you one step ahead.
Check out our quick startup guide for new traders!
- How to Read Stock Charts: A Guide for Beginners
- Trading Plan: 6 Steps to Create One
- How To Create a Stock Watchlist
Ready to build your watchlists? Check out these curated lists:
Once your watchlist is set, take the next step and trade with confidence using StocksToTrade’s robust platform. Don’t miss out — grab your 14-day trial for just $7 and experience the edge you need to thrive in today’s fast-paced markets.