

T1 Energy Inc. secured a transformative multi-year LNG supply contract, and its stocks have been trading up by 10.3 percent.
Key Takeaways
- TE has slipped from above $3.20 to the mid‑$2s, but the latest daily candles show the stock trying to stabilize after heavy selling.
- T1 Energy Inc. is growing revenue to about $755.3M, yet deep negative margins and losses keep pressure on the share price.
- Leverage is high, with debt far above equity, making risk management critical for anyone trading TE.
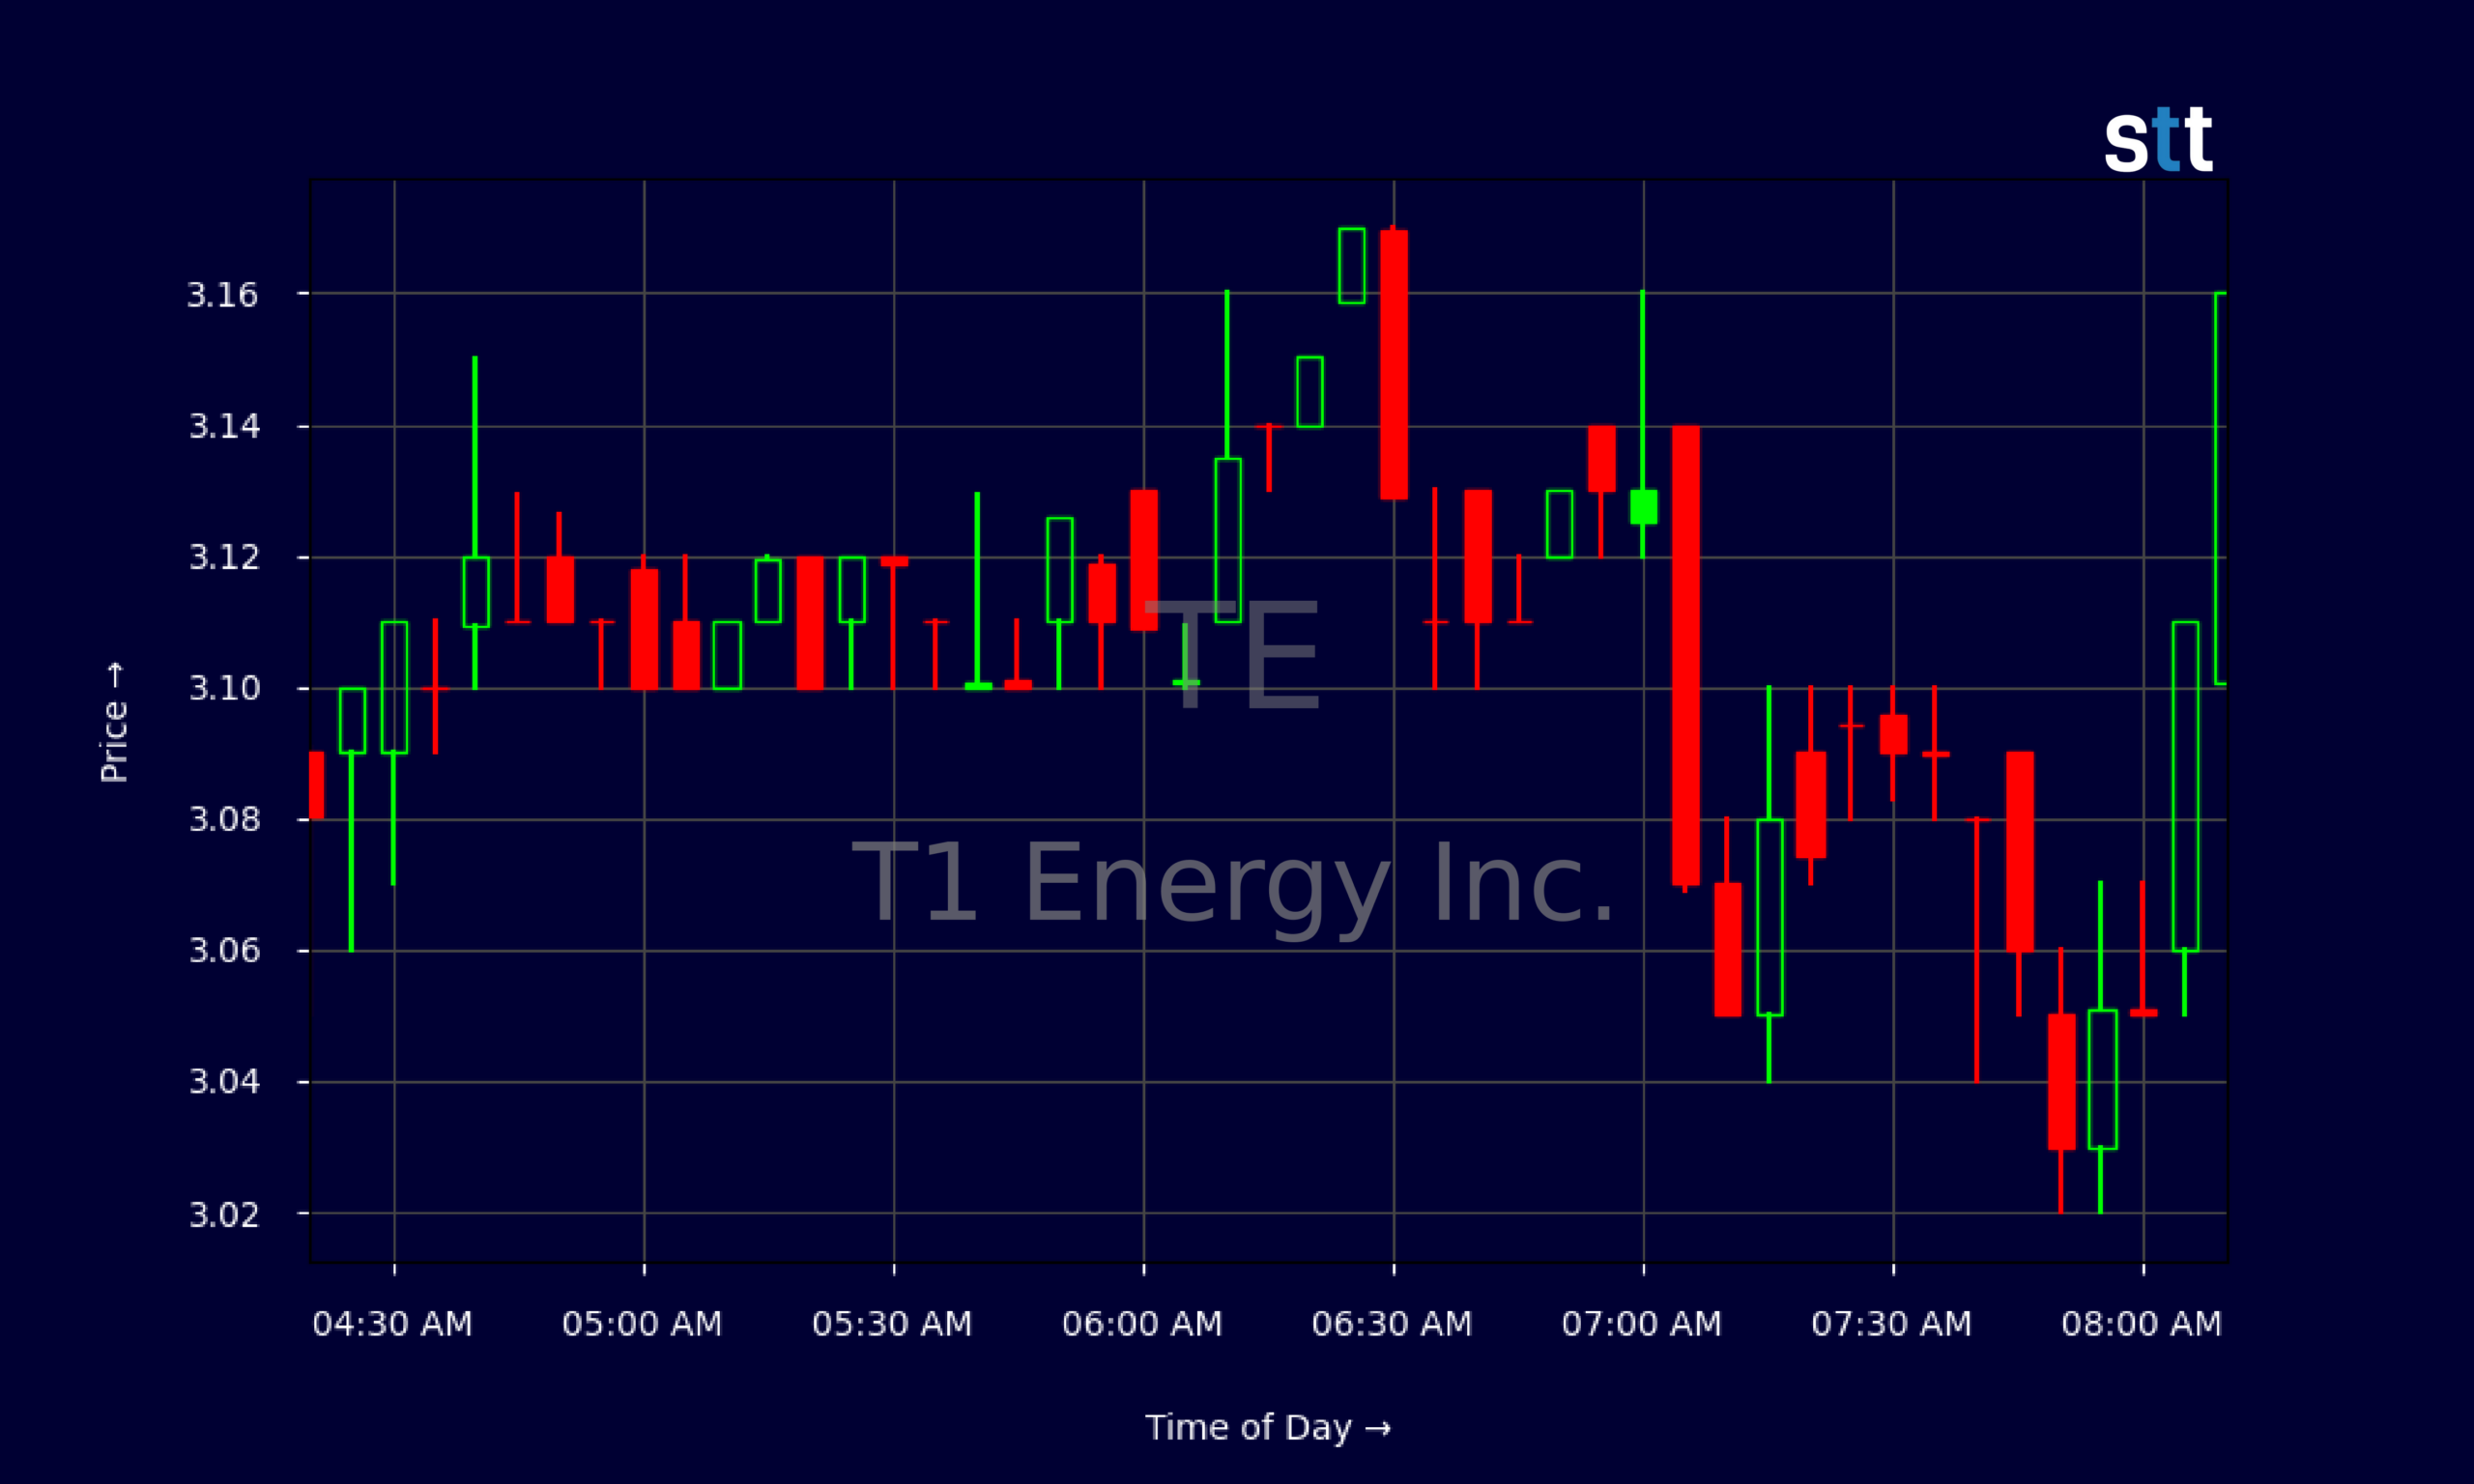
- Recent intraday action in TE around $3 shows tight consolidation, signaling a key battleground between bulls and bears.
Live Update At 08:18:06 EST: On Wednesday, November 04, 2026 T1 Energy Inc. stock [NYSE: TE] is trending up by 10.3%! Discover the key drivers behind this movement as well as our expert analysis in the detailed breakdown below.
Quick Financial Overview
T1 Energy Inc., trading under ticker TE, is a classic high‑risk, high‑reward story that experienced traders know well. On the surface, revenue looks solid. TE booked roughly $755.3M over the trailing period and posted $250.1M in sales for the latest reported quarter. That’s real scale. But when you dig into the margins, the problem jumps out fast.
Gross margin for T1 Energy Inc. is only 8.4%, which is thin for an energy‑related name trying to service heavy debt. After operating costs, TE shows an EBIT margin of about ‑28.8% and a net margin near ‑39.6%. In plain terms, TE is losing money on the bottom line even as it grows the top line.
More Breaking News
- GRAB Stock Surges As Q3 Earnings Beat Fuels Momentum
- JOBY Stock Pops As Air Force Cash And Q3 Beat Fuel eVTOL Hype
- SPCH ETF Pullback Draws Active Traders To Volatile Setup
- AEHL Stock Pulls Back As Volatility Grips Low-Float Name
Cash flow tells the same story. In the latest quarter, T1 Energy Inc. burned roughly $131.2M in free cash flow while relying on about $169.7M of new debt to plug the gap. Enterprise value sits near $1.54B, with a price‑to‑sales ratio around 1.0 — not expensive on sales, but the losses and leverage justify the discount. For traders, TE is all about timing the volatility, not buying a tidy balance sheet.
Why Traders Are Watching TE Price Action
The chart on T1 Energy Inc. has been busy. Over the last couple of weeks, TE ran from the low‑$2s to above $3.30 and then faded back toward the mid‑$2s. That is a textbook momentum swing name. The recent high near $3.33 and the pullback to about $2.56 show traders taking quick profits and shorts leaning in once the breakout stalled.
Look at the daily candles. TE climbed off a $2.08 low, pushed through $2.90, and briefly tapped the low‑$3s before sellers hit it. The latest close around $2.83 still sits well above the prior base near $2.10–$2.20, so the uptrend is not broken yet. For now, T1 Energy Inc. is in a battle zone: bulls defending that $2.40–$2.60 support area, bears capping it into the $3s.
The intraday five‑minute chart around $3 tells the same story in finer detail. From about 04:00 to 08:16, TE printed a tight band between roughly $3.05 and $3.17, with repeated rejections above $3.15 and quick bounces off $3.10. That kind of compression after a strong run often leads to a sharp move either way.
Short‑term traders watching TE should focus on those clear levels. A clean push and hold over $3.20 with volume would signal fresh momentum. A crack back under $2.50 on heavy selling would warn that the recent run is unwinding. T1 Energy Inc. is giving the ranges; the job is to trade the reaction, not the story.
Conclusion
From a fundamentals view, T1 Energy Inc. is not a safe, steady compounder. TE carries total debt‑to‑equity around 2.83, with long‑term obligations near $500.4M and total liabilities of about $1.37B against equity of only $275.3M. Returns on equity and assets are deeply negative, and TE is still burning over $30M in operating cash in a single quarter. That leverage and cash burn raise the stakes for every trade.
At the same time, T1 Energy Inc. does have real assets — roughly $1.64B in total assets, including $648.7M of net property, plant, and equipment and over $215M in goodwill and intangibles. Current assets exceed current liabilities, giving TE some near‑term breathing room with a current ratio around 1.3. The market is weighing those assets and revenues against the ongoing losses and heavy interest load, and that tug‑of‑war is exactly what we see on the chart.
For active traders, TE is a tactical vehicle, not a “set and forget” play. It rewards those who map key levels, track volume, and respect risk. As Tim Sykes loves to say, “The market doesn’t care about your opinion, only your discipline.” That focus on discipline lines up with another key trading principle: As Tim Bohen, lead trainer with StocksToTrade says, “For me, trading is more about managing risk than finding the next big mover.”. With T1 Energy Inc., discipline means cutting losses quickly if support fails, locking in wins on spikes, and never confusing a volatile chart for a guarantee. This content is for educational and research purposes only and is not investment advice.
This is stock news, not investment advice. StocksToTrade News delivers real-time stock market updates tailored to highlight the key catalysts driving short-term price movements. Our coverage is designed for active traders and investors who thrive in fast-moving markets, with a focus on volatile sectors like penny stocks, AI stocks, Robinhood stocks and other momentum plays. From earnings reports and FDA approvals to mergers, new contracts, and unusual trading volume, we break down the events that can spark significant price action.
Looking to level up your trading game? Explore StocksToTrade, the ultimate platform for traders. With powerful tools designed for swing and day trading, integrated news scanning, and even social media monitoring, StocksToTrade keeps you one step ahead.
Check out our quick startup guide for new traders!
- How to Read Stock Charts: A Guide for Beginners
- Trading Plan: 6 Steps to Create One
- How To Create a Stock Watchlist
Ready to build your watchlists? Check out these curated lists:
Once your watchlist is set, take the next step and trade with confidence using StocksToTrade’s robust platform. Don’t miss out — grab your 14-day trial for just $7 and experience the edge you need to thrive in today’s fast-paced markets.