

T1 Energy Inc. stocks have been trading up by 8.96 percent after securing a landmark long-term LNG supply contract.
Key Takeaways
- TE has bounced from October lows near $2.08 to around $2.79, signaling a short-term uptrend after heavy selling.
- T1 Energy Inc. is still losing money, with negative margins and returns, but revenue sits around $755.3M, giving the story real scale.
- High leverage and a debt-to-equity ratio near 2.8 keep risk elevated for TE and force traders to respect downside.
- Intraday TE action shows steady grinding higher, with dips near $2.70 getting bought repeatedly.
- Active traders are watching TE as a potential momentum play, not a safe long-term hold, based on current numbers.
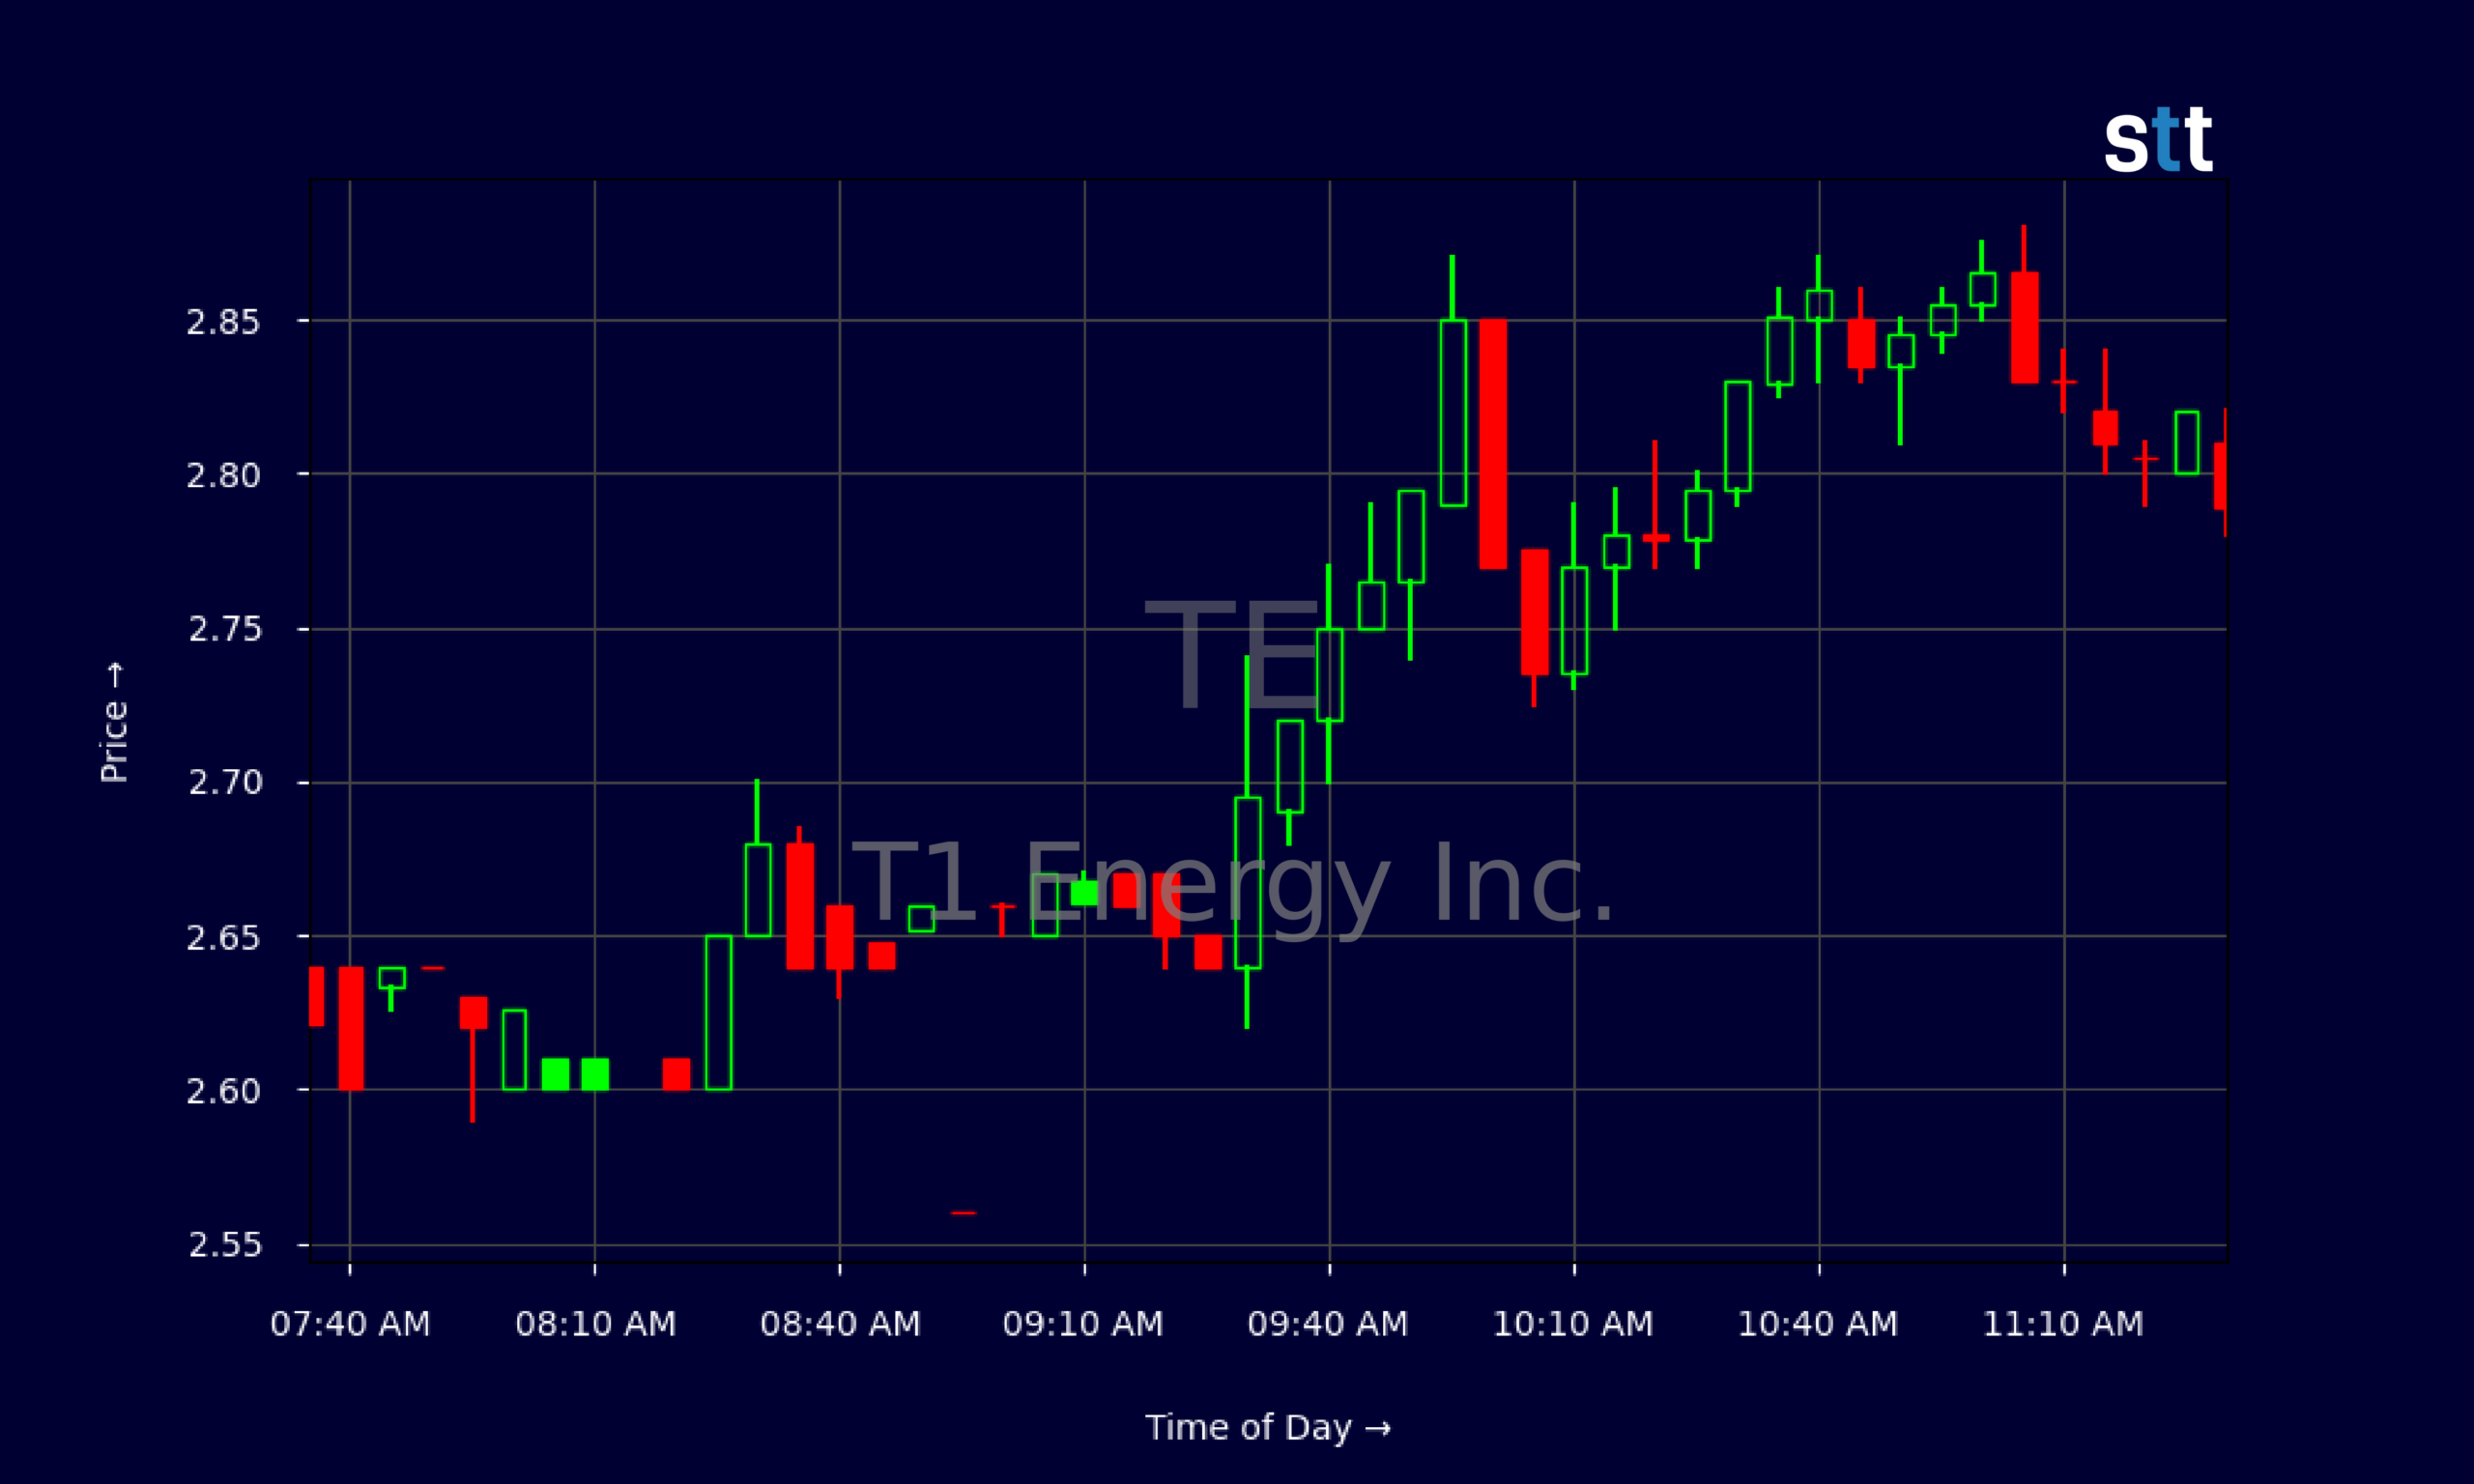
Live Update At 11:32:31 EST: On Tuesday, November 03, 2026 T1 Energy Inc. stock [NYSE: TE] is trending up by 8.96%! Discover the key drivers behind this movement as well as our expert analysis in the detailed breakdown below.
Quick Financial Overview
TE, the ticker for T1 Energy Inc., is a classic battleground name right now. On the income side, TE is generating about $755.3M in revenue, but the company is deeply unprofitable. EBIT margin sits around -28.8%, and net profit margin is roughly -39.6%. That means for every $1 in sales, T1 Energy Inc. is losing close to $0.40. For short-term trading, that kind of pain can still support big moves, but it is not a sign of a stable business.
On the balance sheet, TE carries heavy leverage. Total debt-to-equity is about 2.83, with long-term debt near $500.4M and total liabilities at roughly $1.37B. Equity is thin at around $275.3M. The current ratio of 1.3 shows TE can likely cover near-term bills, but the quick ratio of 0.3 means much of that support is tied up in inventory.
More Breaking News
- SK Hynix Slips 0% As NVIDIA Earnings Boost Fades
- STLA Stock Jumps As Earnings Beat Fuels Bullish Momentum
- AEHL Stock Pulls Back As Volatility Grips Low-Float Name
- RKT Stock Pops As Earnings Beat And Guidance Reset Collide
Cash flow is another red flag for traders who dig deep. In the latest quarter, T1 Energy Inc. generated negative operating cash flow of about -$30.1M and negative free cash flow of roughly -$131.2M, driven by significant capital spending. TE is plugging that gap mainly with new debt. For traders, this mix of high revenue, negative earnings, and heavy leverage sets up a volatile chart where momentum and sentiment can dominate the tape.
Why Traders Are Watching TE’s Price Action
TE’s chart is doing something most traders recognize instantly: a sharp drop, a hard bounce, and now a fight over direction. In early October, TE traded up near $3.49 and closed around $3.39. From there, T1 Energy Inc. slid steadily, with closes falling to $2.12 on 2026/10/26, a big reset from prior highs. That’s roughly a 37% drawdown from the peak to the low in just a few weeks.
Since that low, TE has started to claw back. The recent daily closes show a grind higher: $2.46, then $2.63, $2.86, $2.70, $2.56, and most recently $2.79. That tells traders TE is trying to base above the $2.50 area after shaking out weak hands. Every time T1 Energy Inc. dips, it finds buyers a little higher than before, which often signals early accumulation.
The intraday 5‑minute chart backs this up. TE opened the regular session near $2.64, quickly tested higher toward $2.74, then pulled back—but those dips into the $2.70s kept getting scooped. By late morning, T1 Energy Inc. held in the $2.80 zone, with repeated pushes into the high $2.80s. The range is tight, but the bias is upward.
For active traders, that sets up a clear battleground: support in the mid-$2.70s and resistance near recent highs around $2.90–$3.00. If TE breaks back over $3 with volume, momentum traders will likely swarm. If it loses the $2.60–$2.70 shelf, late longs may rush for the exits. With T1 Energy Inc. posting weak fundamentals but strong liquidity in the tape, the stock is acting like a pure sentiment and technical play.
Conclusion
TE is not a “feel‑good” fundamental story right now. T1 Energy Inc. is burning cash, running heavy losses, and leaning on debt to keep the lights on. Return on equity is deeply negative, and margins are underwater across the board. Long-term fundamental traders might avoid that picture. But short-term traders see something different in TE.
They see a liquid small-cap with nearly $755.3M in annual revenue, a price in the $2s, and a chart that just bounced hard off multi-week lows. TE has shown it can move from the low $2s to the $3s in a matter of days. That kind of range is exactly what momentum and day traders look for. As Tim Bohen, lead trainer with StocksToTrade says, “There’s a pattern in everything; you just have to stick around long enough to see it.” For pattern-focused traders, TE’s recent behavior on the chart is exactly the kind of action that keeps them watching. The key is not falling in love with T1 Energy Inc., but respecting the volatility and the risk from leverage.
The plan for many in the Tim Sykes-style community is simple: treat TE as a trading vehicle, not a long-term comfort blanket. Map the levels, watch volume, and don’t ignore the debt and cash burn when sizing positions. As Tim Sykes likes to say, “The market doesn’t care about your opinion, only your discipline.” With T1 Energy Inc., discipline—tight risk, fast cuts, and clear profit targets—will matter more than any story. This analysis is for educational and research purposes only, and traders should always do their own homework before acting.
This is stock news, not investment advice. StocksToTrade News delivers real-time stock market updates tailored to highlight the key catalysts driving short-term price movements. Our coverage is designed for active traders and investors who thrive in fast-moving markets, with a focus on volatile sectors like penny stocks, AI stocks, Robinhood stocks and other momentum plays. From earnings reports and FDA approvals to mergers, new contracts, and unusual trading volume, we break down the events that can spark significant price action.
Looking to level up your trading game? Explore StocksToTrade, the ultimate platform for traders. With powerful tools designed for swing and day trading, integrated news scanning, and even social media monitoring, StocksToTrade keeps you one step ahead.
Check out our quick startup guide for new traders!
- How to Read Stock Charts: A Guide for Beginners
- Trading Plan: 6 Steps to Create One
- How To Create a Stock Watchlist
Ready to build your watchlists? Check out these curated lists:
Once your watchlist is set, take the next step and trade with confidence using StocksToTrade’s robust platform. Don’t miss out — grab your 14-day trial for just $7 and experience the edge you need to thrive in today’s fast-paced markets.