

T1 Energy Inc. stocks have been trading up by 9.13 percent after securing a transformative long-term LNG supply agreement.
Key Takeaways
- TE has bounced from a recent low near $2.08 back to the $2.80s, signaling an aggressive short-term rebound on rising volume and volatility.
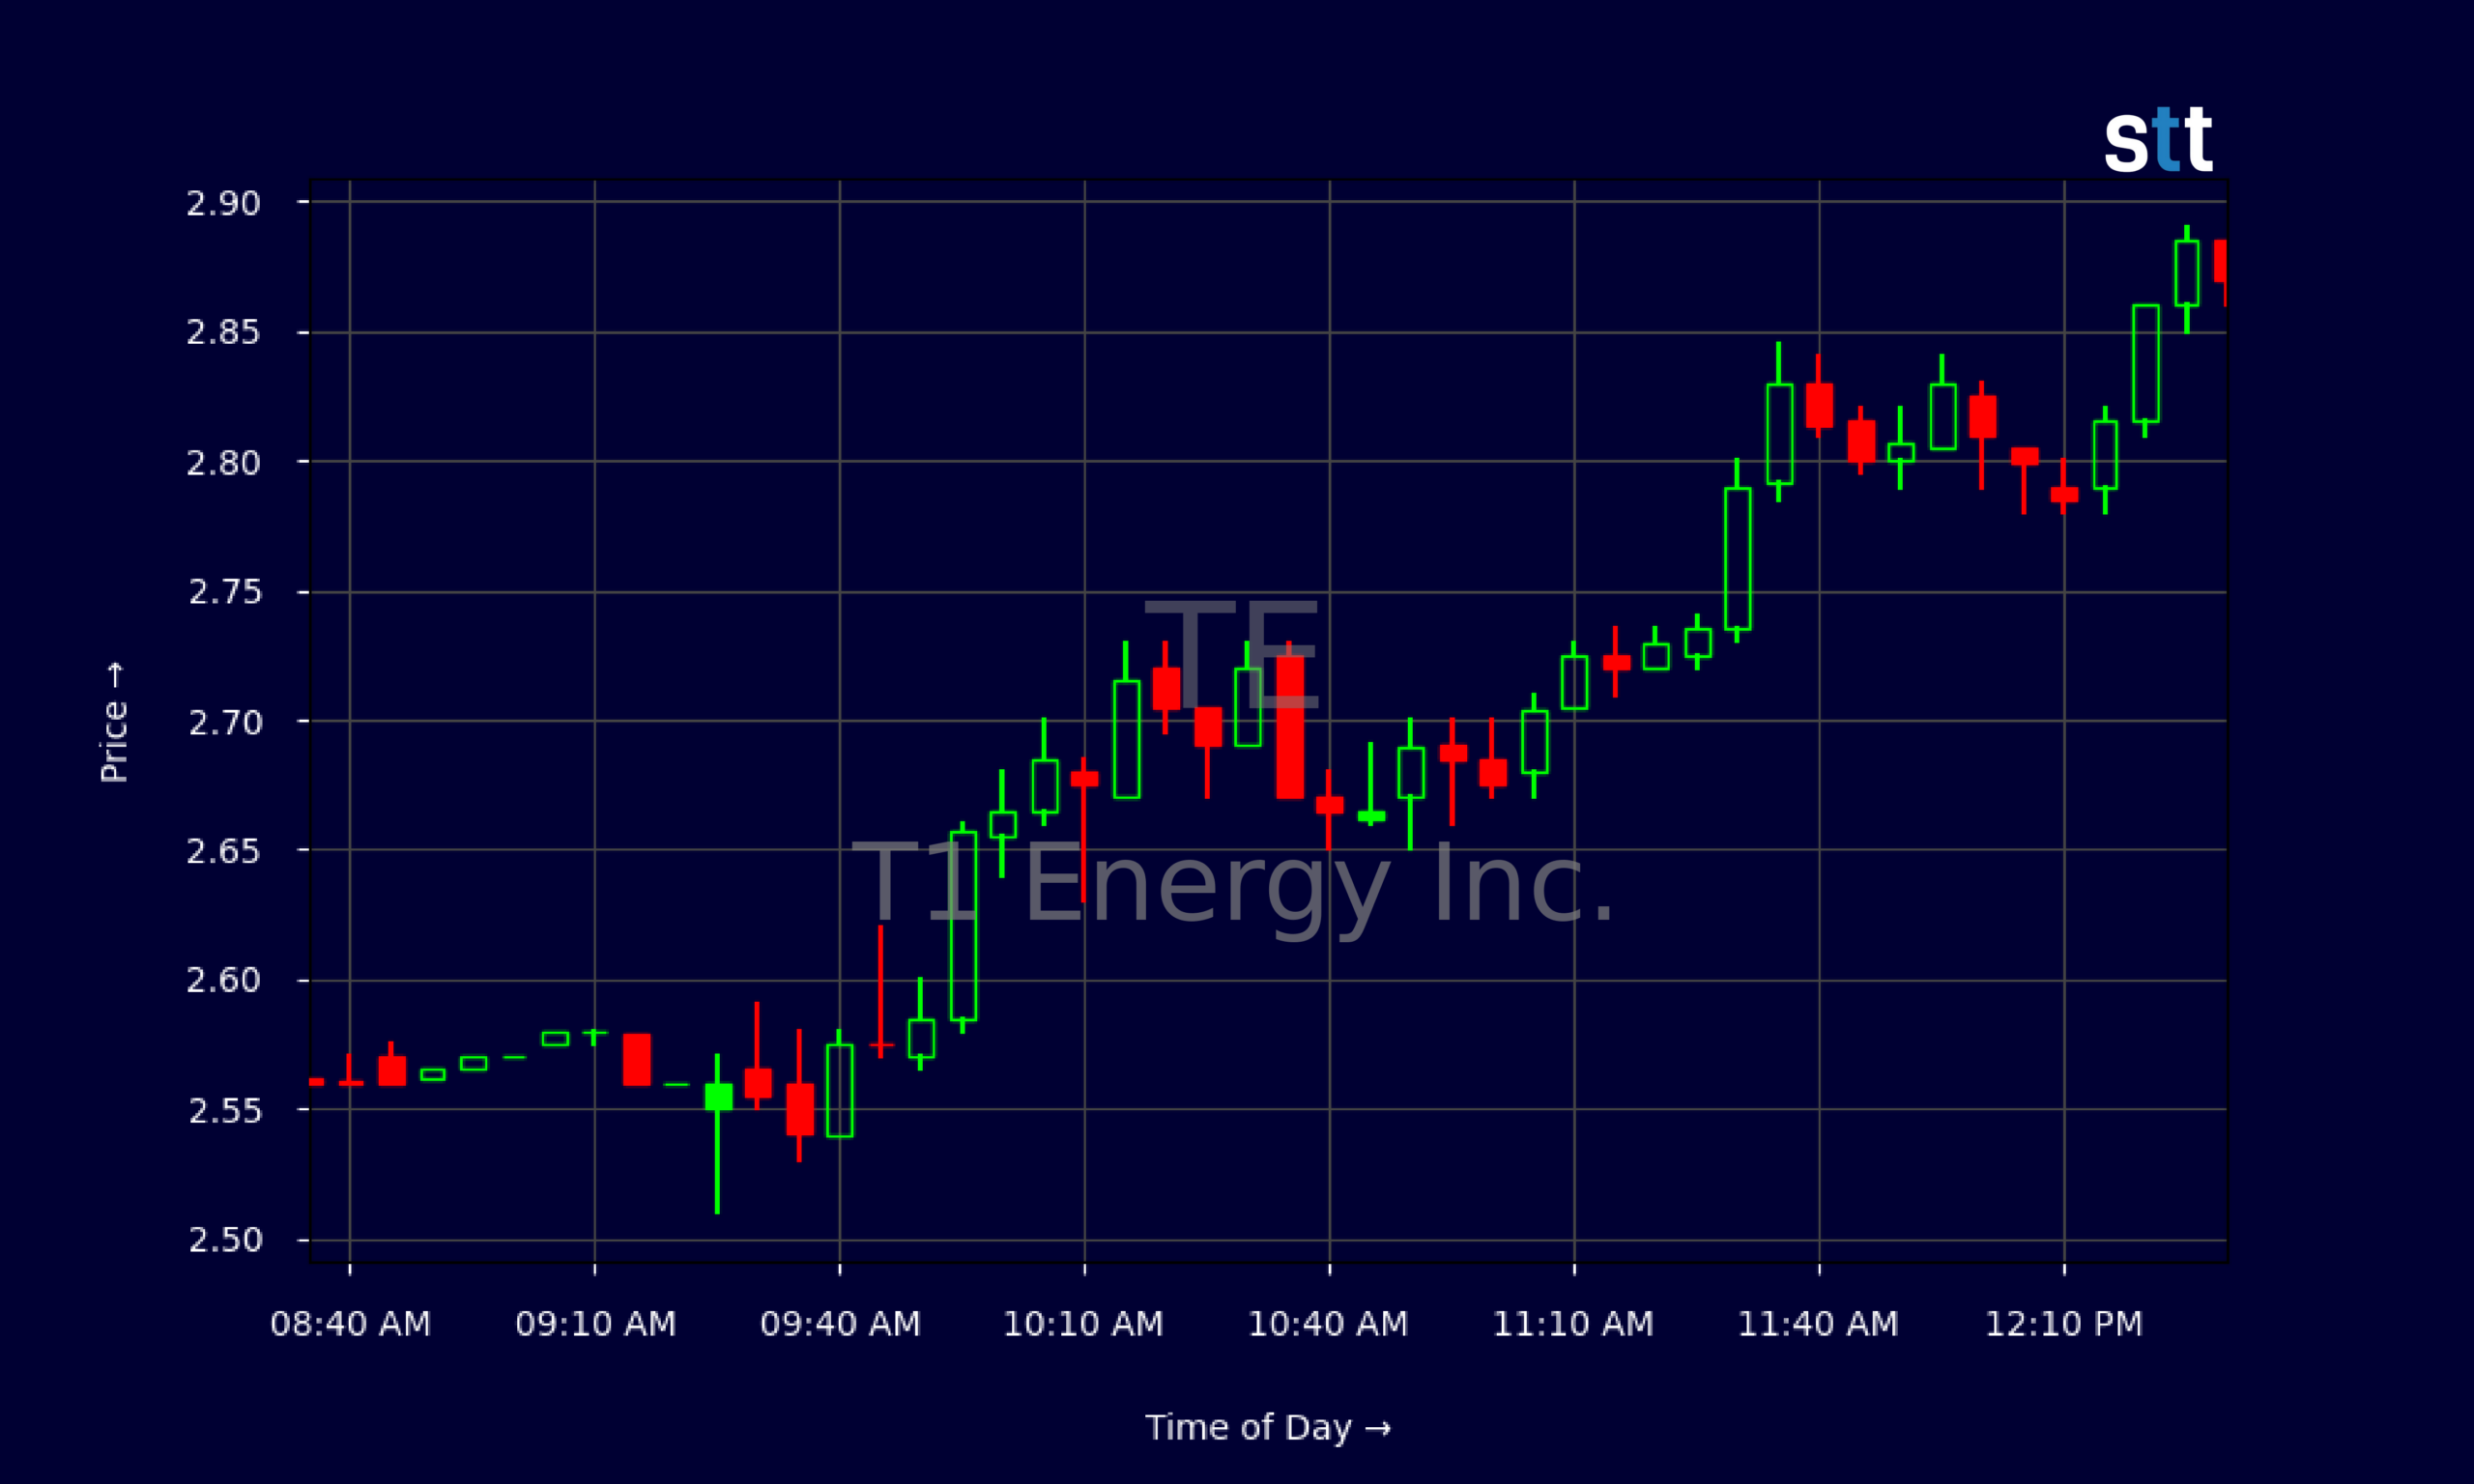
- The intraday chart shows T1 Energy Inc. grinding higher all morning, with higher lows and tight consolidation above $2.80, a classic momentum pattern.
- Despite the move, TE remains a money-losing business with negative margins and heavy leverage, keeping it firmly in high‑risk day‑trading territory.
- T1 Energy Inc. generated about $755.3M in revenue over the last year, but free cash flow is deeply negative, so dilution or more debt remain real possibilities.
Live Update At 12:32:25 EDT: On Thursday, October 29, 2026 T1 Energy Inc. stock [NYSE: TE] is trending up by 9.13%! Discover the key drivers behind this movement as well as our expert analysis in the detailed breakdown below.
Quick Financial Overview
TE is a classic high‑beta small-cap story stock: big revenue, bigger losses. T1 Energy Inc. booked roughly $755.3M in revenue over the trailing year, yet profit margins are ugly. The latest quarterly income statement shows a net loss of about $43.5M and an operating loss near $22.8M. That lines up with the key ratios: EBIT margin around -28.8% and profit margin near -40%. TE is selling a lot, but it’s not keeping much.
More Breaking News
- AUR Stock Pulls Back As Traders Weigh Cash Burn And Range
- Life Time Group Holdings Falls 2% Ahead of Earnings
- CoreWeave Stock Slides As Debt Fears Trump AI Hype
- SoFi Technologies Stock Rockets After Earnings Beat And Bold 2027 Targets
For traders, that kind of profile usually means one thing: volatility. T1 Energy Inc. runs with a high debt load — total debt to equity sits near 2.8, and leverage ratio is around 6. The balance sheet lists about $79.1M in cash versus more than $500M in long‑term debt and sizable lease obligations. TE does have working capital of roughly $173.7M, which gives T1 Energy Inc. breathing room, but cash burn is heavy. Free cash flow last quarter was about -$131.2M, driven by big capital spending. This mix of growth, losses, and leverage keeps TE firmly in the “trade it, don’t marry it” bucket.
Why Traders Are Watching TE’s Momentum
Price action is where TE gets interesting. After topping out above $3.90 earlier in the month, T1 Energy Inc. faded hard into the low $2s. The recent low around $2.08 on 2026/10/26 looked like a capitulation area, followed by three straight green closes: $2.46, $2.63, and now $2.87. That’s a sharp rebound of roughly 38% off the low in just a few sessions. For momentum traders, those are the runs that matter.
The daily chart on TE shows a compressed downtrend from the mid‑$3s into the low $2s, then a snapback. T1 Energy Inc. is now pushing back toward prior resistance from the $2.90–$3.00 zone set earlier in the month. If TE can hold above $2.60 and build a base, short‑term traders may lean long for a breakout retest of $3.00–$3.20. If it fails, a quick flush back toward $2.40 or even $2.20 is on the table.
Intraday, the 5‑minute chart of T1 Energy Inc. on the latest session tells an even clearer story. TE opened near $2.56 and slowly stair‑stepped higher all morning, with shallow pullbacks and higher lows from $2.67 to $2.73 to $2.79. Midday, TE tightened in a narrow range around $2.82–$2.89, a classic consolidation after a trend move. That kind of grind is the exact pattern many day traders hunt: clear trend, controlled dips, and a defined risk level just below the prior higher low. When you match that with TE’s known volatility and weak fundamentals, you get a ticker tailor‑made for short‑term trading, not long‑term holding.
Conclusion
TE is a textbook example of a broken‑fundamental, strong‑chart setup that the Sykes community loves to study. T1 Energy Inc. brings in serious revenue but bleeds cash, posts negative returns on equity, and leans heavily on debt and leases to fund operations. Those numbers warn position traders to stay cautious. At the same time, that very weakness fuels big percentage swings whenever sentiment shifts. You’re seeing that right now in TE’s rebound from the low $2s back toward the high $2s.
For active traders, the key is to respect the levels. On the upside, watch how T1 Energy Inc. behaves into the $2.90–$3.20 resistance band. On the downside, recent support around $2.40–$2.50 is your line in the sand. TE’s intraday structure — higher lows, tight consolidations, fast moves — rewards planning and punishes hope. As Tim Bohen, lead trainer with StocksToTrade says, “The best trades are the ones you can make without emotion. Plan it, then execute it as if it’s routine.” That mindset lines up perfectly with how you should approach TE — map out your entries, exits, and risk in advance, then follow the plan without getting caught up in the intraday noise.
As Tim Sykes likes to remind traders, “Discipline beats conviction when you’re trading sketchy companies with big spikes.” TE fits that mold. Treat T1 Energy Inc. as a trading vehicle, not a promise. Study the chart, know your risk, and be ready to cut losses fast if the pattern breaks. This analysis is for educational and research purposes only and is not advice or a recommendation to trade.
This is stock news, not investment advice. StocksToTrade News delivers real-time stock market updates tailored to highlight the key catalysts driving short-term price movements. Our coverage is designed for active traders and investors who thrive in fast-moving markets, with a focus on volatile sectors like penny stocks, AI stocks, Robinhood stocks and other momentum plays. From earnings reports and FDA approvals to mergers, new contracts, and unusual trading volume, we break down the events that can spark significant price action.
Looking to level up your trading game? Explore StocksToTrade, the ultimate platform for traders. With powerful tools designed for swing and day trading, integrated news scanning, and even social media monitoring, StocksToTrade keeps you one step ahead.
Check out our quick startup guide for new traders!
- How to Read Stock Charts: A Guide for Beginners
- Trading Plan: 6 Steps to Create One
- How To Create a Stock Watchlist
Ready to build your watchlists? Check out these curated lists:
Once your watchlist is set, take the next step and trade with confidence using StocksToTrade’s robust platform. Don’t miss out — grab your 14-day trial for just $7 and experience the edge you need to thrive in today’s fast-paced markets.