

SUNation Energy Inc. stocks have been trading up by 28.71 percent amid bullish sentiment on accelerating residential solar adoption.
What Traders Need To Know
- Planned merger with Suniva would leave existing SUNation holders with only about 1.8% of the combined company, signaling extreme dilution risk.
- Deal terms are under review by Halper Sadeh LLC to assess whether SUNation shareholders are being fairly compensated.
- Legal scrutiny also targets whether the merger structure improperly blocks or discourages higher bids for SUNation Energy Inc.
- Ongoing investigation adds governance overhang that can weigh on SUNE’s price action and intraday volatility.
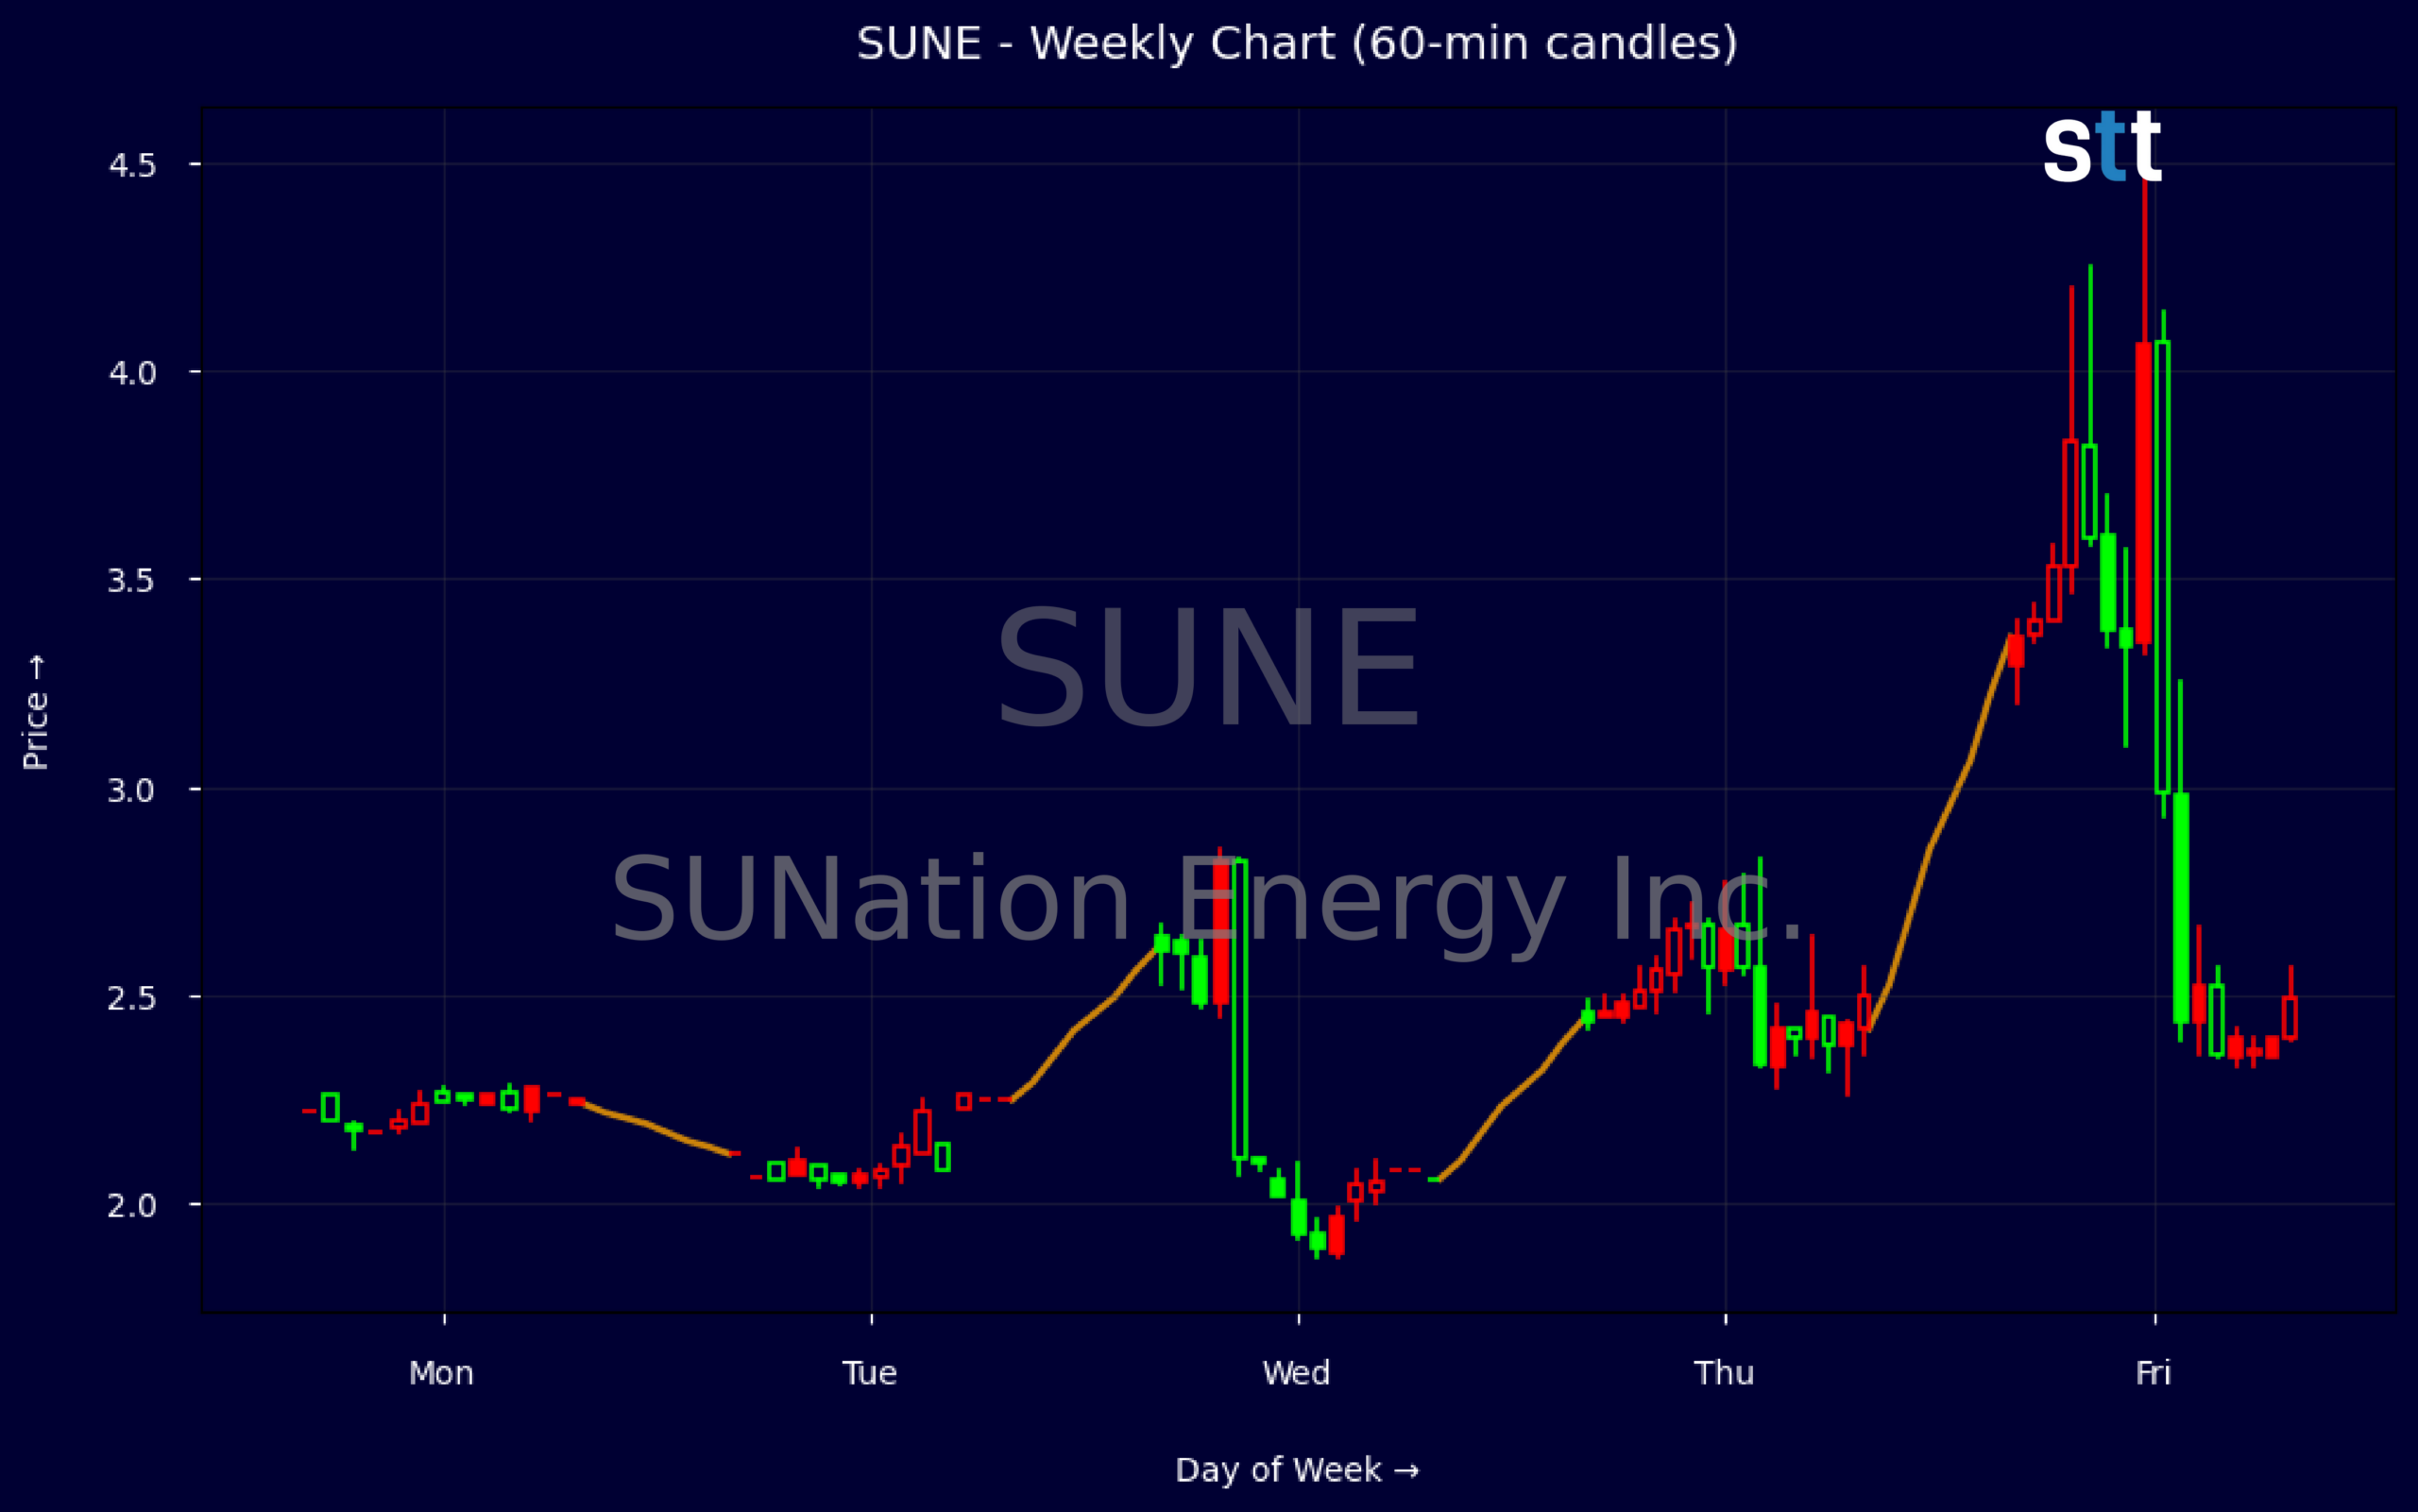
Weekly Update Jul 06 – Jul 10, 2026: On Saturday, July 11, 2026 SUNation Energy Inc. stock [NASDAQ: SUNE] is trending up by 28.71%! Discover the key drivers behind this movement as well as our expert analysis in the detailed breakdown below.
Energy industry expert:
Analyst sentiment – negative
SUNation Energy (SUNE) sits in a structurally weak position despite solid topline scale and growth, with trailing revenue of ~$72m and mid‑single‑digit multi‑year CAGRs. Margins are deeply negative (EBIT margin -16.3%, EBITDA margin -11.9%, net margin about -17%), and ROE below -100% signals a value‑destructive model. Liquidity is tight (current ratio 0.7, quick ratio 0.4) with only $1.7m cash versus negative Q1 operating cash flow of -$5.2m and free cash flow of -$5.2m, making continued dilution or leverage likely.
Technically, SUNE has shifted into a short‑term bullish momentum phase after a sharp expansion in range and likely volume on the move from ~$2.40 to an intraday high of $4.20, closing at $3.30. The dominant trend on the weekly tape is up, with a clear breakout above the prior $2.60–2.70 congestion zone. The key actionable trading level is $2.60 support; sustained closes above this level favor continuation toward $4.00–4.25, while a decisive break back below $2.60 would invalidate the breakout.
More Breaking News
- NVDA Stock Rebounds As Traders Weigh Trump Share Sale
- MEOH Stock Jumps As Earnings Beat Fuels Buyback Momentum
- HL Stock Pulls Back As Traders Reset Silver Expectations
- CareDx CDNA Rips Higher After Big Earnings Beat And Guidance Hike
The proposed merger with Suniva is highly dilutive, leaving existing SUNation holders with only ~1.8% of the combined entity and already drawing shareholder‑rights scrutiny, underscoring weak bargaining power and governance risk. Versus Energy and Renewable Energy Producers benchmarks, SUNE materially underperforms on profitability, capital efficiency, and balance‑sheet strength. Outlook is negative: I see limited equity value creation and elevated downside risk. Tactical traders can trade the $2.60 level, but investors should avoid or exit.
Quick Financial Overview
SUNation Energy Inc. sits in a tough financial spot even before the Suniva deal. Recent quarterly revenue of about $7.2M produces a solid gross margin near 37%, but operating losses are steep, with an operating income near -$4.3M and net loss around -$4.1M. Key profitability ratios are deeply negative, with return on equity worse than -100%, showing that current operations are destroying shareholder value rather than building it.
The balance sheet shows total assets around $40.1M, but a large portion is tied up in goodwill and intangibles, over $26.8M combined. Cash is thin near $1.7M, while current liabilities exceed current assets, producing negative working capital of roughly -$3.5M and a current ratio of 0.7. That signals liquidity stress and helps explain why a merger like this may be on the table at unfavorable terms for existing holders.
Cash flow trends confirm the strain. Operating cash flow is about -$5.2M for the quarter, and free cash flow is similarly negative, while debt issuance has been used to plug gaps. Against this weak backdrop, SUNE trades at a very low price‑to‑sales near 0.06 and price‑to‑book near 0.21, classic distressed territory. Technically, the weekly chart shows a surge from roughly $2.12 to a recent close around $3.30, with a spike week near $3.83–$4.20 after an intraday ramp from $2.55 to $4.50. That kind of high‑range reversal often reflects news‑driven speculative flows rather than stable accumulation.
Conclusion
This is stock news, not investment advice. StocksToTrade News delivers real-time stock market updates tailored to highlight the key catalysts driving short-term price movements. Our coverage is designed for active traders and investors who thrive in fast-moving markets, with a focus on volatile sectors like penny stocks, AI stocks, Robinhood stocks and other momentum plays. From earnings reports and FDA approvals to mergers, new contracts, and unusual trading volume, we break down the events that can spark significant price action.
Looking to level up your trading game? Explore StocksToTrade, the ultimate platform for traders. With powerful tools designed for swing and day trading, integrated news scanning, and even social media monitoring, StocksToTrade keeps you one step ahead.
Check out our quick startup guide for new traders!
- How to Read Stock Charts: A Guide for Beginners
- Trading Plan: 6 Steps to Create One
- How To Create a Stock Watchlist
Ready to build your watchlists? Check out these curated lists:
Once your watchlist is set, take the next step and trade with confidence using StocksToTrade’s robust platform. Don’t miss out — grab your 14-day trial for just $7 and experience the edge you need to thrive in today’s fast-paced markets.