

Strategy Inc stocks have been trading down by -6.55 percent amid investor concern over weaker-than-expected quarterly earnings guidance.
Key Takeaways
- Price action in MSTR is tightening, with daily closes clustering between $136 and $153 after a sharp move earlier in the month.
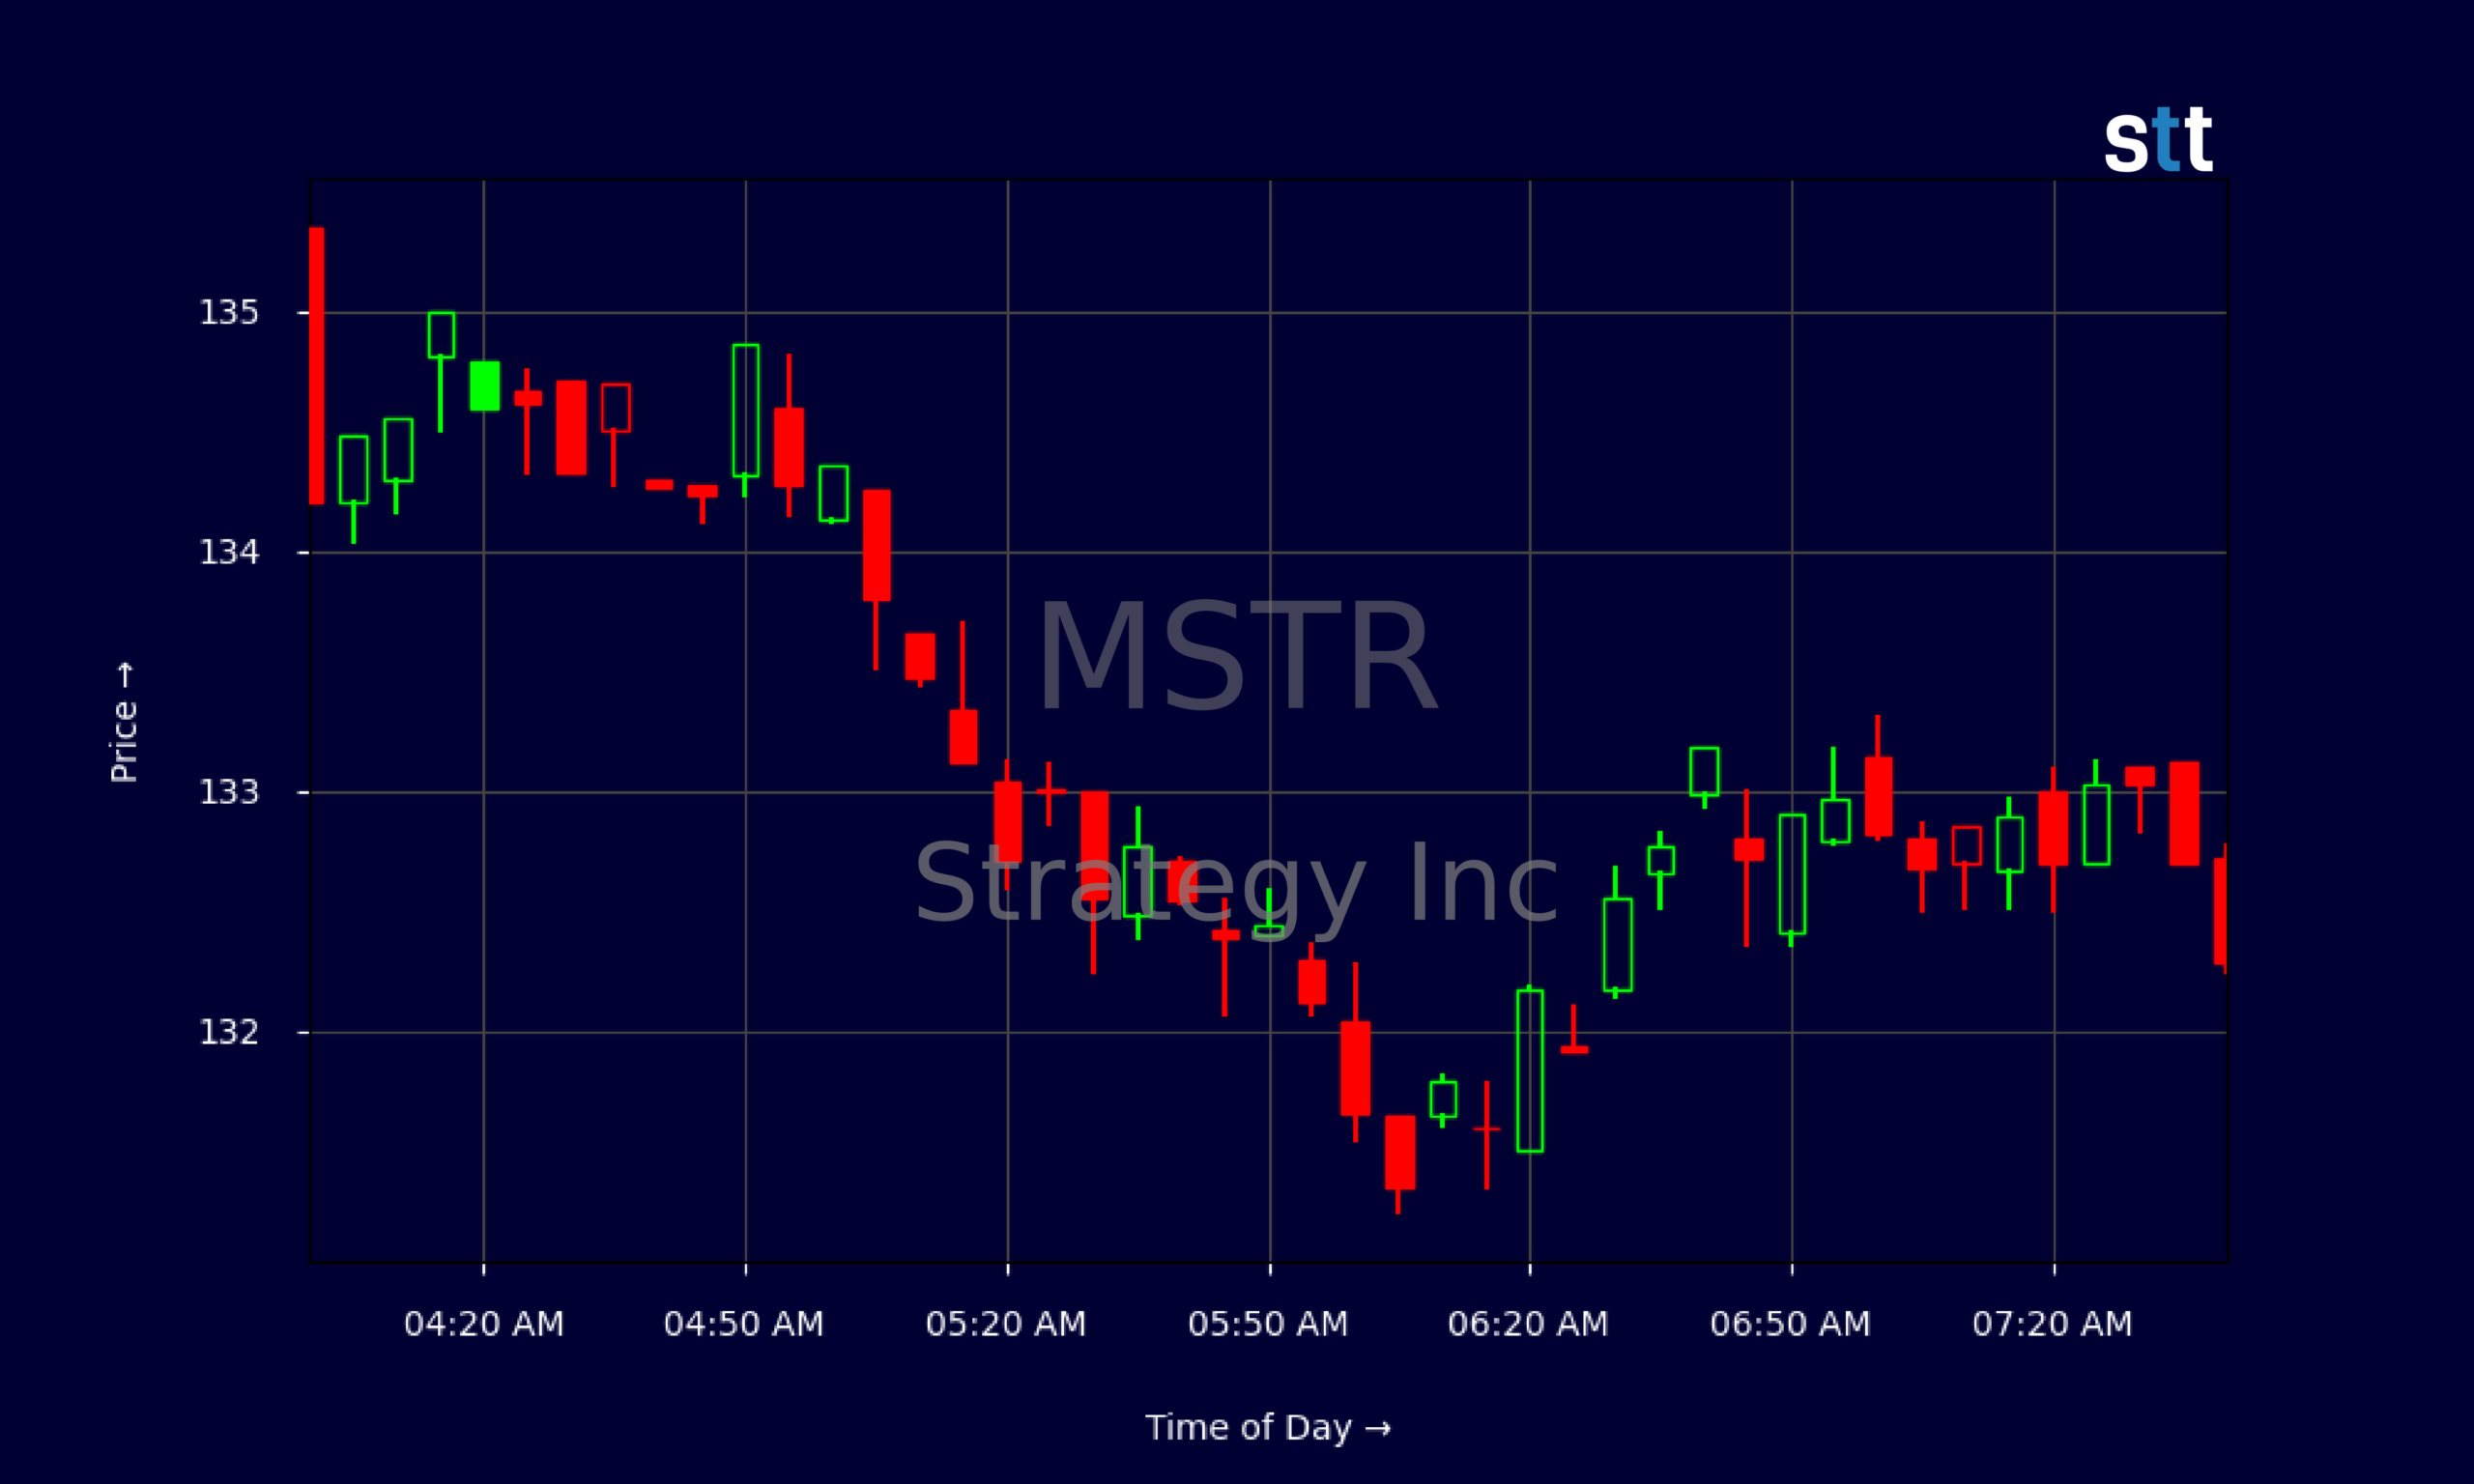
- Intraday MSTR trading shows heavy consolidation around $132–$135, signaling a key short‑term decision zone for active traders.
- Strategy Inc’s revenue base is small relative to its market value, with a sky‑high price‑to‑sales ratio near 130.
- The balance sheet for MSTR shows strong liquidity and moderate leverage, giving traders confidence the company can weather drawdowns.
- Massive accounting losses and negative returns on capital keep MSTR firmly in “story stock” territory rather than a classic value play.
Live Update At 07:46:56 EDT: On Friday, October 30, 2026 Strategy Inc stock [NASDAQ: MSTR] is trending down by -6.55%! Discover the key drivers behind this movement as well as our expert analysis in the detailed breakdown below.
Quick Financial Overview
Strategy Inc, traded as MSTR, is a classic high‑beta trading vehicle wrapped around a thin operating business. The company reported about $477.2M in revenue, yet its enterprise value is around $78.5B. That gap shows why traders treat MSTR more like a leveraged macro or thematic bet than a steady cash‑flow machine.
Revenue has actually been shrinking, down roughly 13% over three years and about 34% over five years. Despite a solid gross margin near 67.6%, the rest of the income statement is dominated by huge special items and accounting charges. Reported net income from continuing operations sits around -$8.2B, with EBITDA near -$8.19B. Those numbers make traditional valuation metrics like P/E meaningless for MSTR right now.
More Breaking News
- NVDA Stock Rebounds As Traders Weigh Trump Sale News
- Microsoft Stock Pops As Cloud And AI Guidance Smash Expectations
- SPCX Slides As Headline Risk And Competition Hammer Sentiment
- PATH Stock Slips As BofA Slashes UiPath Price Target
On the balance sheet, MSTR carries roughly $5.3B in equity value against about $7.2B in total liabilities. Liquidity is a bright spot: the current ratio of 5.4 and quick ratio of 5.2 show ample near‑term coverage. Total debt‑to‑equity of 0.22 and long‑term debt‑to‑capital of 0.18 mean Strategy Inc is leveraged, but not dangerously for a high‑volatility trading vehicle like MSTR.
Why Traders Are Watching MSTR’s Trading Range
For short‑term traders, MSTR’s chart is the real story. Over the past several sessions, Strategy Inc has swung between a high near $168 and a recent close around $141.62. That’s a sizable pullback, but not a collapse, and it leaves MSTR sitting in the middle of its recent range.
Look at the daily closes: $164.43, $164.55, then a series of lower closes into the $150s, $140s, and now low $140s. That step‑down pattern tells traders momentum has cooled, but buyers are still defending the $136–$139 area. Each dip toward that zone has bounced, suggesting a short‑term support shelf. If MSTR cracks under $136 on strong volume, momentum traders will likely press the downside. If it holds and reclaims $150, the long side becomes more attractive for range players.
Zoom into the intraday tape and you see even tighter action. Pre‑market and early trading in MSTR shows prints locked between about $132 and $135, with repeated rejections both above and below. That’s textbook consolidation. Volatility is compressing. When volatility compresses, it usually expands again — hard. Active traders in MSTR are watching for a break of this low‑$130s band as the trigger.
At the same time, the fundamentals reinforce why MSTR trades like a momentum vehicle rather than a slow grind value name. A price‑to‑sales ratio above 130, negative free cash flow near -$6.4B, and extremely negative returns on equity and assets keep longer‑term value‑focused capital on the sidelines. That leaves a cleaner battlefield for short‑term MSTR traders: less sticky “buy and hold” money, more fast hands.
In simple terms, MSTR remains a chart‑driven stock. Strategy Inc’s financials set the backdrop — high valuation, big accounting noise, decent balance sheet — but the next real edge comes from how price behaves around $132 intraday and $136–$153 on the daily chart.
Conclusion
For active traders, MSTR is exactly the type of name that rewards preparation and punishes laziness. Strategy Inc offers massive swings, unusual financials, and a market cap that far outweighs its current revenue stream. That mix turns MSTR into a sentiment gauge and trading vehicle, not a textbook fundamental story.
The numbers give important guardrails. Strong current and quick ratios suggest MSTR is not dealing with immediate liquidity stress. Moderate leverage means the balance sheet is not a ticking time bomb. But the huge negative earnings and sprawling special items show that traditional value metrics are not the driver here. Price action is. As Tim Bohen, lead trainer with StocksToTrade says, “A good trade setup checks all the boxes—volume, trend, catalyst. Don’t trade if you’re missing pieces of the puzzle.” For MSTR, that means waiting for the technicals, liquidity, and news flow to align instead of forcing trades in a choppy or incomplete setup.
Traders in MSTR should keep their eyes on three things: the $136 support region on the daily chart, the $150–$153 resistance band above, and the intraday pivot zone around $132–$135. Breaks of these levels often come with volume and offer cleaner risk‑reward setups.
As Tim Sykes loves to remind his students, “Patterns repeat, but you have to be ready — study the past, cut losses fast, and never fall in love with a stock.” That mindset fits MSTR perfectly. Treat Strategy Inc as a trading vehicle, respect the volatility, and let the chart — not your ego — tell you when you’re wrong.
This is stock news, not investment advice. StocksToTrade News delivers real-time stock market updates tailored to highlight the key catalysts driving short-term price movements. Our coverage is designed for active traders and investors who thrive in fast-moving markets, with a focus on volatile sectors like penny stocks, AI stocks, Robinhood stocks and other momentum plays. From earnings reports and FDA approvals to mergers, new contracts, and unusual trading volume, we break down the events that can spark significant price action.
Looking to level up your trading game? Explore StocksToTrade, the ultimate platform for traders. With powerful tools designed for swing and day trading, integrated news scanning, and even social media monitoring, StocksToTrade keeps you one step ahead.
Check out our quick startup guide for new traders!
- How to Read Stock Charts: A Guide for Beginners
- Trading Plan: 6 Steps to Create One
- How To Create a Stock Watchlist
Ready to build your watchlists? Check out these curated lists:
Once your watchlist is set, take the next step and trade with confidence using StocksToTrade’s robust platform. Don’t miss out — grab your 14-day trial for just $7 and experience the edge you need to thrive in today’s fast-paced markets.