
STAK Inc. surged as stocks have been trading up by 8.98 percent following highly positive market-impacting news.
Click Here for a Millionaire's POV on Trading STAK
SUBSCRIBE FOR ALERTSJOIN 50,000+ ACTIVE TRADERS
Key Takeaways
- STAK surged 65% in premarket trading after fiscal 2026 results, signaling strong approval of the fresh numbers or guidance from active market participants.
- A prior 53% intraday spike in STAK was followed by a 14% premarket drop, underscoring how quickly momentum can unwind.
- Recent daily and intraday charts show STAK swinging between $0.99 and $1.87, reflecting intense short-term trading focus.
- Balance sheet data suggests STAK is small, leveraged to working capital, and highly sensitive to shifts in sentiment.
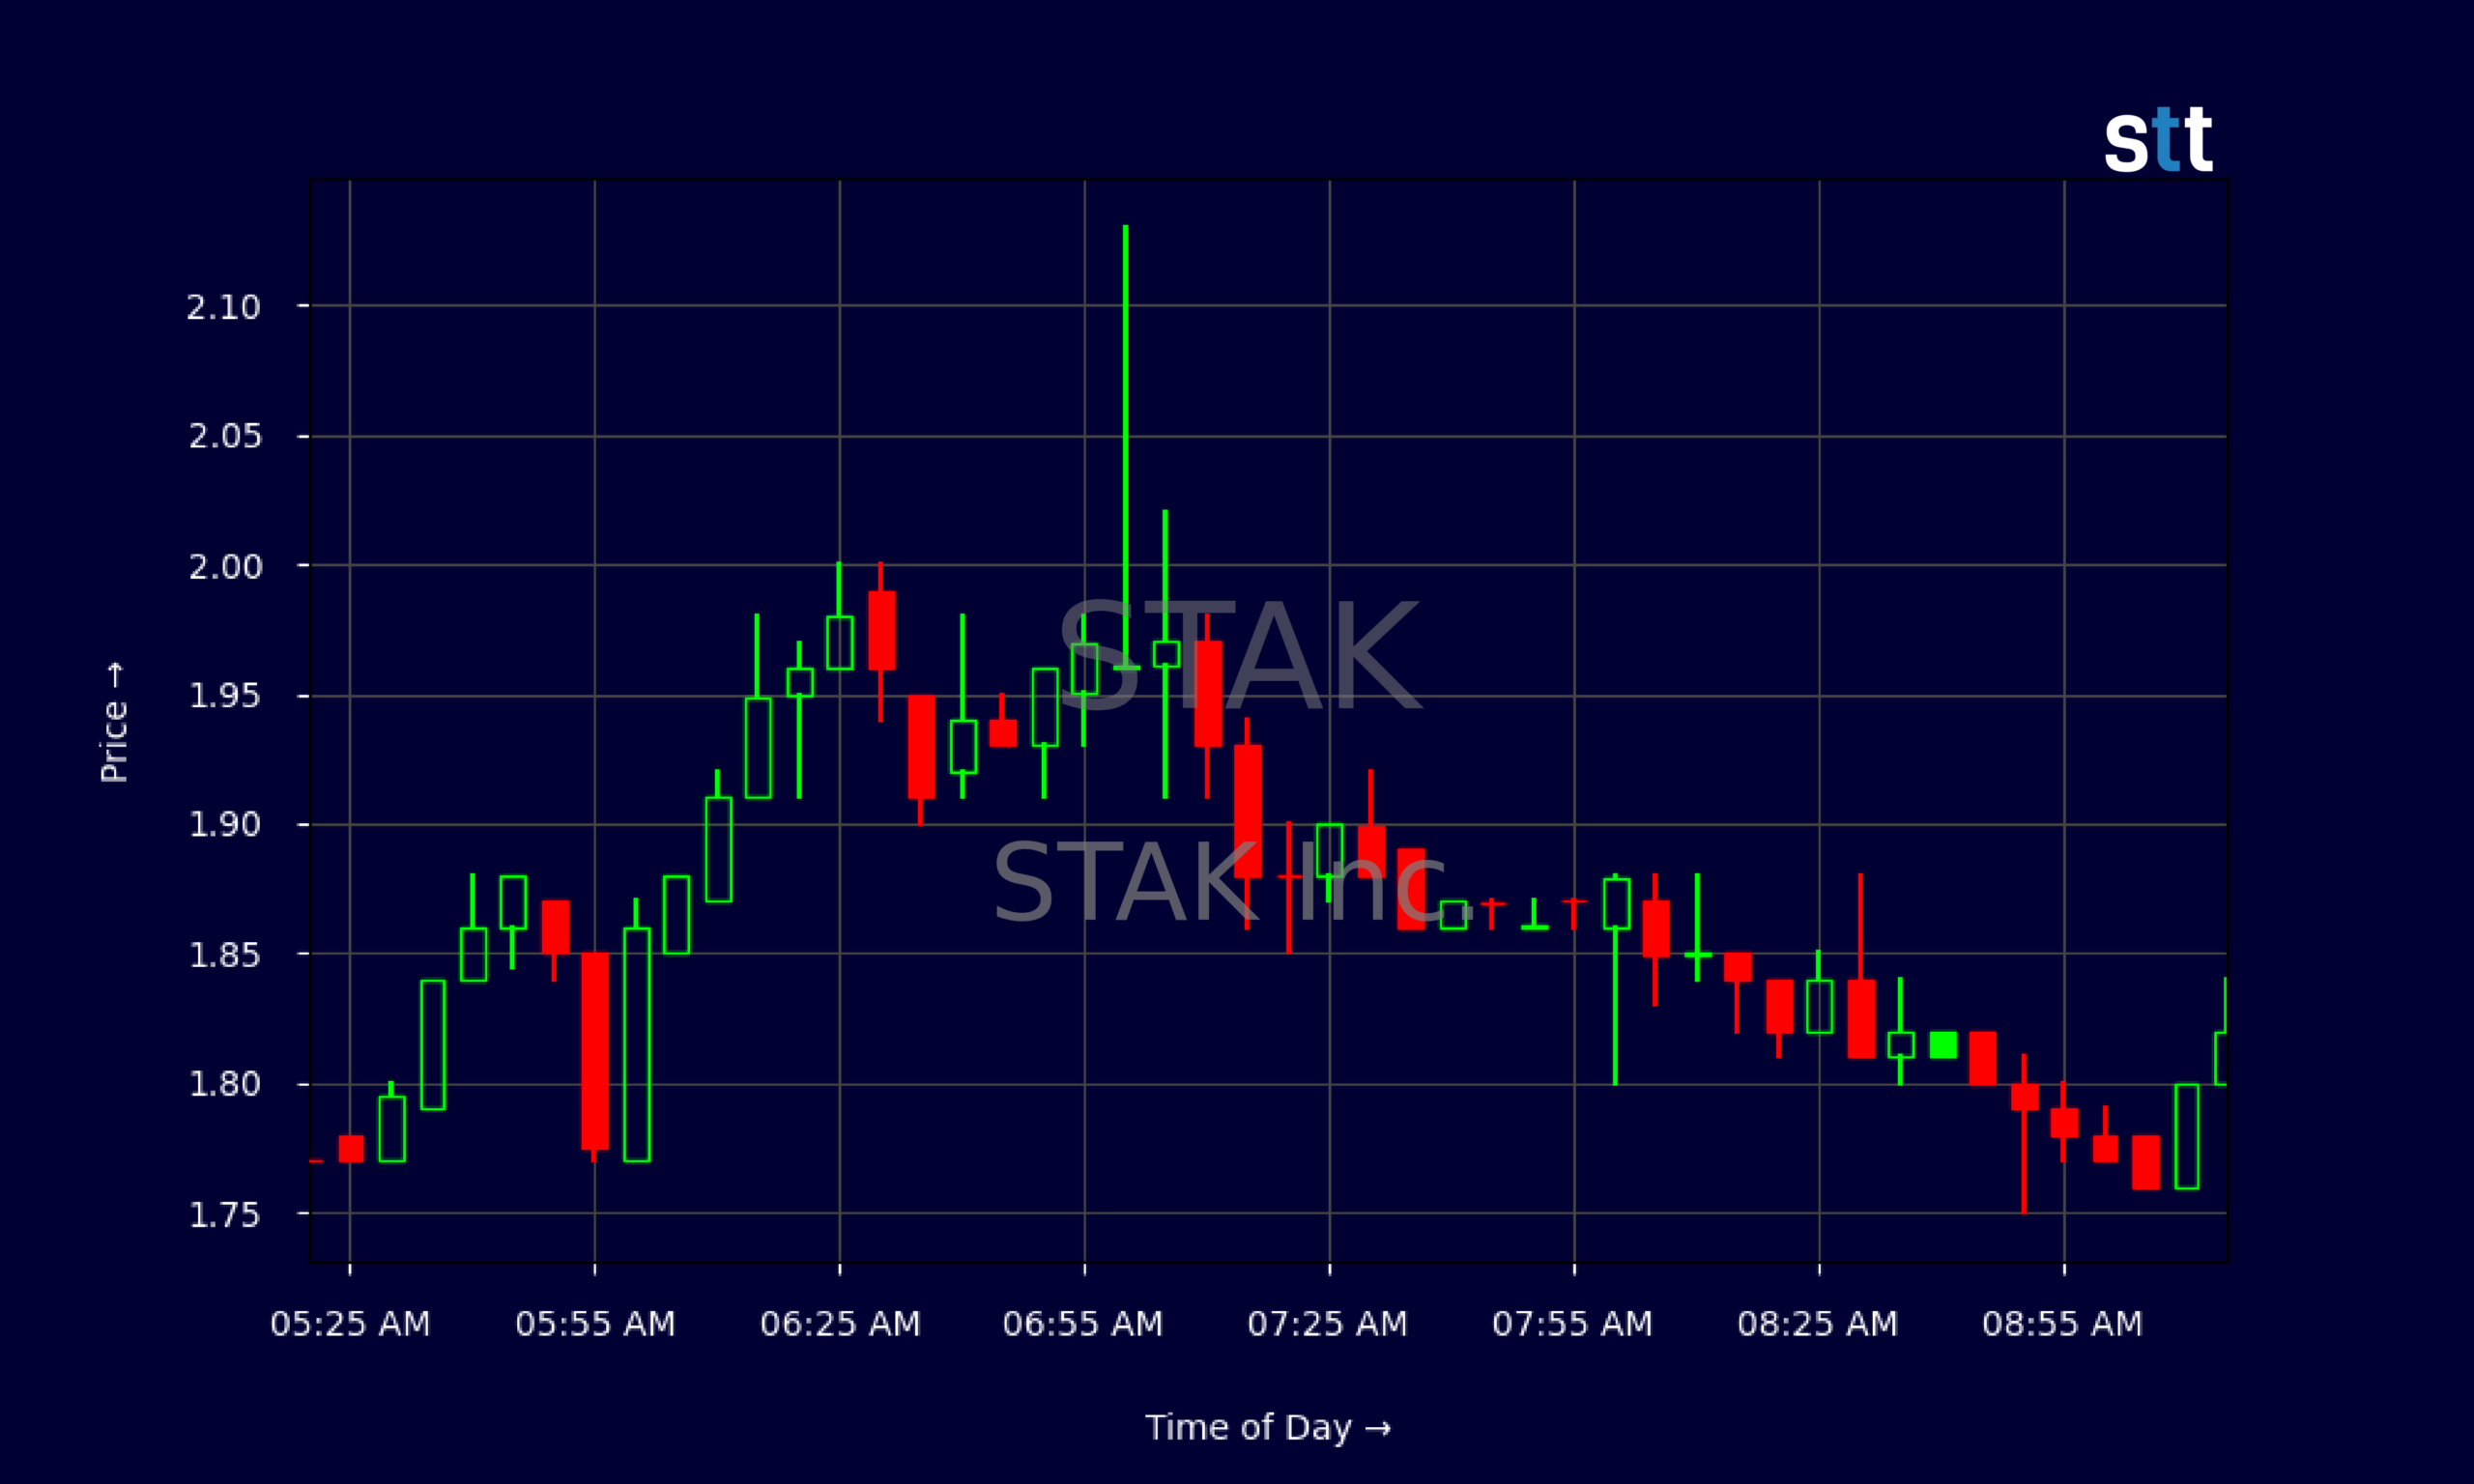
Live Update At 09:17:37 EDT: On Friday, October 23, 2026 STAK Inc. stock [NASDAQ: STAK] is trending up by 8.98%! Discover the key drivers behind this movement as well as our expert analysis in the detailed breakdown below.
Quick Financial Overview
STAK is trading like a classic low-priced momentum name, with fundamentals that matter, but price action clearly in the driver’s seat. Recent daily closes cluster mostly around the $1.00–$1.13 range, then stretch up to $1.67 on 2026/10/22 after that aggressive premarket run. For short-term traders, that is a textbook volatility expansion after news.
On the numbers side, STAK posted revenue of about $28.2M, translating to roughly $2.82 per share. With a price-to-sales ratio near 0.83, the market is not paying a rich multiple for those sales. Book value per share sits around $0.67, while the price-to-book multiple of 1.61 tells traders the market is willing to pay a premium over the company’s net assets, but not an extreme one.
More Breaking News
- Bloom Energy Stock Slides As Lawsuits And Guidance Hit Sentiment
- Biohaven (BHVN) Jumps As Ono Deal Fuels Non-Dilutive Cash
- NOK Stock Slides As European ADR Weakness Deepens
- Spotify Stock Jumps As AI Remix Push And Rogan Deal Collide
The balance sheet shows total assets of about $37.4M and equity of $16.1M, implying leverage but not a distressed setup. Current debt of roughly $11.4M and working capital of about $14.1M point to a business that must manage cash carefully. For STAK, that mix—tight fundamentals and low share price—creates fertile ground for big percentage swings when fresh news hits.
Why Traders Are Watching STAK’s Wild Price Swings
STAK has grabbed traders’ attention with a pattern that momentum players know well: violent moves clustered around catalysts. On 2026/10/22, STAK jumped 65% in premarket trading after releasing its fiscal 2026 financial results. That sort of gap is not random. It shows aggressive buying interest on the heels of data the market liked—whether that was top-line growth, improving guidance, or cleaner balance sheet trends.
Even without seeing every line of the earnings release, the price response in STAK tells the story. From a recent base near $1.00, premarket action pushed shares into the high $1.80s and low $1.90s, with the intraday tape showing repeated pushes toward $1.90–$2.13 before cooling. That is classic reactive trading: one group chases upside momentum, another group locks in fast profits, and the tug-of-war prints wide intraday ranges.
This is not happening in isolation. Back on 2026/09/25, STAK fell 14% in premarket trading right after a huge 53% surge the day before. That kind of boom-then-fade price action is a warning flag. STAK has become a “crowded day-trade” ticker where moves feed on themselves, both up and down.
For experienced traders, STAK presents opportunity and danger at the same time. The pattern of big gaps, followed by sharp reversals or consolidations, demands disciplined risk management. STAK’s fundamentals give the story a backbone, but it is the flow, liquidity, and crowd psychology around those fiscal 2026 results that drive the current setup.
Conclusion
STAK now sits in that rare zone where fundamentals, story, and pure momentum are colliding. The fiscal 2026 results lit the spark, and the 65% premarket surge showed how much speculative capital is watching STAK for any hint of good news. At the same time, the history of a 53% spike followed by a 14% premarket drop proves that STAK does not move in straight lines. It rips. It snaps back. It traps late chasers.
The balance sheet and valuation picture frame this as a small, leveraged but functioning company, not a shell. STAK has around $4.9M in cash, meaningful inventory, and a market valuation that is still modest versus revenue. That mix often fuels “prove it” rallies: each new report or guidance update becomes a binary-style catalyst that sends traders rushing in or out.
For active traders, the lesson is clear. Names like STAK reward preparation, not hope. As Tim Sykes likes to remind his students, “The market doesn’t owe you anything—come in with a plan, or the volatility will teach you one the hard way.” In the same spirit of disciplined trading, As Tim Bohen, lead trainer with StocksToTrade says, “If you’re still guessing at the end of your analysis, it’s probably not a trade worth taking.”. Use STAK as a case study in how explosive news-driven trading works, how quickly sentiment flips, and why cutting losses fast is not just a slogan but a survival rule. This coverage is for educational and research purposes only, and every trader still has to make their own decisions.
This is stock news, not investment advice. StocksToTrade News delivers real-time stock market updates tailored to highlight the key catalysts driving short-term price movements. Our coverage is designed for active traders and investors who thrive in fast-moving markets, with a focus on volatile sectors like penny stocks, AI stocks, Robinhood stocks and other momentum plays. From earnings reports and FDA approvals to mergers, new contracts, and unusual trading volume, we break down the events that can spark significant price action.
Looking to level up your trading game? Explore StocksToTrade, the ultimate platform for traders. With powerful tools designed for swing and day trading, integrated news scanning, and even social media monitoring, StocksToTrade keeps you one step ahead.
Check out our quick startup guide for new traders!
- How to Read Stock Charts: A Guide for Beginners
- Trading Plan: 6 Steps to Create One
- How To Create a Stock Watchlist
Ready to build your watchlists? Check out these curated lists:
Once your watchlist is set, take the next step and trade with confidence using StocksToTrade’s robust platform. Don’t miss out — grab your 14-day trial for just $7 and experience the edge you need to thrive in today’s fast-paced markets.