
STAK Inc. jumps as strong earnings and upbeat guidance spark renewed investor confidence; stocks have been trading up by 54.0 percent.
Click Here for a Millionaire's POV on Trading STAK
SUBSCRIBE FOR ALERTSJOIN 50,000+ ACTIVE TRADERS
Key Takeaways
- STAK fell 14% in premarket trading after a massive 53% surge in the prior session.
- The sharp premarket reversal in STAK signals a classic momentum whipsaw.
- Recent trading in STAK has featured huge percentage swings, highlighting elevated risk.
- Price action and liquidity in STAK point to aggressive short-term trading, not slow, steady accumulation.
Live Update At 08:33:38 EDT: On Thursday, October 22, 2026 STAK Inc. stock [NASDAQ: STAK] is trending up by 54.0%! Discover the key drivers behind this movement as well as our expert analysis in the detailed breakdown below.
Quick Financial Overview
STAK is trading like a low‑priced momentum name, but there is real business behind the ticker. The latest annualized revenue figure sits around $24.9M, with STAK showing a price‑to‑sales ratio near 0.83. For traders, that means the market is valuing the company at less than one times its sales, which is cheap on paper. Book value per share is roughly $0.67, and STAK trades modestly above that level, at about 1.6 times book.
The balance sheet shows total assets around $26.8M and equity of about $12.9M, giving STAK a leverageratio of 2.1 and only about $0.4M in long‑term debt. Current debt and borrowings of roughly $5.7M matter more for traders focused on near‑term liquidity, but working capital of about $10M gives STAK some breathing room.
More Breaking News
- MSTR Stock Rallies As MicroStrategy Expands Bitcoin And Buybacks
- SPCX Stock Rallies As Spectrum Deals And AI Push Draw Traders
- SPCX Stock Eyes Mobile Breakout As AI Spending Soars
- MARA Stock Grinds Lower As Analysts Stay Bullish On Miners
On the chart, the daily closes cluster around the $1.00–$1.15 range over recent weeks, showing a tight base before the recent explosion. STAK keeps bouncing between small green and red days, which often sets up bigger breakouts or breakdowns once volume spikes.
Why Traders Are Watching STAK Volatility
STAK has turned into a pure volatility play. The headline move is simple: a 53% surge in one session, followed by a 14% premarket slide. That kind of back‑to‑back action in STAK screams speculative trading and fast‑moving sentiment. Momentum traders see those numbers and immediately think one thing: opportunity and danger, side by side.
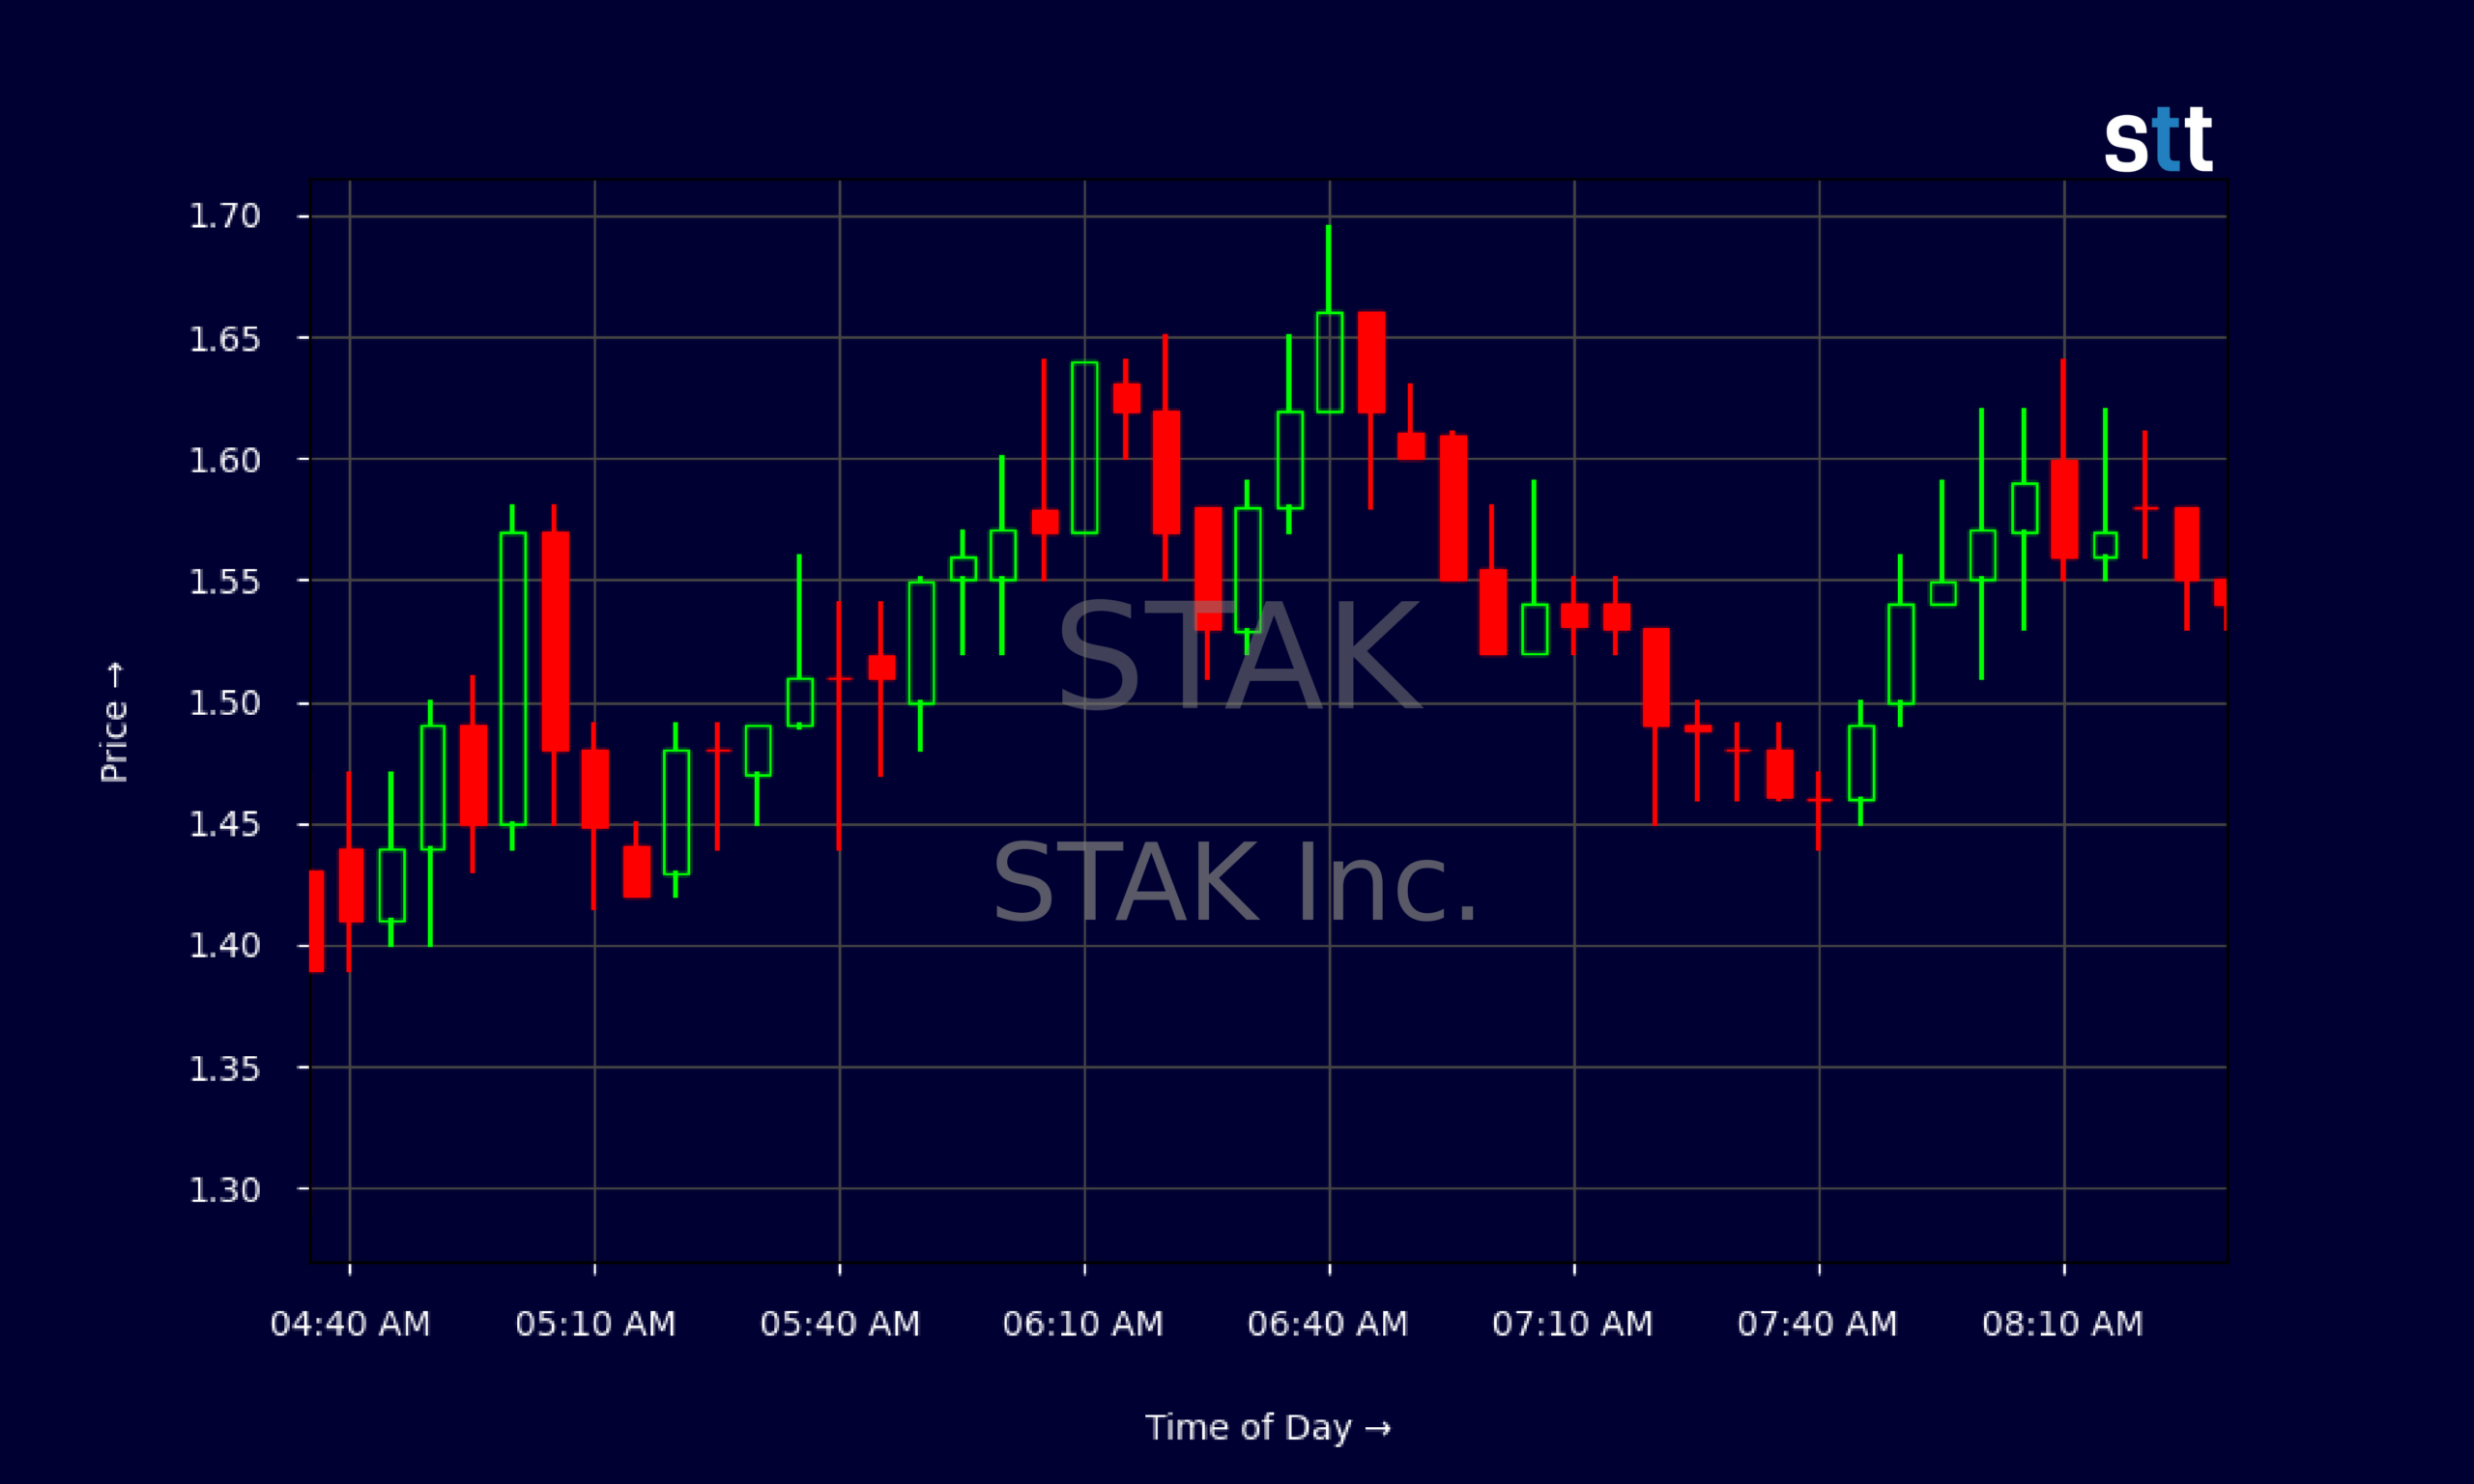
Look at how STAK trades intraday. In the premarket tape, the stock swings from $1.29 at the early 04:20 prints up toward the $1.64 area by around 06:10, before chopping between $1.50 and $1.60 into the 08:00 hour. That’s a wide range for a $1‑area stock. STAK offers multiple 5–10% flips inside a single premarket window. For nimble traders, that is a playground. For those who chase without a plan, it is a trap.
The recent daily chart shows STAK moving between roughly $0.99 and $1.26 over several sessions, then coiling around $1.00–$1.10. When you combine a low float‑style price zone, a sub‑$2 chart, and real but modest fundamentals, you often get the same pattern: quiet consolidation, followed by a surge when volume floods in. STAK fits that script.
The 14% premarket drop after a 53% rip tells traders that STAK is not a one‑way trend. It is a battleground. Short‑term longs lock in gains. Late buyers get squeezed. Shorts jump in on the fade. STAK becomes a tug of war where the only constant is volatility.
Conclusion
For active traders, STAK is a textbook case of why price action matters more than headlines. The fundamentals show a small company with about $24.9M in revenue, modest leverage, and book value support near $0.67 per share. None of that explains a 53% spike followed by a 14% premarket slide on its own. That disconnect is where trading opportunity lives.
STAK’s intraday tape shows clean levels and wide ranges. Breaks over premarket highs around the mid‑$1.60s can turn into momentum legs. Fails at those same levels can unwind fast back toward $1.40 or lower. The recent daily closes near $1.00–$1.10 give a clear line in the sand; if STAK holds above that area, momentum traders will keep it on their screens.
The key is treating STAK as a trade, not a blind hold. Tight risk, clear entries, and quick exits. That’s the mindset this chart demands. As Tim Sykes likes to remind traders, “Cut losses quickly, because big losses usually start out as small ones.” In the same spirit, As Tim Bohen, lead trainer with StocksToTrade says, “I focus on momentum that’s visible right now. Speculation on future moves is outside my playbook.” With a name like STAK showing violent moves both ways, that rule is not optional — it is survival. This analysis is for educational and research purposes only, but the lessons from STAK’s recent action are very real for anyone stepping into volatile small caps.
This is stock news, not investment advice. StocksToTrade News delivers real-time stock market updates tailored to highlight the key catalysts driving short-term price movements. Our coverage is designed for active traders and investors who thrive in fast-moving markets, with a focus on volatile sectors like penny stocks, AI stocks, Robinhood stocks and other momentum plays. From earnings reports and FDA approvals to mergers, new contracts, and unusual trading volume, we break down the events that can spark significant price action.
Looking to level up your trading game? Explore StocksToTrade, the ultimate platform for traders. With powerful tools designed for swing and day trading, integrated news scanning, and even social media monitoring, StocksToTrade keeps you one step ahead.
Check out our quick startup guide for new traders!
- How to Read Stock Charts: A Guide for Beginners
- Trading Plan: 6 Steps to Create One
- How To Create a Stock Watchlist
Ready to build your watchlists? Check out these curated lists:
Once your watchlist is set, take the next step and trade with confidence using StocksToTrade’s robust platform. Don’t miss out — grab your 14-day trial for just $7 and experience the edge you need to thrive in today’s fast-paced markets.