

SS&C Technologies Holdings Inc. stocks have been trading up by 11.45 percent amid strong investor optimism and positive sentiment.
What Traders Need To Know
- Q2 results topped EPS and revenue estimates, with 7.6% organic growth, firm EBITDA, and margin expansion supporting the recent push into the mid-$70s.
- Full-year 2026 guidance was raised on both earnings and revenue, signaling management confidence and modest upside versus Street expectations.
- A deeper AI automation deal with Marsh reinforces SS&C Technologies Holdings Inc. as a core platform for regulated financial institutions.
- Allspring Global Investments expanded its use of SS&C platforms, underscoring sticky, recurring data and distribution revenue potential.
- Sell-side support remains constructive, with RBC lifting its price target to $92 and Jefferies maintaining a Buy rating despite trimming its target to $83.
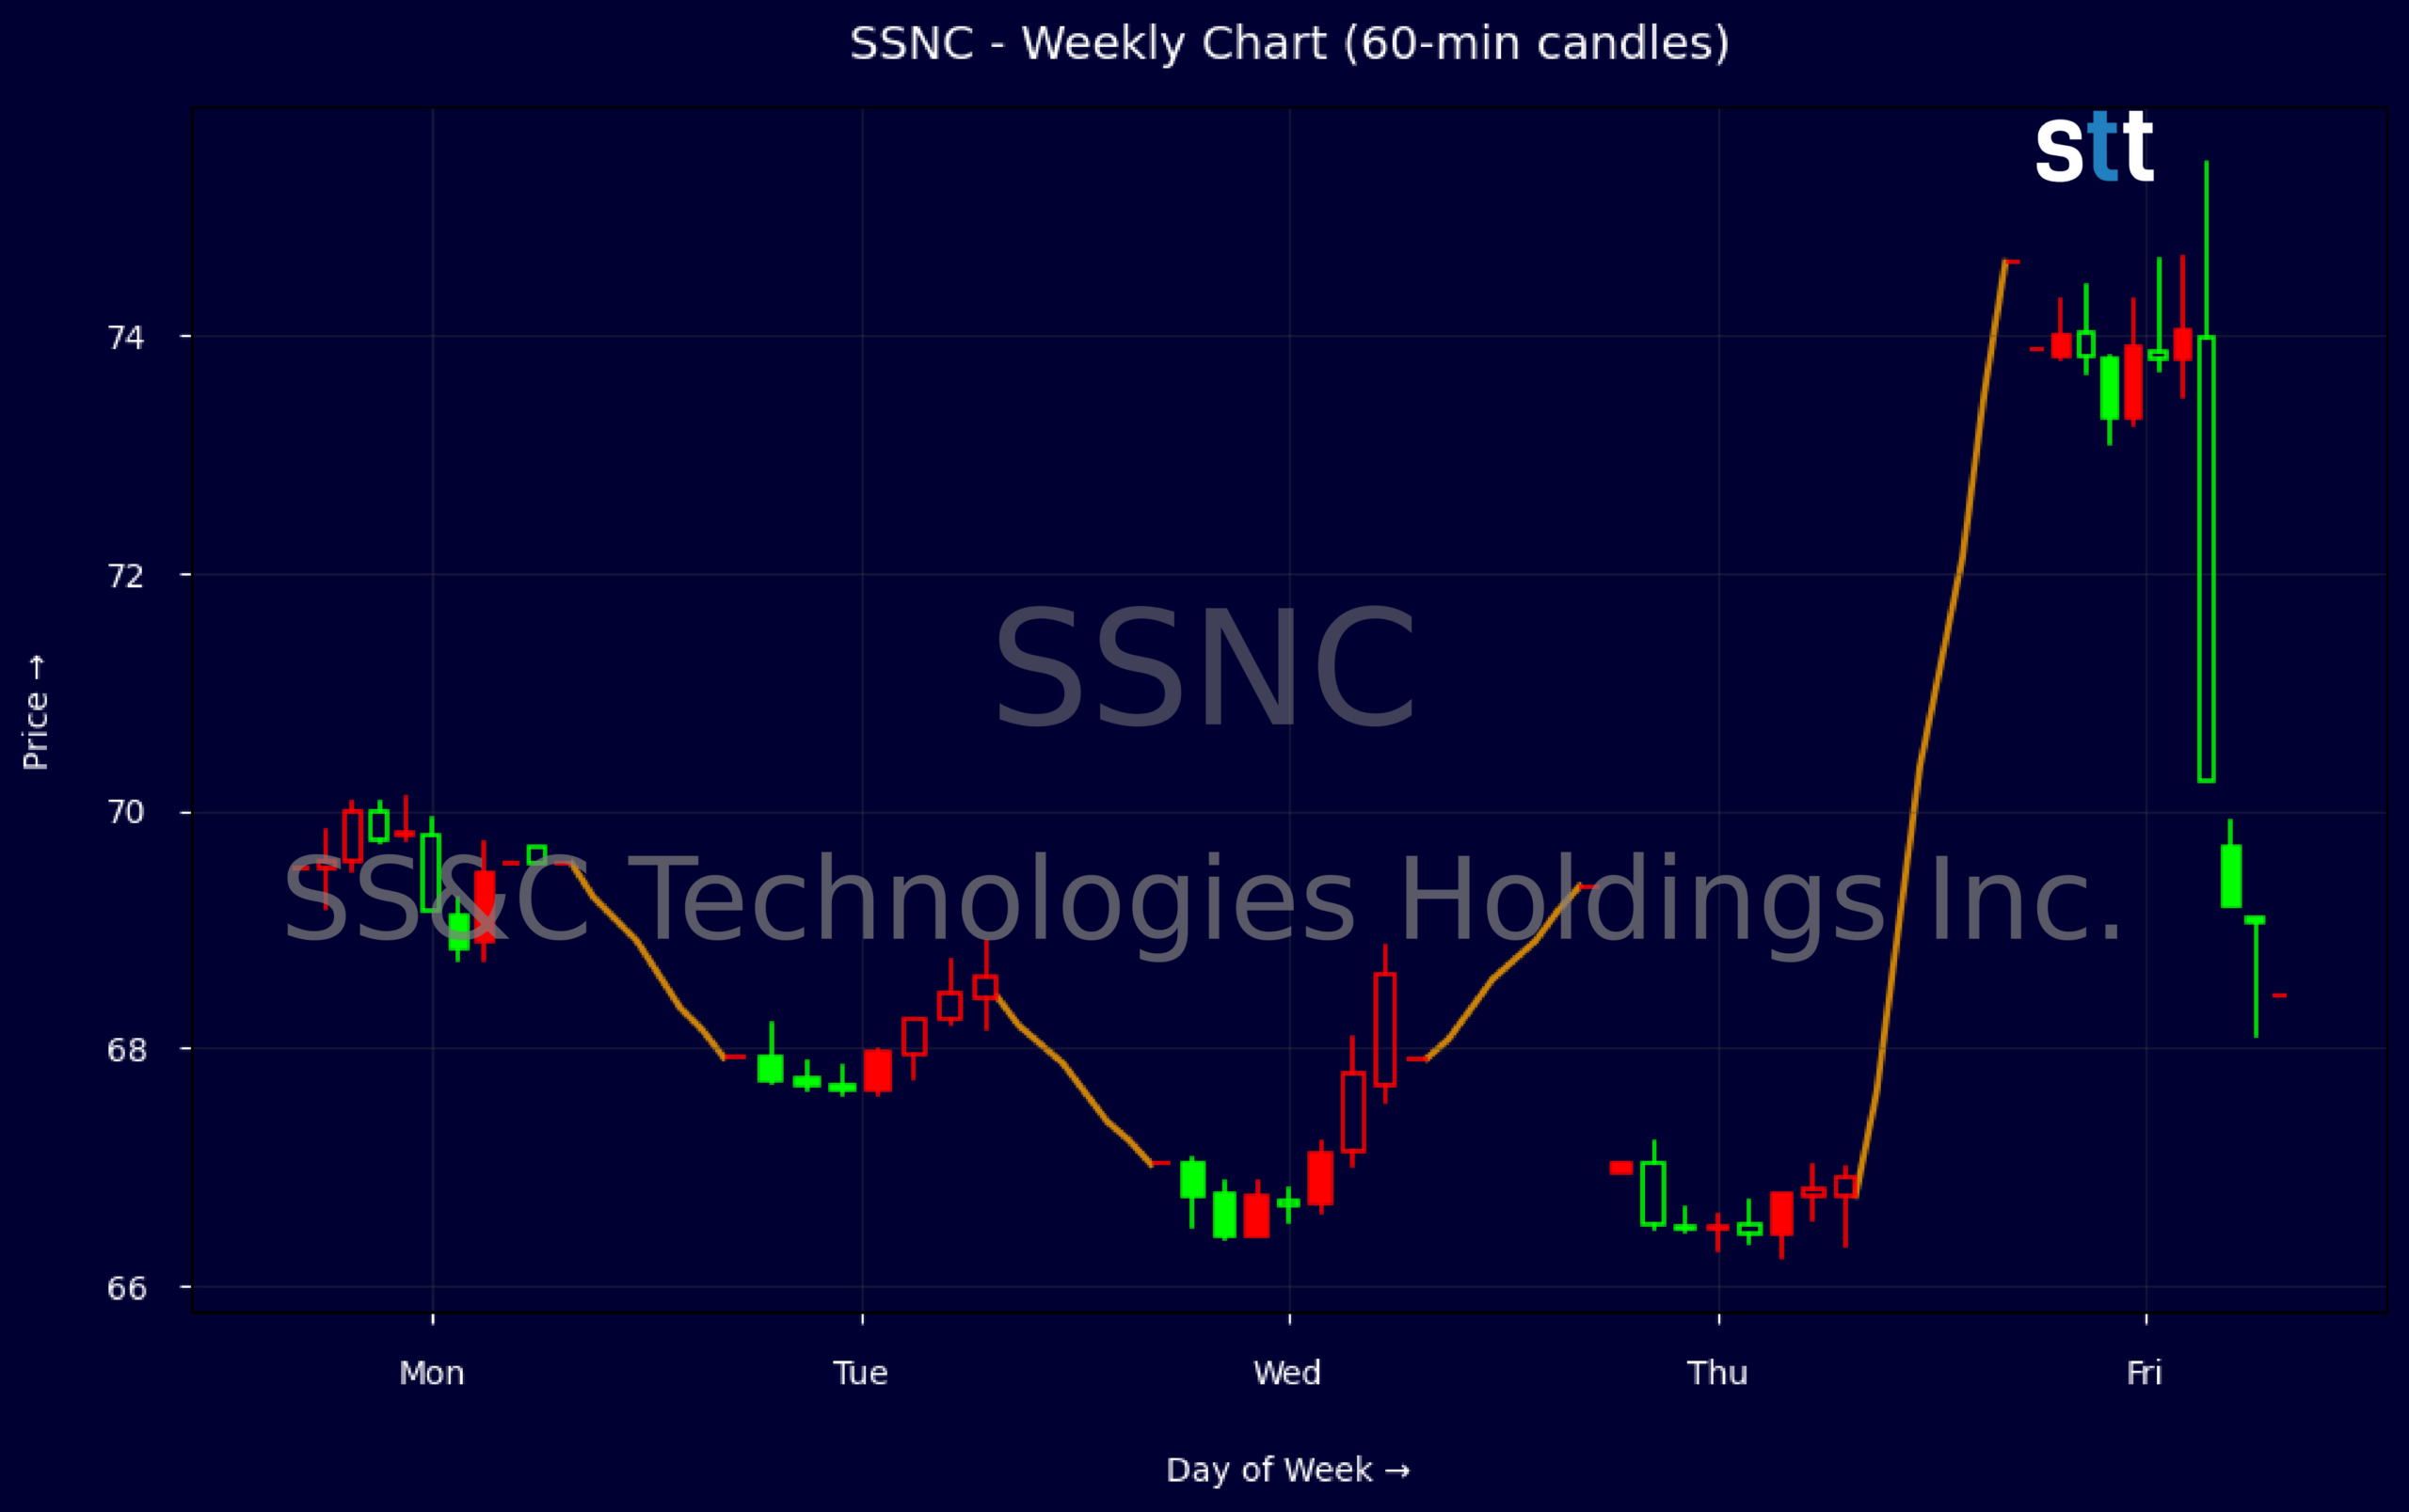
Weekly Update Jul 20 – Jul 24, 2026: On Saturday, July 25, 2026 SS&C Technologies Holdings Inc. stock [NASDAQ: SSNC] is trending up by 11.45%! Discover the key drivers behind this movement as well as our expert analysis in the detailed breakdown below.
Technology industry expert:
Analyst sentiment – positive
SS&C holds a solid, high-margin niche in financial services software and administration, with EBIT margin of ~23% and EBITDA margin of ~34%, ahead of many software peers. Revenue growth of 6–7% is steady, not hyper-growth, but supported by sticky, recurring financial clients. Valuation at ~21.5x EPS and 2.6x sales is reasonable given double‑digit ROE and strong FCF (P/FCF ~13x). Leverage is elevated (debt/equity 1.1x, interest coverage 5x) but comfortably serviceable from cash generation.
Technically, SSNC is in a clear near-term uptrend: the weekly sequence from ~$67 to $74.6 shows a sharp post-earnings breakout through prior resistance around $70, with buyers in control into the weekly close. Intraday 5‑minute action confirms strong follow‑through and elevated volume on up candles, typical of institutional accumulation. Actionable level: $70–71 now serves as primary support; tactical longs can buy pullbacks into that zone with a stop near $67 and upside focus on the low‑$80s.
More Breaking News
- NCPL Stock Holds Key Levels As Traders Study Volatile Chart
- SNDG ETF Slides As Volatility Tests Momentum Traders
- TNMG Stock Pulls Back As Traders Eye Debt And Support
- IOVA Stock Collapses As Traders Flee Biotech High‑Flier
Fundamentally and versus Technology and Software & IT Services benchmarks, SSNC offers above‑average profitability, below‑average volatility, and a shareholder‑friendly capital return profile, now reinforced by guidance and multiple sell‑side target raises. Recent wins with Marsh and Allspring, plus strong GlobeOp hedge fund metrics, validate the franchise and its AI/automation positioning. I see justified multiple expansion toward 17–18x 2027 EPS, supporting a 12‑month target of $88–92, with key resistance near $83 and strong support at $70.
Quick Financial Overview
SS&C Technologies Holdings Inc. delivered a clean Q2 beat, printing adjusted EPS of $1.76 against the $1.68 consensus and revenue of about $1.7B versus $1.66B expected. Organic growth of 7.6% and strong EBITDA point to a business that is not only growing but doing it with expanding margins. For traders, that mix often supports higher multiples, especially when the company is returning capital through buybacks and dividends.
Guidance backs up the print. SS&C Technologies Holdings Inc. raised its 2026 adjusted EPS view to $6.93–$7.25 and now sees revenue in the $6.672B–$6.832B band, both slightly ahead of current expectations. Q3 guidance is also set a touch above consensus on EPS and roughly in line on revenue, which signals steady—not aggressive—targets. With a trailing P/E near 21.5 and price-to-sales around 2.6, the stock trades at a moderate premium to its own earnings and cash flow quality.
On the chart, SSNC has broken out from the high-$60s to the mid-$70s. Weekly data show a move from roughly $67 to above $74, with the latest bar closing near the highs—typical of strong post-earnings momentum. Intraday, a session range from about $71 to $75 with a close near $73.88 shows initial profit-taking but buyers still in control. High profitability (EBITDA margin near 34%, gross margin around 48%) and solid returns on equity around 12% offset balance sheet leverage, where total debt to equity sits above 1.0 and interest coverage is about 5 times.
Conclusion
This is stock news, not investment advice. StocksToTrade News delivers real-time stock market updates tailored to highlight the key catalysts driving short-term price movements. Our coverage is designed for active traders and investors who thrive in fast-moving markets, with a focus on volatile sectors like penny stocks, AI stocks, Robinhood stocks and other momentum plays. From earnings reports and FDA approvals to mergers, new contracts, and unusual trading volume, we break down the events that can spark significant price action.
Looking to level up your trading game? Explore StocksToTrade, the ultimate platform for traders. With powerful tools designed for swing and day trading, integrated news scanning, and even social media monitoring, StocksToTrade keeps you one step ahead.
Check out our quick startup guide for new traders!
- How to Read Stock Charts: A Guide for Beginners
- Trading Plan: 6 Steps to Create One
- How To Create a Stock Watchlist
Ready to build your watchlists? Check out these curated lists:
Once your watchlist is set, take the next step and trade with confidence using StocksToTrade’s robust platform. Don’t miss out — grab your 14-day trial for just $7 and experience the edge you need to thrive in today’s fast-paced markets.