

Springview Holdings Ltd stocks have been trading up by 103.01 percent amid highly positive sentiment from recent market expansion news.
Market Insights For Active SPHL Traders
- Weekly chart shows SPHL more than doubling in one session, signaling aggressive speculative interest and short-term momentum.
- Intraday move from the low $2s to above $10 before closing mid-range highlights extreme volatility and wide trading ranges.
- Valuation sits rich versus fundamentals, with a high price-to-sales ratio and thin revenue base.
- Balance sheet carries solid cash and working capital, giving Springview Holdings Ltd some room to execute its strategy.
- Traders will be focused on whether SPHL can build a base above recent lows or fades back toward pre-spike pricing.
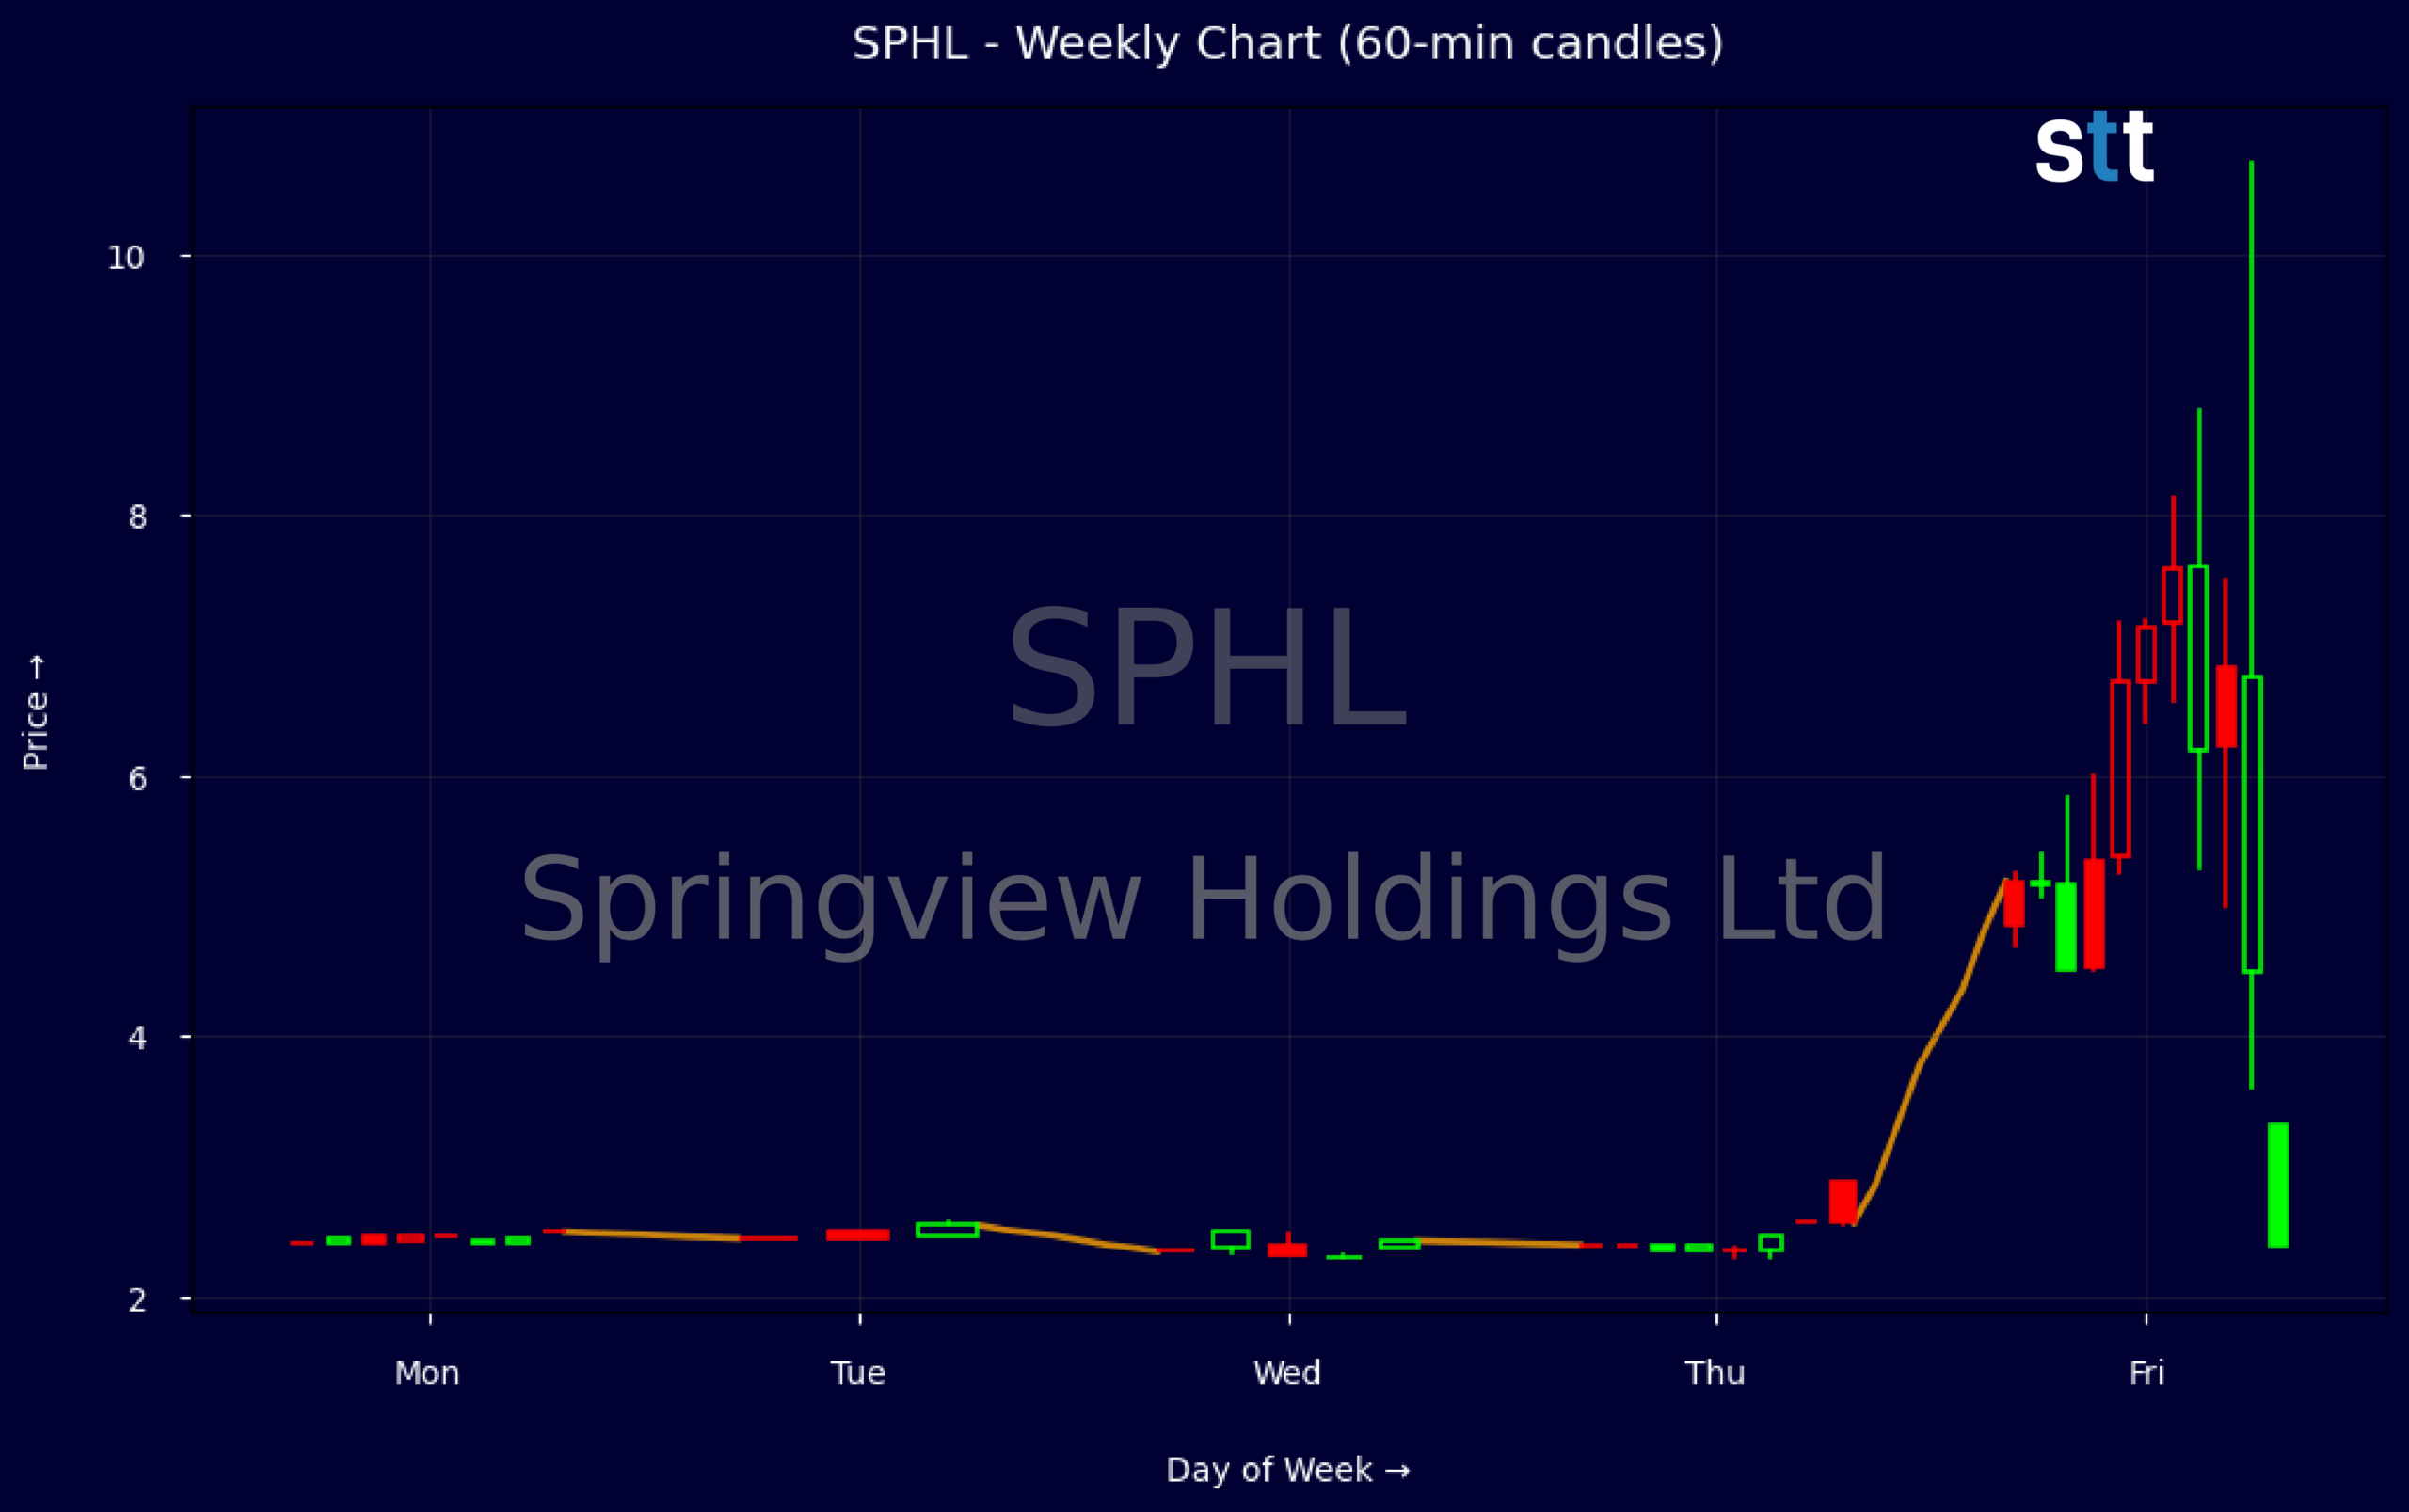
Weekly Update Jun 01 – Jun 05, 2026: On Sunday, June 07, 2026 Springview Holdings Ltd stock [NASDAQ: SPHL] is trending up by 103.01%! Discover the key drivers behind this movement as well as our expert analysis in the detailed breakdown below.
Consumer Discretionary industry expert:
Analyst sentiment – negative
SPHL is a micro-cap residential construction name with early-stage revenues of $7.8M and a rich ~$63M EV, implying a demanding 9.1x P/S and ~10x P/B on a thin equity base (BVPS ~$0.56). Profitability is not yet established, with ROIC around -29%, so the story is entirely growth and optionality-driven. The balance sheet is clean: modest leverage (long-term debt only ~$0.36M; long-term debt/capital ~0.06) and strong liquidity (working capital ~$7.0M, cash ~$3.8M).
Technically, SPHL has shifted from illiquid drift to a volatility regime change. Four weeks of tight trading around $2.35–2.45 culminated in an explosive week to a $6 intraday high before closing $4.85, signaling aggressive speculative buying on sharply higher volume. The dominant trend is now short-term bullish but fragile. The key actionable level is $4.50: above it, momentum buyers control; a sustained break below likely invites mean reversion toward the $3.00–3.25 zone.
More Breaking News
- CETX Stock Whipsaws As Traders Target Volatile Penny Name
- FDXF Stock Climbs As Traders Focus On Freight Cash Flows
- JDZG Stock Plunges As Volatility Grips Thinly Traded Name
- NVDA Stock Rebounds As Traders Weigh Trump Sale News
With no fresh fundamental news, the move looks technically driven rather than thesis-driven, leaving SPHL highly sensitive to sentiment in Consumer Discretionary and homebuilding, both of which have been stronger and more profitable on average. SPHL trades at a premium to established residential construction peers despite lacking margin visibility. My verdict: avoid chasing; high-risk traders can accumulate only on pullbacks to $3.00–3.25 with support there and resistance at $5.75–6.00. Institutional-quality long only above consistent execution.
Quick Financial Overview
Springview Holdings Ltd (SPHL) shows a dramatic recent shift in its trading profile. On the weekly data, the stock traded quietly around the low $2 area for several sessions, then exploded to a high near the mid-$6 range and closed around the mid-$4s. That kind of move more than doubles the stock from its base and signals that SPHL has attracted short-term momentum traders. Price discovery is clearly still underway as the market decides what this company is worth.
On the intraday side, the 5-minute snapshot shows an even more violent pattern. SPHL opened in the high $2s, spiked to above $10, then settled back near the mid-$5s by the close. That means traders who chased extremes had huge slippage risk, while those who waited for pullbacks had better entries. This is the kind of tape where order placement, sizing, and discipline matter more than usual.
Financially, Springview Holdings Ltd is a small-cap name with roughly $7.8M in revenue and an enterprise value near $63.5M, implying a price-to-sales around 9. Gross and profit margins are not clearly reported, but the balance sheet shows about $3.8M in cash, current assets near $9.9M, and working capital of roughly $7.0M. Book value per share is about $0.56, while the price-to-book multiple sits above 10, so traders are paying a steep premium to equity. Leverage looks moderate, with total liabilities around $3.7M versus equity of about $6.9M and long-term debt plus capital leases under $0.5M.
Conclusion
Springview Holdings Ltd: Volatility, Valuation, And Trading Edges
SPHL is now a textbook volatility play. The weekly move from a stable low-$2 range into the mid-$4s, combined with a single-bar intraday spike above $10, tells traders this is a thin, momentum-driven name. When price extends that far from a prior base, it often needs time to digest, either through sideways consolidation or a sharp retrace.
The fundamentals give a mixed picture. Springview Holdings Ltd carries solid cash and working capital relative to its size, but revenue is still modest and profitability metrics are unclear. A price-to-sales ratio around 9 and price-to-book over 10 say the market is pricing in strong future growth or continued speculative interest. For traders, that means the edge is in reading levels and flow, not leaning on deep value.
SPHL’s key near-term questions are simple: does price hold above the pre-spike $2–$3 area, and can it build a tighter range after the blowout day. Fade trades against extreme intraday spikes and breakout attempts from well-defined consolidations are both on the table, but risk must be sized for wide ranges. As I tell my students, “You do not have to predict the story — you just have to respect the volatility, trade your levels, and let the tape confirm your bias.” In other words, you need a clearly defined plan before you click the button; as Tim Bohen, lead trainer with StocksToTrade says, “If you’re still guessing at the end of your analysis, it’s probably not a trade worth taking.”
This is stock news, not investment advice. StocksToTrade News delivers real-time stock market updates tailored to highlight the key catalysts driving short-term price movements. Our coverage is designed for active traders and investors who thrive in fast-moving markets, with a focus on volatile sectors like penny stocks, AI stocks, Robinhood stocks and other momentum plays. From earnings reports and FDA approvals to mergers, new contracts, and unusual trading volume, we break down the events that can spark significant price action.
Looking to level up your trading game? Explore StocksToTrade, the ultimate platform for traders. With powerful tools designed for swing and day trading, integrated news scanning, and even social media monitoring, StocksToTrade keeps you one step ahead.
Check out our quick startup guide for new traders!
- How to Read Stock Charts: A Guide for Beginners
- Trading Plan: 6 Steps to Create One
- How To Create a Stock Watchlist
Ready to build your watchlists? Check out these curated lists:
Once your watchlist is set, take the next step and trade with confidence using StocksToTrade’s robust platform. Don’t miss out — grab your 14-day trial for just $7 and experience the edge you need to thrive in today’s fast-paced markets.