
SMJ International Holdings Inc. stocks have been trading down by -25.17 percent amid sharply negative sentiment from the latest ## Ma news.
Market Insights For Active Traders
- Weekly chart shows SMJF collapsing from above $11 to nearly $1, signaling a major repricing and broken trend.
- Intraday action around $1.11 highlights heavy volatility, with a wide range between $1.05 and $1.28 in a single session.
- Balance sheet for SMJ International Holdings Inc. shows solid equity of about $18.9M against roughly $11.1M in liabilities.
- Valuation metrics like price-to-sales near 2.26 and price-to-book around 2.08 suggest the stock trades at a moderate premium to net assets.
- Traders will focus on whether the $1 area becomes a durable base or a staging ground for further downside.
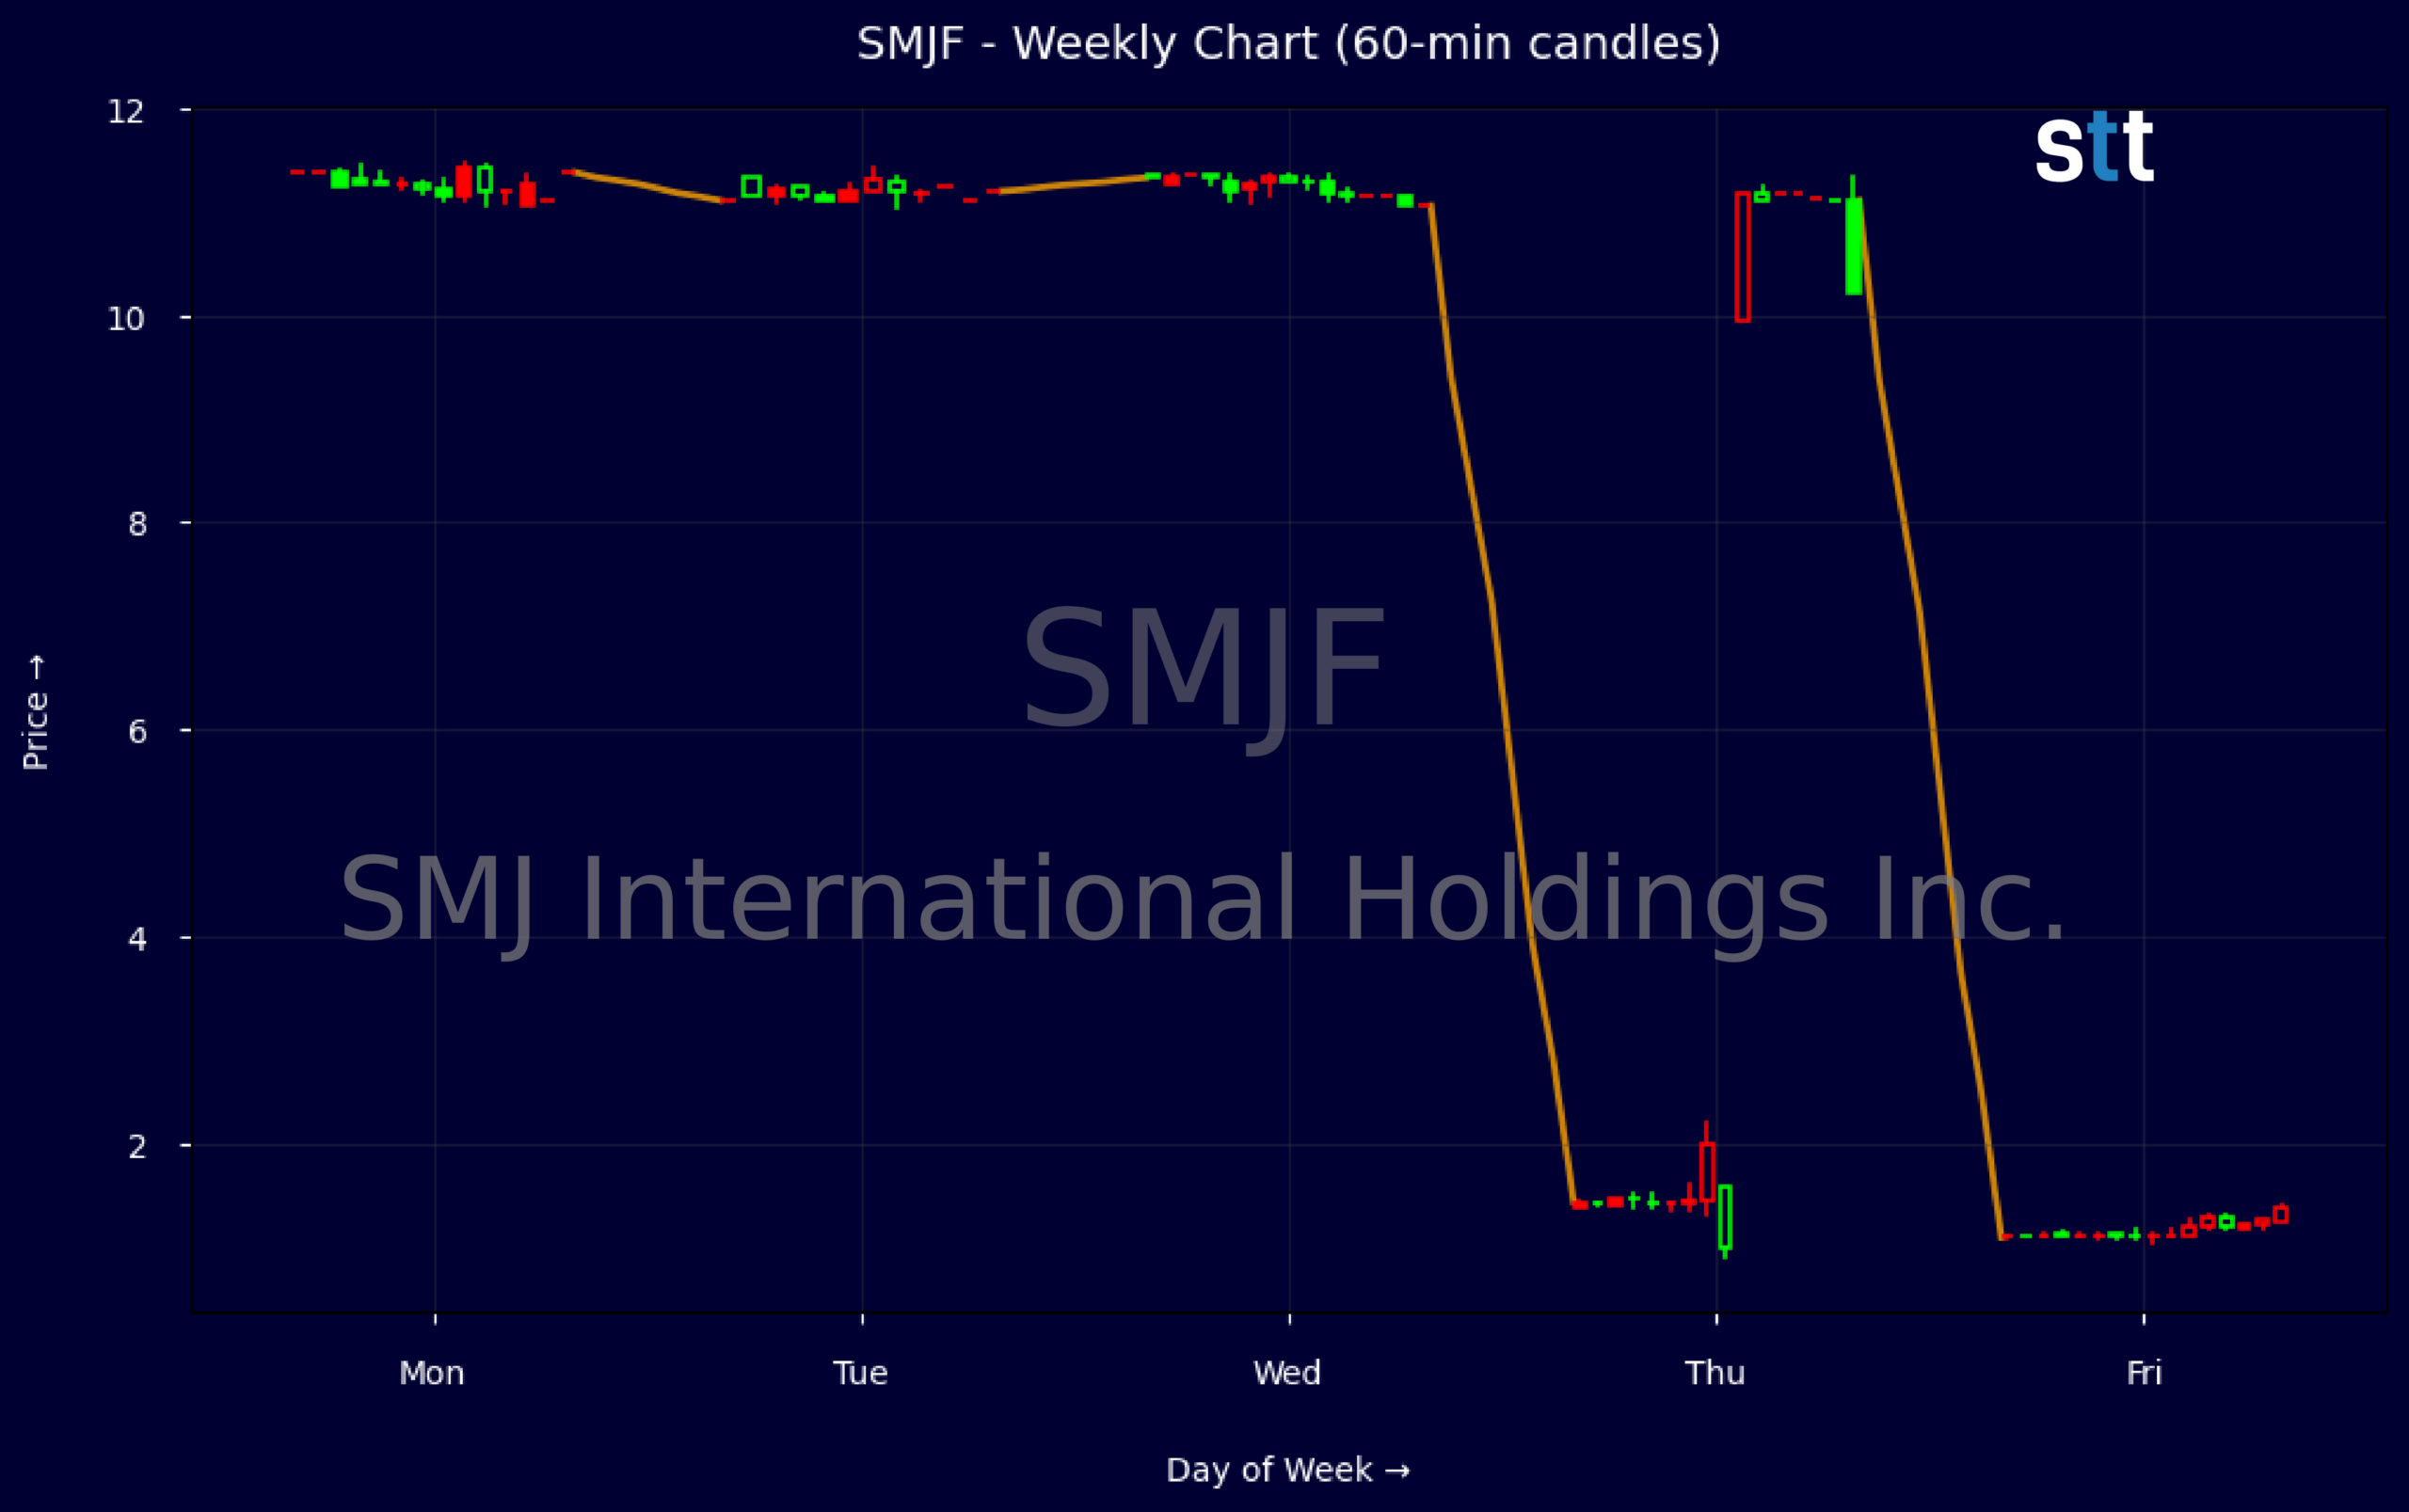
Weekly Update Aug 24 – Aug 28, 2026: On Sunday, August 30, 2026 SMJ International Holdings Inc. stock [NYSE American: SMJF] is trending down by -25.17%! Discover the key drivers behind this movement as well as our expert analysis in the detailed breakdown below.
Consumer Discretionary industry expert:
Analyst sentiment – negative
SMJF operates as a micro-cap with modest scale, posting revenue of ~$17.4M (≈$1.17/share) and an enterprise value of ~$25.8M, implying a rich 2.26x P/S against weak profitability (ROIC -3.55%, ROA and ROE effectively flat). Balance sheet quality is the key strength: equity of ~$18.9M versus ~$11.1M liabilities, long-term debt only ~$2.8M, and leverage at 1.6x with low non-current obligations, giving ample working capital (~$15.6M) and strategic flexibility.
The price history shows an extreme structural event: shares effectively reverse-split or repriced from the 11s to the low 1s within days, resetting the trading regime. Post-reset, price compressed from 1.38 to 1.10 on declining intraday ranges and low liquidity, signaling a new bearish consolidation. The dominant trend is down, with heavy overhead supply around 1.38–1.40. A precise trading level: aggressive short entries near 1.35–1.38 with a hard stop above 1.55, targeting 0.90.
More Breaking News
- SOFI Stock Slips As Analyst Warns Of $1B Headwind
- SPCX Slides As Policy Shocks And New Rivals Hit SpaceX
- GoDaddy Stock Jumps As Q3 Beat And AI Airo Fuel Bullish Outlook
- PURR Stock Tests Support As Hyperliquid Strategies Cash Pile Stands Out
With no fresh fundamental news, SMJF trades as a balance-sheet story rather than an earnings compounder, leaving it at a clear disadvantage versus Consumer Discretionary and especially Apparel & Luxury peers that offer stronger margins and brand-driven growth. Near term, I expect range-bound to lower trade with support at 1.00 and secondary at 0.85, resistance at 1.38. Verdict: avoid for long-only; only suitable for tactical traders around the 1.00–1.38 band.
Quick Financial Overview
SMJ International Holdings Inc. posts revenue of about $17.4M, or roughly $1.17 per share, which gives traders a first pass on how much business the company is doing relative to its market value. With enterprise value around $25.8M and a price-to-sales ratio near 2.26, SMJF is priced as a small but not distressed name. Price-to-book at about 2.08, against book value per share of $0.68, shows the market is still paying more than double the underlying equity.
The balance sheet is a key anchor here. Total assets sit near $29.98M, with equity around $18.91M and total liabilities about $11.07M. Current assets of roughly $19.86M against current liabilities near $4.28M translate into strong working capital and a healthy liquidity cushion. Leverage ratio of 1.6 and long-term debt and lease obligations close to $2.77M look manageable for a company this size.
Profitability metrics are weak, with recent return on capital around -3.55%, which tells traders SMJF has not been turning its asset base into solid returns. That matters when a chart breaks down this hard. On the weekly tape, the stock trades above $11 on 2026/08/24–26, then collapses into the $1.47–$1.11 zone by 2026/08/27–28, a massive drawdown that wipes out prior levels. Intraday, a single 5‑minute bar shows a wide $1.05–$1.28 range with a $1.11 close, underscoring how unstable price discovery is right now.
Conclusion
This is stock news, not investment advice. StocksToTrade News delivers real-time stock market updates tailored to highlight the key catalysts driving short-term price movements. Our coverage is designed for active traders and investors who thrive in fast-moving markets, with a focus on volatile sectors like penny stocks, AI stocks, Robinhood stocks and other momentum plays. From earnings reports and FDA approvals to mergers, new contracts, and unusual trading volume, we break down the events that can spark significant price action.
Looking to level up your trading game? Explore StocksToTrade, the ultimate platform for traders. With powerful tools designed for swing and day trading, integrated news scanning, and even social media monitoring, StocksToTrade keeps you one step ahead.
Check out our quick startup guide for new traders!
- How to Read Stock Charts: A Guide for Beginners
- Trading Plan: 6 Steps to Create One
- How To Create a Stock Watchlist
Ready to build your watchlists? Check out these curated lists:
Once your watchlist is set, take the next step and trade with confidence using StocksToTrade’s robust platform. Don’t miss out — grab your 14-day trial for just $7 and experience the edge you need to thrive in today’s fast-paced markets.