

SMJ International Holdings Inc. stocks have been trading down by -25.17 percent amid sharply negative sentiment from the latest headline.
Market Insights For Active Traders
- Recent trading shows a collapse from above $11 to nearly $1, signaling a major repricing that short-term traders cannot ignore.
- Volatility has spiked, with wide intraday ranges suggesting heightened uncertainty and active speculative flow in SMJF.
- Balance sheet data for SMJ International Holdings Inc. shows solid equity and working capital, offering some fundamental support beneath the sharp price drop.
- Valuation metrics, including a price-to-sales ratio near 3, point to a market still assigning growth expectations despite the recent selloff.
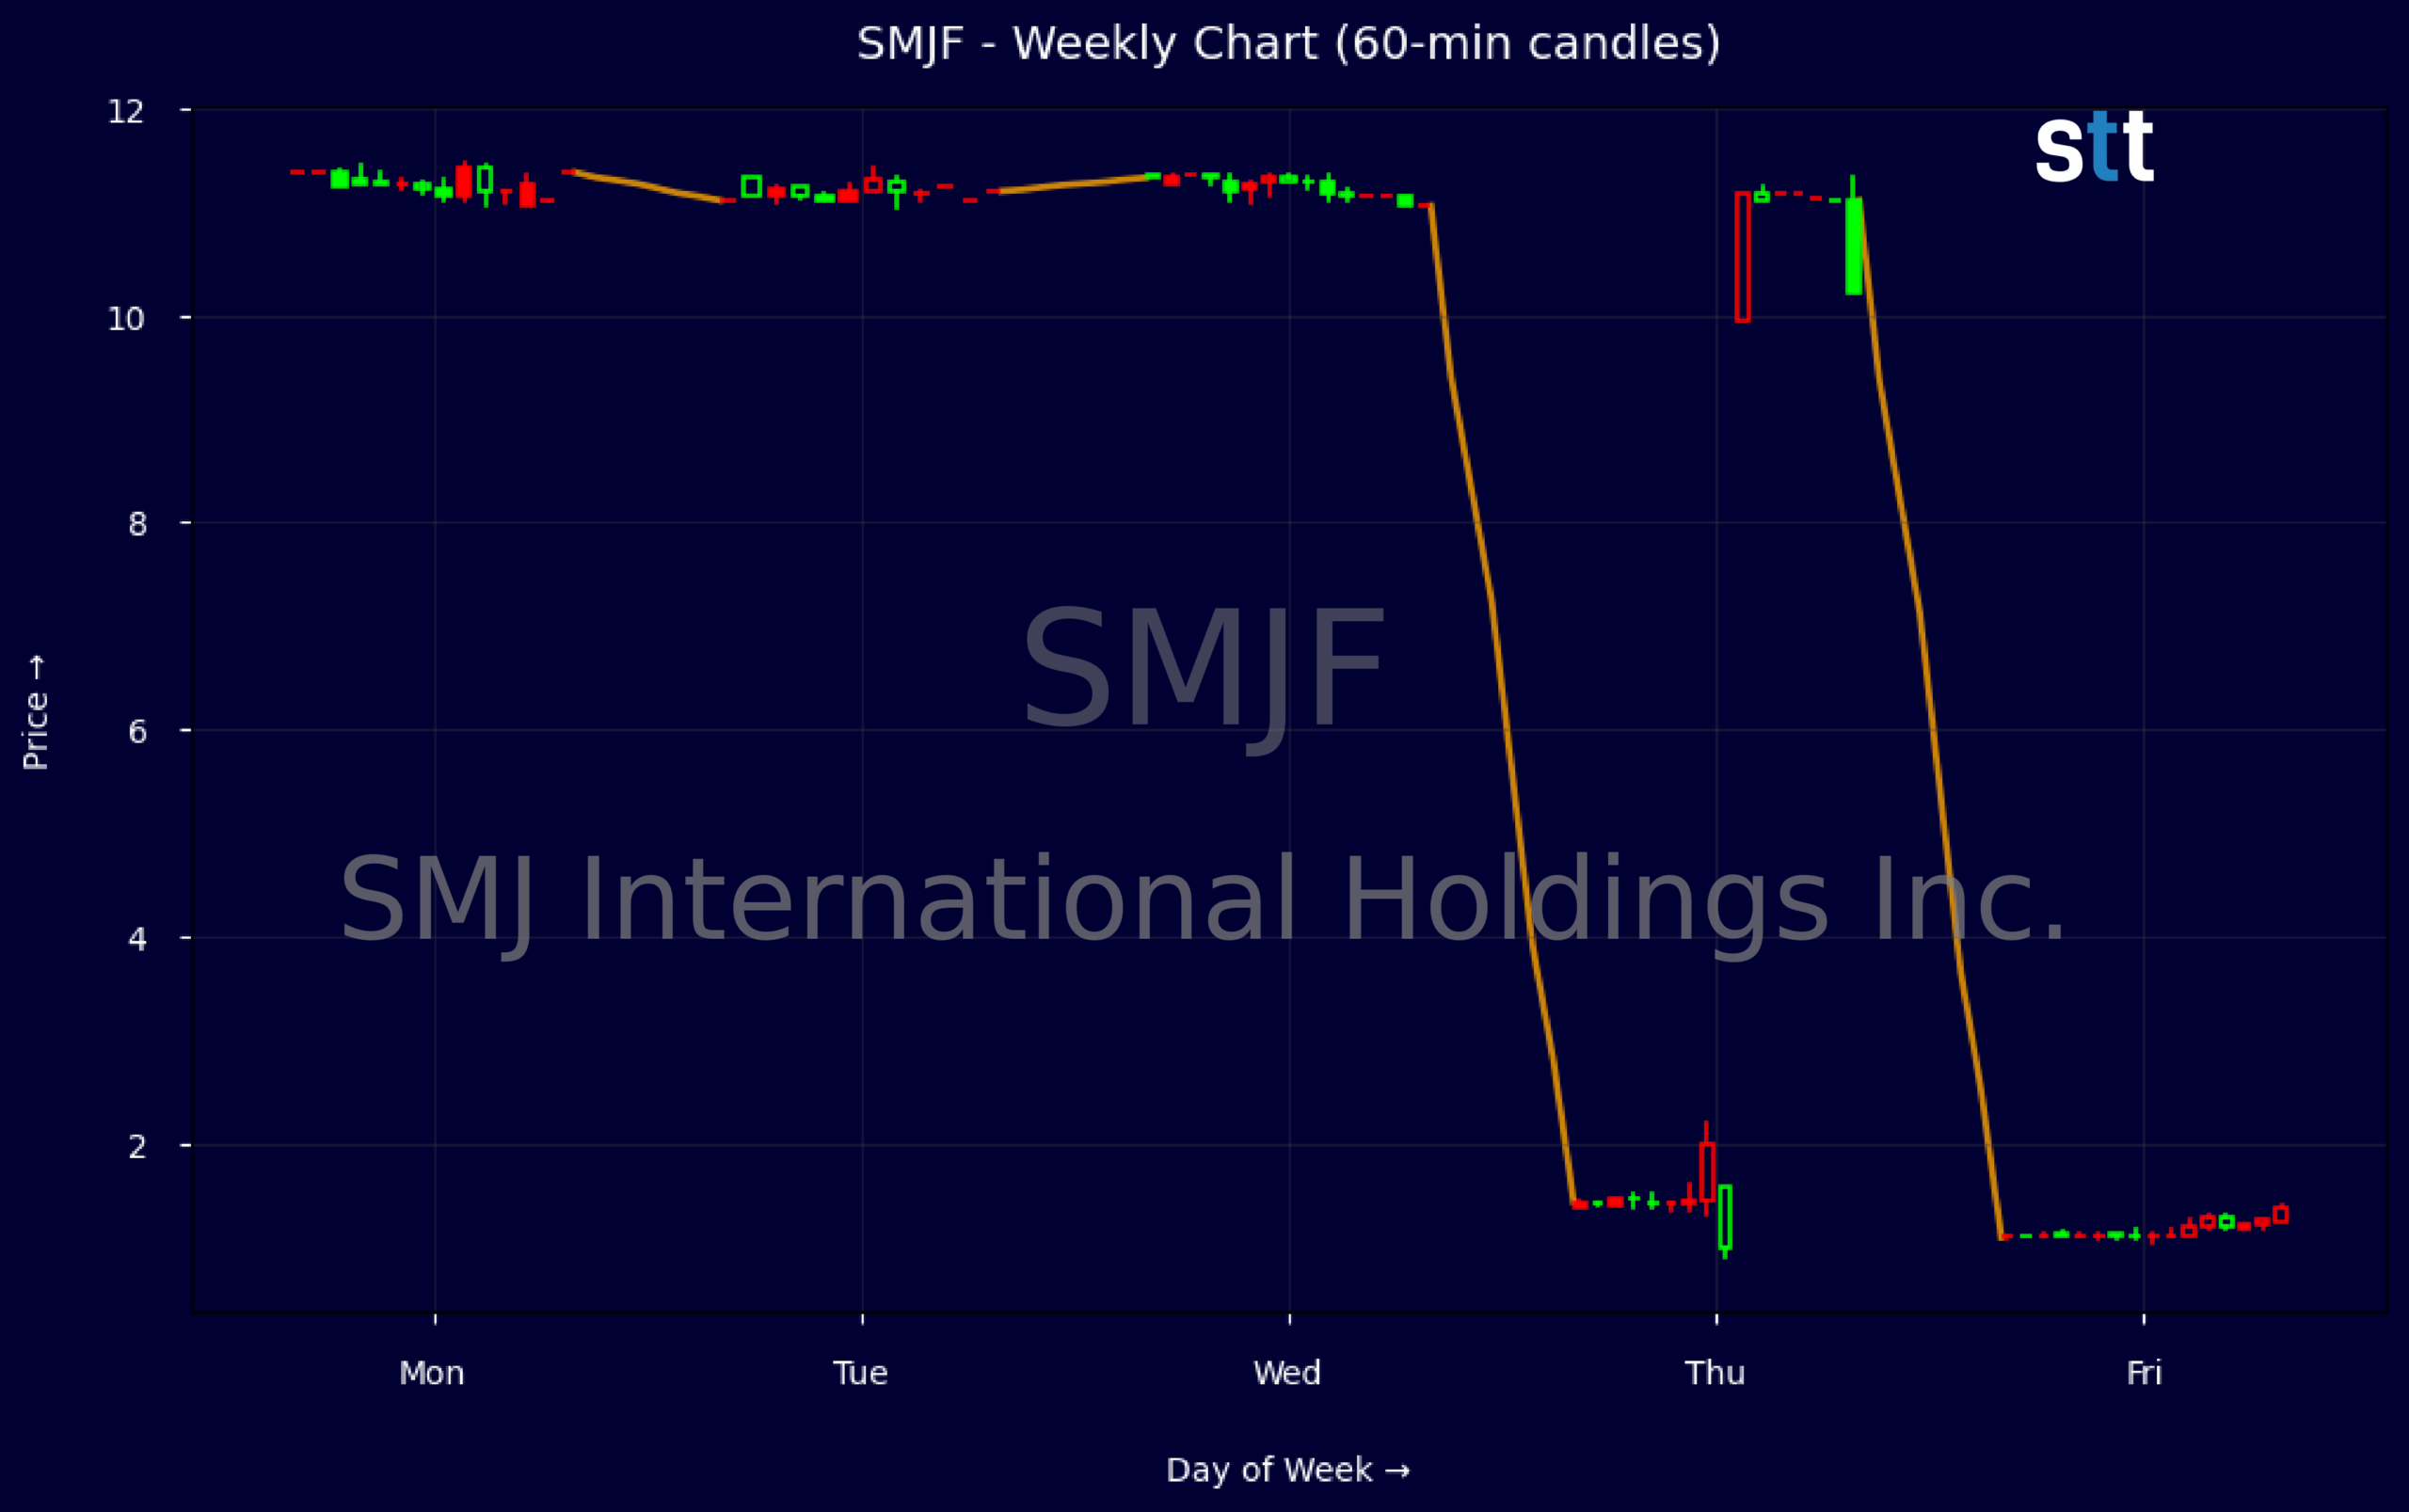
Weekly Update Aug 24 – Aug 28, 2026: On Saturday, August 29, 2026 SMJ International Holdings Inc. stock [NYSE American: SMJF] is trending down by -25.17%! Discover the key drivers behind this movement as well as our expert analysis in the detailed breakdown below.
Consumer Discretionary industry expert:
Analyst sentiment – negative
SMJF is a micro-cap discretionary name with modest revenue of ~$17.4m and an enterprise value of ~$35.7m, implying a rich 2.99x P/S and 2.76x P/B for a business that is not currently generating attractive returns (ROA ~0%, ROIC -3.6%). The balance sheet is a relative strength: equity of ~$18.9m versus total liabilities of ~$11.1m, leverage ratio 1.6 and long‑term debt/capital of 0.13, plus ample working capital of ~$15.6m for a 41‑employee operation.
The weekly tape shows an extreme structural event: four sessions around 11.1–11.4 followed by a 90%+ gap down into the low 1s, indicating either a consolidation, reverse split unwind, or severe repricing with thin liquidity. Dominant trend is now sharply bearish with failed support at ~11 and no prior volume base in the 1.0–1.5 zone. For short‑term traders, $1.00 is the key actionable level: sustained closes below $1.00 would signal continuation risk and likely force‑selling.
More Breaking News
- MPT Stock Slides As Traders Weigh Debt, Dividend Risk
- CareDx CDNA Rips Higher After Big Earnings Beat And Guidance Hike
- MEOH Stock Jumps As Earnings Beat Fuels Buyback Momentum
- NCPL Plunges As SEC Fraud Charges Ignite Legal Firestorm
With no identifiable news or disclosure explaining the repricing, SMJF screens materially weaker than Consumer Discretionary and Apparel & Luxury peers, which generally trade on demonstrable brand strength and mid‑teens ROIC. The combination of negative capital returns, opaque profitability, and technical breakdown argues against new long exposure. Near‑term resistance sits at $1.50, with secondary resistance at $2.00; my base‑case 6–12 month value‑oriented downside target is $0.60 absent a clear, accretive catalyst.
Quick Financial Overview
SMJ International Holdings Inc. (SMJF) has seen extreme price action in the recent weekly data. Early in the period, the stock traded around $11.25 to $11.40 and held that zone for several sessions, closing as high as $11.39. Then the stock collapsed into the low single digits, printing a weekly high near $1.53 and closing around $1.10 by 2026/08/28. That represents a dramatic reset in market expectations and a completely different trading profile for SMJF.
On the intraday 5-minute snapshot, SMJF opened at $1.14, pushed up to $1.28, and sold down to $1.05 before closing at $1.11. That kind of intraday range, more than 20% high-to-low, confirms aggressive two-sided trading and a lack of stable price discovery. For active traders, this means both opportunity and risk: fast moves, fast reversals, and a strong need for strict risk controls.
Financially, SMJ International Holdings Inc. reports revenue of about $17.44M, with price-to-sales near 2.99 and price-to-book around 2.76. Total assets sit near $29.98M against total liabilities of roughly $11.07M, leaving equity close to $18.91M. Working capital of about $15.58M and cash near $1.29M suggest the company has breathing room, even as returns on capital are currently negative, with a 1-year ROIC around -3.55.
Conclusion
SMJ International Holdings Inc. now trades like a completely different stock than it did just days earlier. A move from the $11 area down to near $1 indicates a massive shift in sentiment, positioning, or both. For SMJF, the new key battleground is the $1.00–$1.30 range shown in the recent candles. A sustained hold above $1.00 would signal that traders are accepting this lower valuation as a temporary floor, while repeated failures near $1.25–$1.30 would highlight it as a short-term supply zone.
From a balance sheet angle, SMJF carries more equity than liabilities, plus solid working capital, which should matter to swing traders who care whether a violent selloff is backed by real distress or just sentiment. At the same time, weak recent returns on capital and the sharp collapse in price tell you the market is not yet convinced about earnings power. For educational and research purposes, traders should treat SMJ International Holdings Inc. as a high-volatility name where tight trade planning is non-negotiable. This is where consistent screen time and process matter most; as Tim Bohen, lead trainer with StocksToTrade says, “A consistent trading routine beats sporadic action every time. Show up daily, and you’ll start to see the patterns others miss.” As I tell my students, “When a small-cap stock gets repriced 80–90% in a few sessions, you do not argue with the move — you build a plan around the levels the market is actually respecting.””,”scores”:{“risk-level”:”high”},”trade”:”false
This is stock news, not investment advice. StocksToTrade News delivers real-time stock market updates tailored to highlight the key catalysts driving short-term price movements. Our coverage is designed for active traders and investors who thrive in fast-moving markets, with a focus on volatile sectors like penny stocks, AI stocks, Robinhood stocks and other momentum plays. From earnings reports and FDA approvals to mergers, new contracts, and unusual trading volume, we break down the events that can spark significant price action.
Looking to level up your trading game? Explore StocksToTrade, the ultimate platform for traders. With powerful tools designed for swing and day trading, integrated news scanning, and even social media monitoring, StocksToTrade keeps you one step ahead.
Check out our quick startup guide for new traders!
- How to Read Stock Charts: A Guide for Beginners
- Trading Plan: 6 Steps to Create One
- How To Create a Stock Watchlist
Ready to build your watchlists? Check out these curated lists:
Once your watchlist is set, take the next step and trade with confidence using StocksToTrade’s robust platform. Don’t miss out — grab your 14-day trial for just $7 and experience the edge you need to thrive in today’s fast-paced markets.