
SLM Corporation faces heightened downside pressure as regulatory scrutiny intensifies, with stocks having been trading down by -9.42 percent.
Click Here for a Millionaire's POV on Trading SLM
SUBSCRIBE FOR ALERTSJOIN 50,000+ ACTIVE TRADERS
What Traders Need To Know
- Q3 loss of $0.19 per share versus a $0.63 profit a year ago shocked the Street and triggered a 4.4% after-hours drop.
- Quarterly revenue of $375.5M badly lagged the roughly $453.3M consensus, underscoring a sharp slowdown.
- 2026 EPS guidance was slashed to $1.95–$2.05 from $3.10–$3.20, far below prior Street expectations near $3.11–$3.12.
- Net charge-offs jumped to $90.4M in Q3 and $292M year-to-date, forcing higher full-year loss guidance of $400–$420M and a more than one-third earnings cut.
- Multiple law firms are probing potential securities-law violations and disclosure issues, adding legal and reputational overhang to SLM Corporation’s already weak setup.
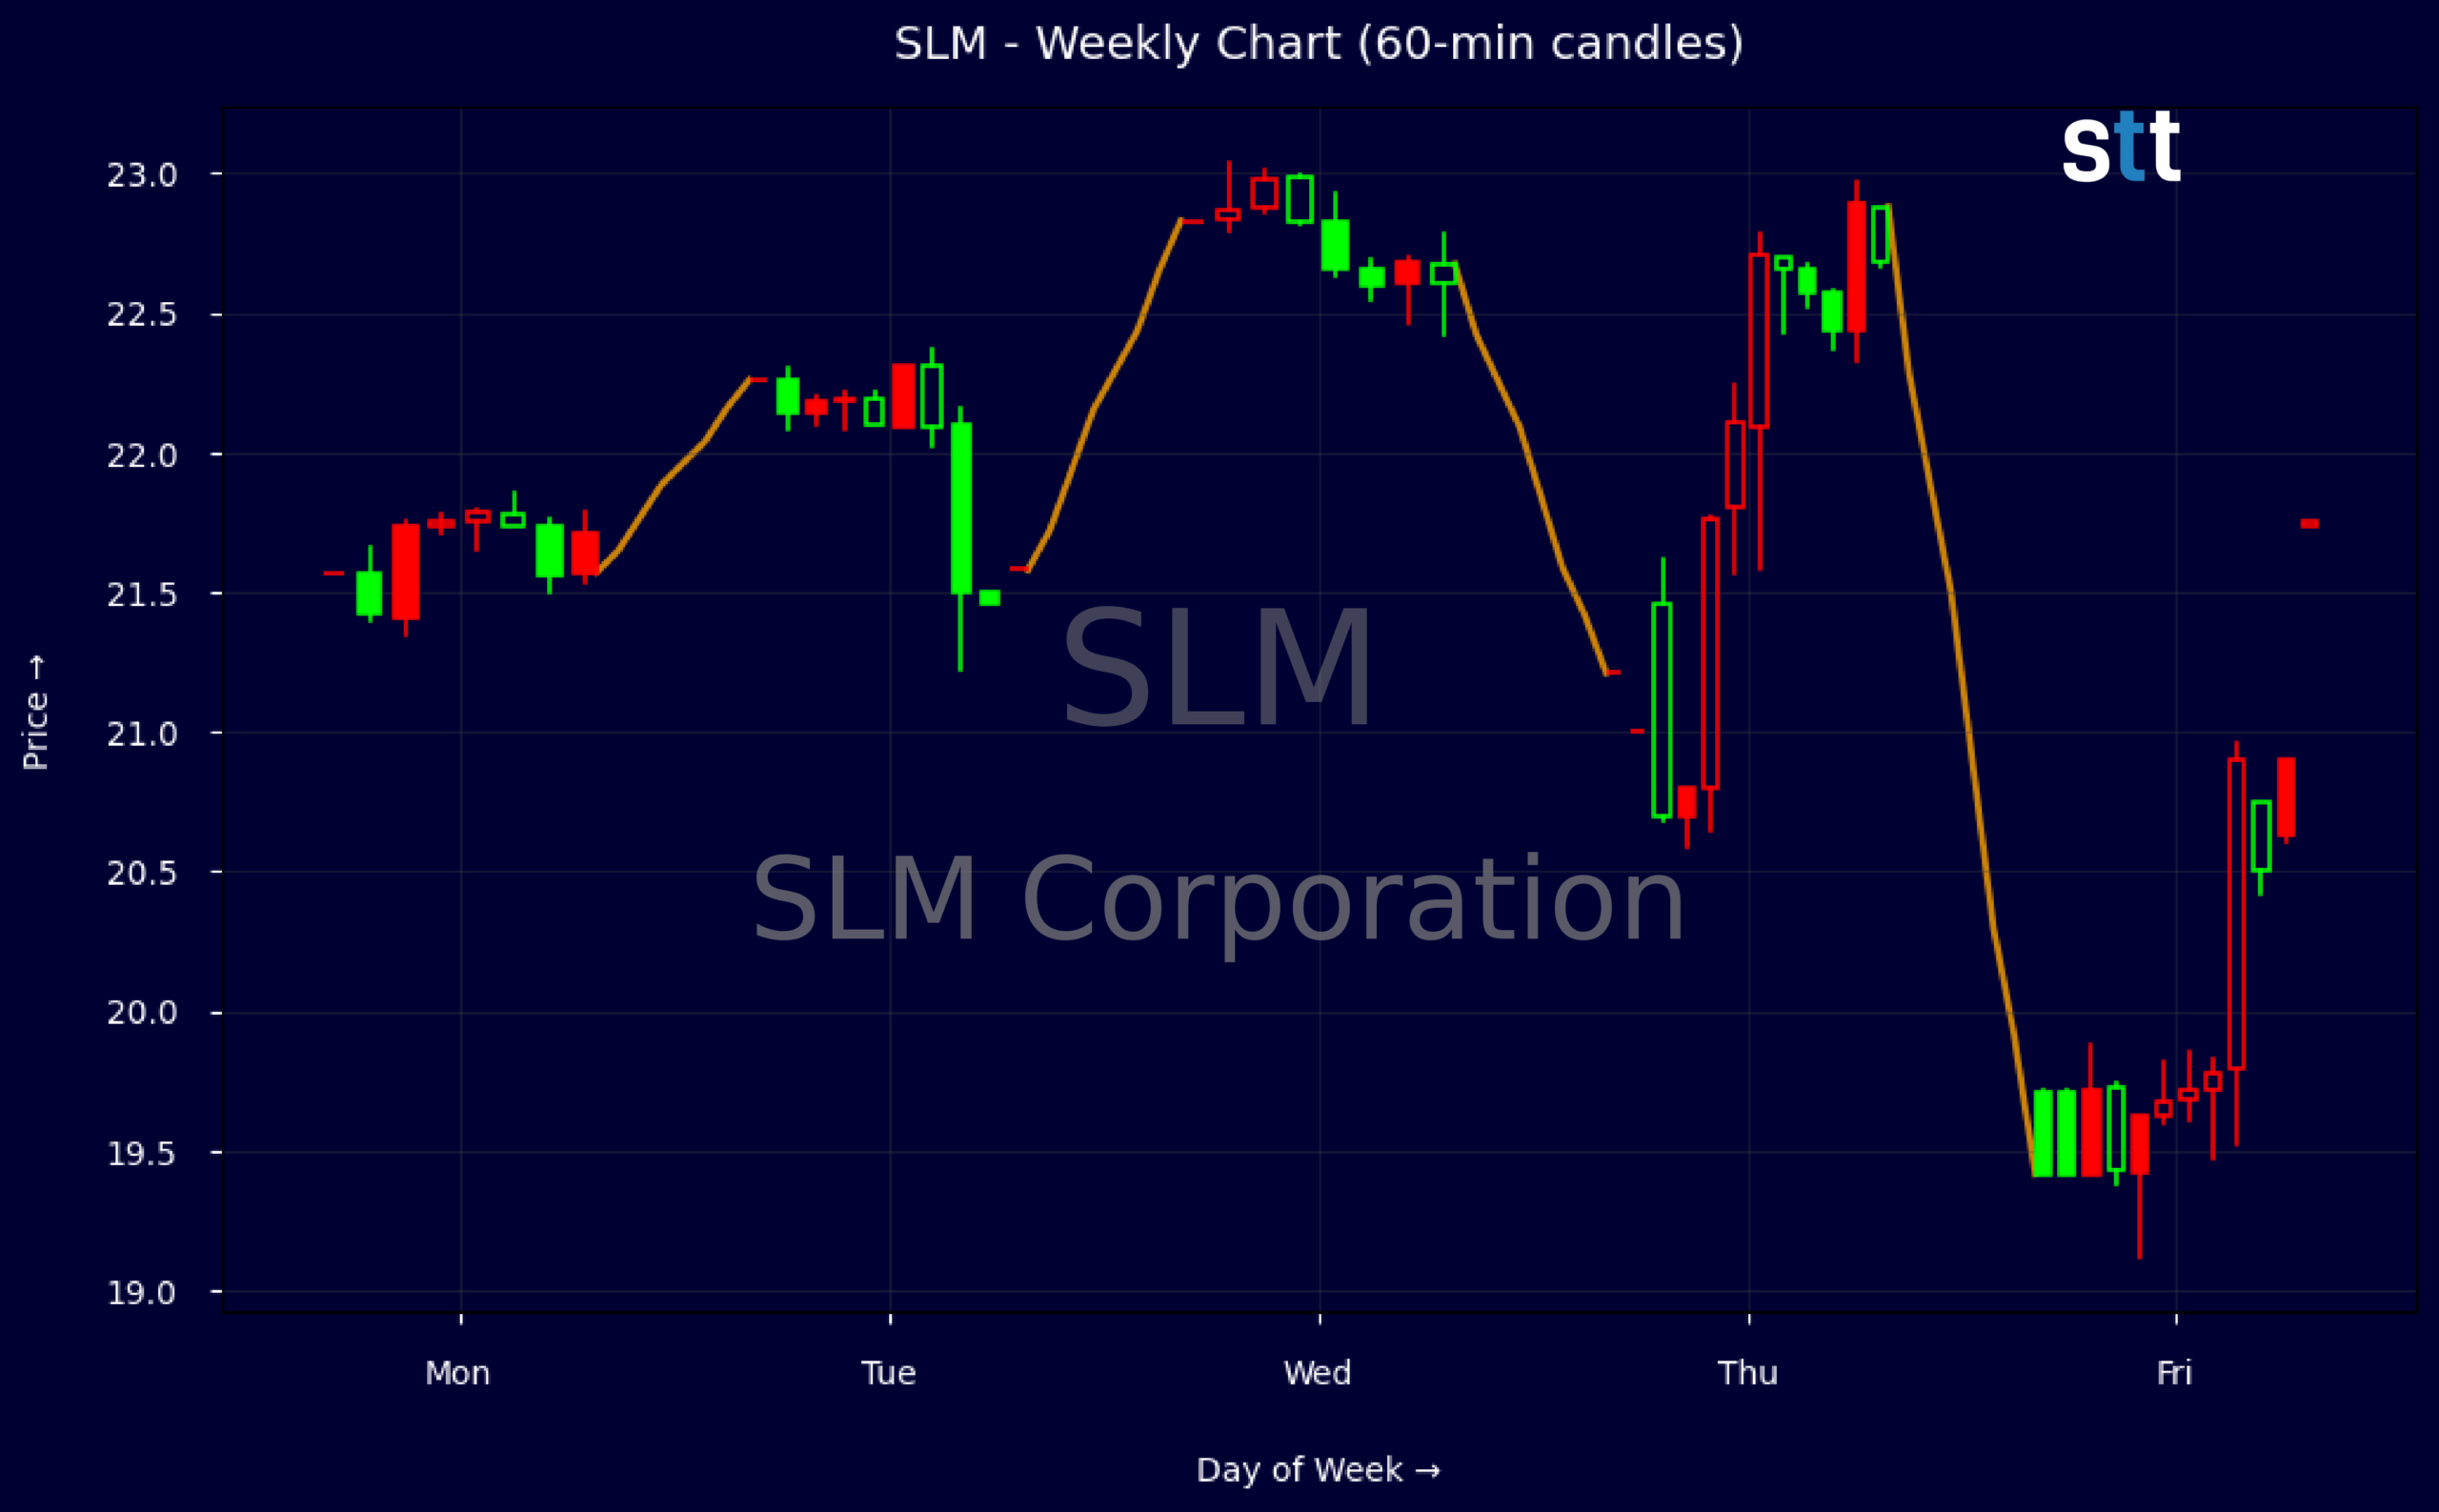
Weekly Update Oct 19 – Oct 23, 2026: On Saturday, October 24, 2026 SLM Corporation stock [NASDAQ: SLM] is trending down by -9.42%! Discover the key drivers behind this movement as well as our expert analysis in the detailed breakdown below.
Finance industry expert:
Analyst sentiment – negative
SLM’s franchise in private student lending remains sizable, but fundamentals have deteriorated sharply. Revenue is shrinking (three‑year CAGR −0.7%) with a recent quarterly loss and negative operating cash flow. Yet pre‑tax and consolidated profit margins on a trailing basis are strong, and ROE above 30% reflects high leverage (D/E 2.6x, leverage ratio ~13x) rather than core strength. The 6.3x P/E and ~2.7% dividend yield appear optically cheap but are not supported by cash generation or risk profile.
Technically, SLM has broken from a tight consolidation in the low‑20s into a clear short‑term downtrend, with a rapid slide from 22.83 to sub‑20 on elevated volume post‑earnings. Five‑minute candles show heavy selling into any intraday bounces, confirming distribution. The key actionable level is resistance at 21.25–21.50; rallies into that zone favor short entries with a stop above 22.00, while initial downside support sits near 18.75–19.00 where buyers may first stabilize price.
More Breaking News
- TDW Stock Grinds Higher As Tidewater Cash Flow Strengthens
- AAL Stock Slips As American Airlines Slashes 2026 Outlook
- RIG Stock Builds Backlog As Valaris Deal Nears Finish
- CrowdStrike Surges As Nvidia AI Security Deal Lifts CRWD
Near‑term catalysts are decisively negative. The Q3 miss, guidance reset to $1.95–$2.05, and charge‑off guidance hike to $400–$420M put SLM’s earning power well below credit‑finance peers, which generally maintain more stable NCO trends. Multiple securities‑law investigations compound governance and disclosure risk. Relative to finance benchmarks, SLM deserves a discount multiple. I assign a 6–7x forward EPS band, implying a 12‑month target range of $12–14, with resistance at 22 and firm support only emerging around 16.
Quick Financial Overview
SLM Corporation just printed the kind of quarter that forces traders to reprice the whole story. Q3 flipped from a $0.63 profit a year ago to a $0.19 loss per share and missed an expected $0.26 profit, while revenue of $375.5M fell well below the roughly $453.3M Street target. That explains the 4.4% after-hours slide and the roughly 9% hit after the 10-Q details came out.
On the chart, SLM moved from about $21.57 to $22.83, then cracked down to roughly $19.71 on the latest week, confirming a sharp breakdown from recent highs. The 5‑minute data show an intraday dump from around the low $20s to near $19.41, a clear liquidation move as traders reacted to the earnings release and guidance reset. For short-term players, that kind of high-range rejection usually means supply is still in control until proven otherwise.
Fundamentally, SLM still shows trailing profit metrics like a mid‑30s profit margin and a PE near 6.3, but those backward-looking numbers now clash with new guidance. Management cut 2026 EPS to $1.95–$2.05, far below the prior $3.10–$3.20 range, while charge-offs are guided up to $400M–$420M. High leverage (total debt to equity of 2.63 and a leverage ratio near 12.9) plus negative operating cash flow of about -$106M last quarter mean rising losses and paused third‑party recoveries bite harder.
Conclusion
This is stock news, not investment advice. StocksToTrade News delivers real-time stock market updates tailored to highlight the key catalysts driving short-term price movements. Our coverage is designed for active traders and investors who thrive in fast-moving markets, with a focus on volatile sectors like penny stocks, AI stocks, Robinhood stocks and other momentum plays. From earnings reports and FDA approvals to mergers, new contracts, and unusual trading volume, we break down the events that can spark significant price action.
Looking to level up your trading game? Explore StocksToTrade, the ultimate platform for traders. With powerful tools designed for swing and day trading, integrated news scanning, and even social media monitoring, StocksToTrade keeps you one step ahead.
Check out our quick startup guide for new traders!
- How to Read Stock Charts: A Guide for Beginners
- Trading Plan: 6 Steps to Create One
- How To Create a Stock Watchlist
Ready to build your watchlists? Check out these curated lists:
Once your watchlist is set, take the next step and trade with confidence using StocksToTrade’s robust platform. Don’t miss out — grab your 14-day trial for just $7 and experience the edge you need to thrive in today’s fast-paced markets.