

SKK Holdings Limited stocks have been trading up by 26.55 percent, driven mainly by strong expansion and earnings growth news.
Market Insights For Active Traders
- Recent intraday action shows a violent squeeze from around $3.50 to above $5.40 before closing near $4.77, signaling aggressive speculative interest.
- Weekly chart for SKK shows a fast drop from just under $5.00 toward $3.30, followed by a sharp rebound into the low $4.00s.
- Current price levels put SKK Holdings Limited near 1.6x book value, a key line for value-focused momentum traders.
- Balance sheet shows modest equity against sizable liabilities, keeping SKK in a higher-risk, higher-reward trading bucket.
- Traders are watching whether SKK can hold $4.00 as support after recent volatility and heavy reversal.
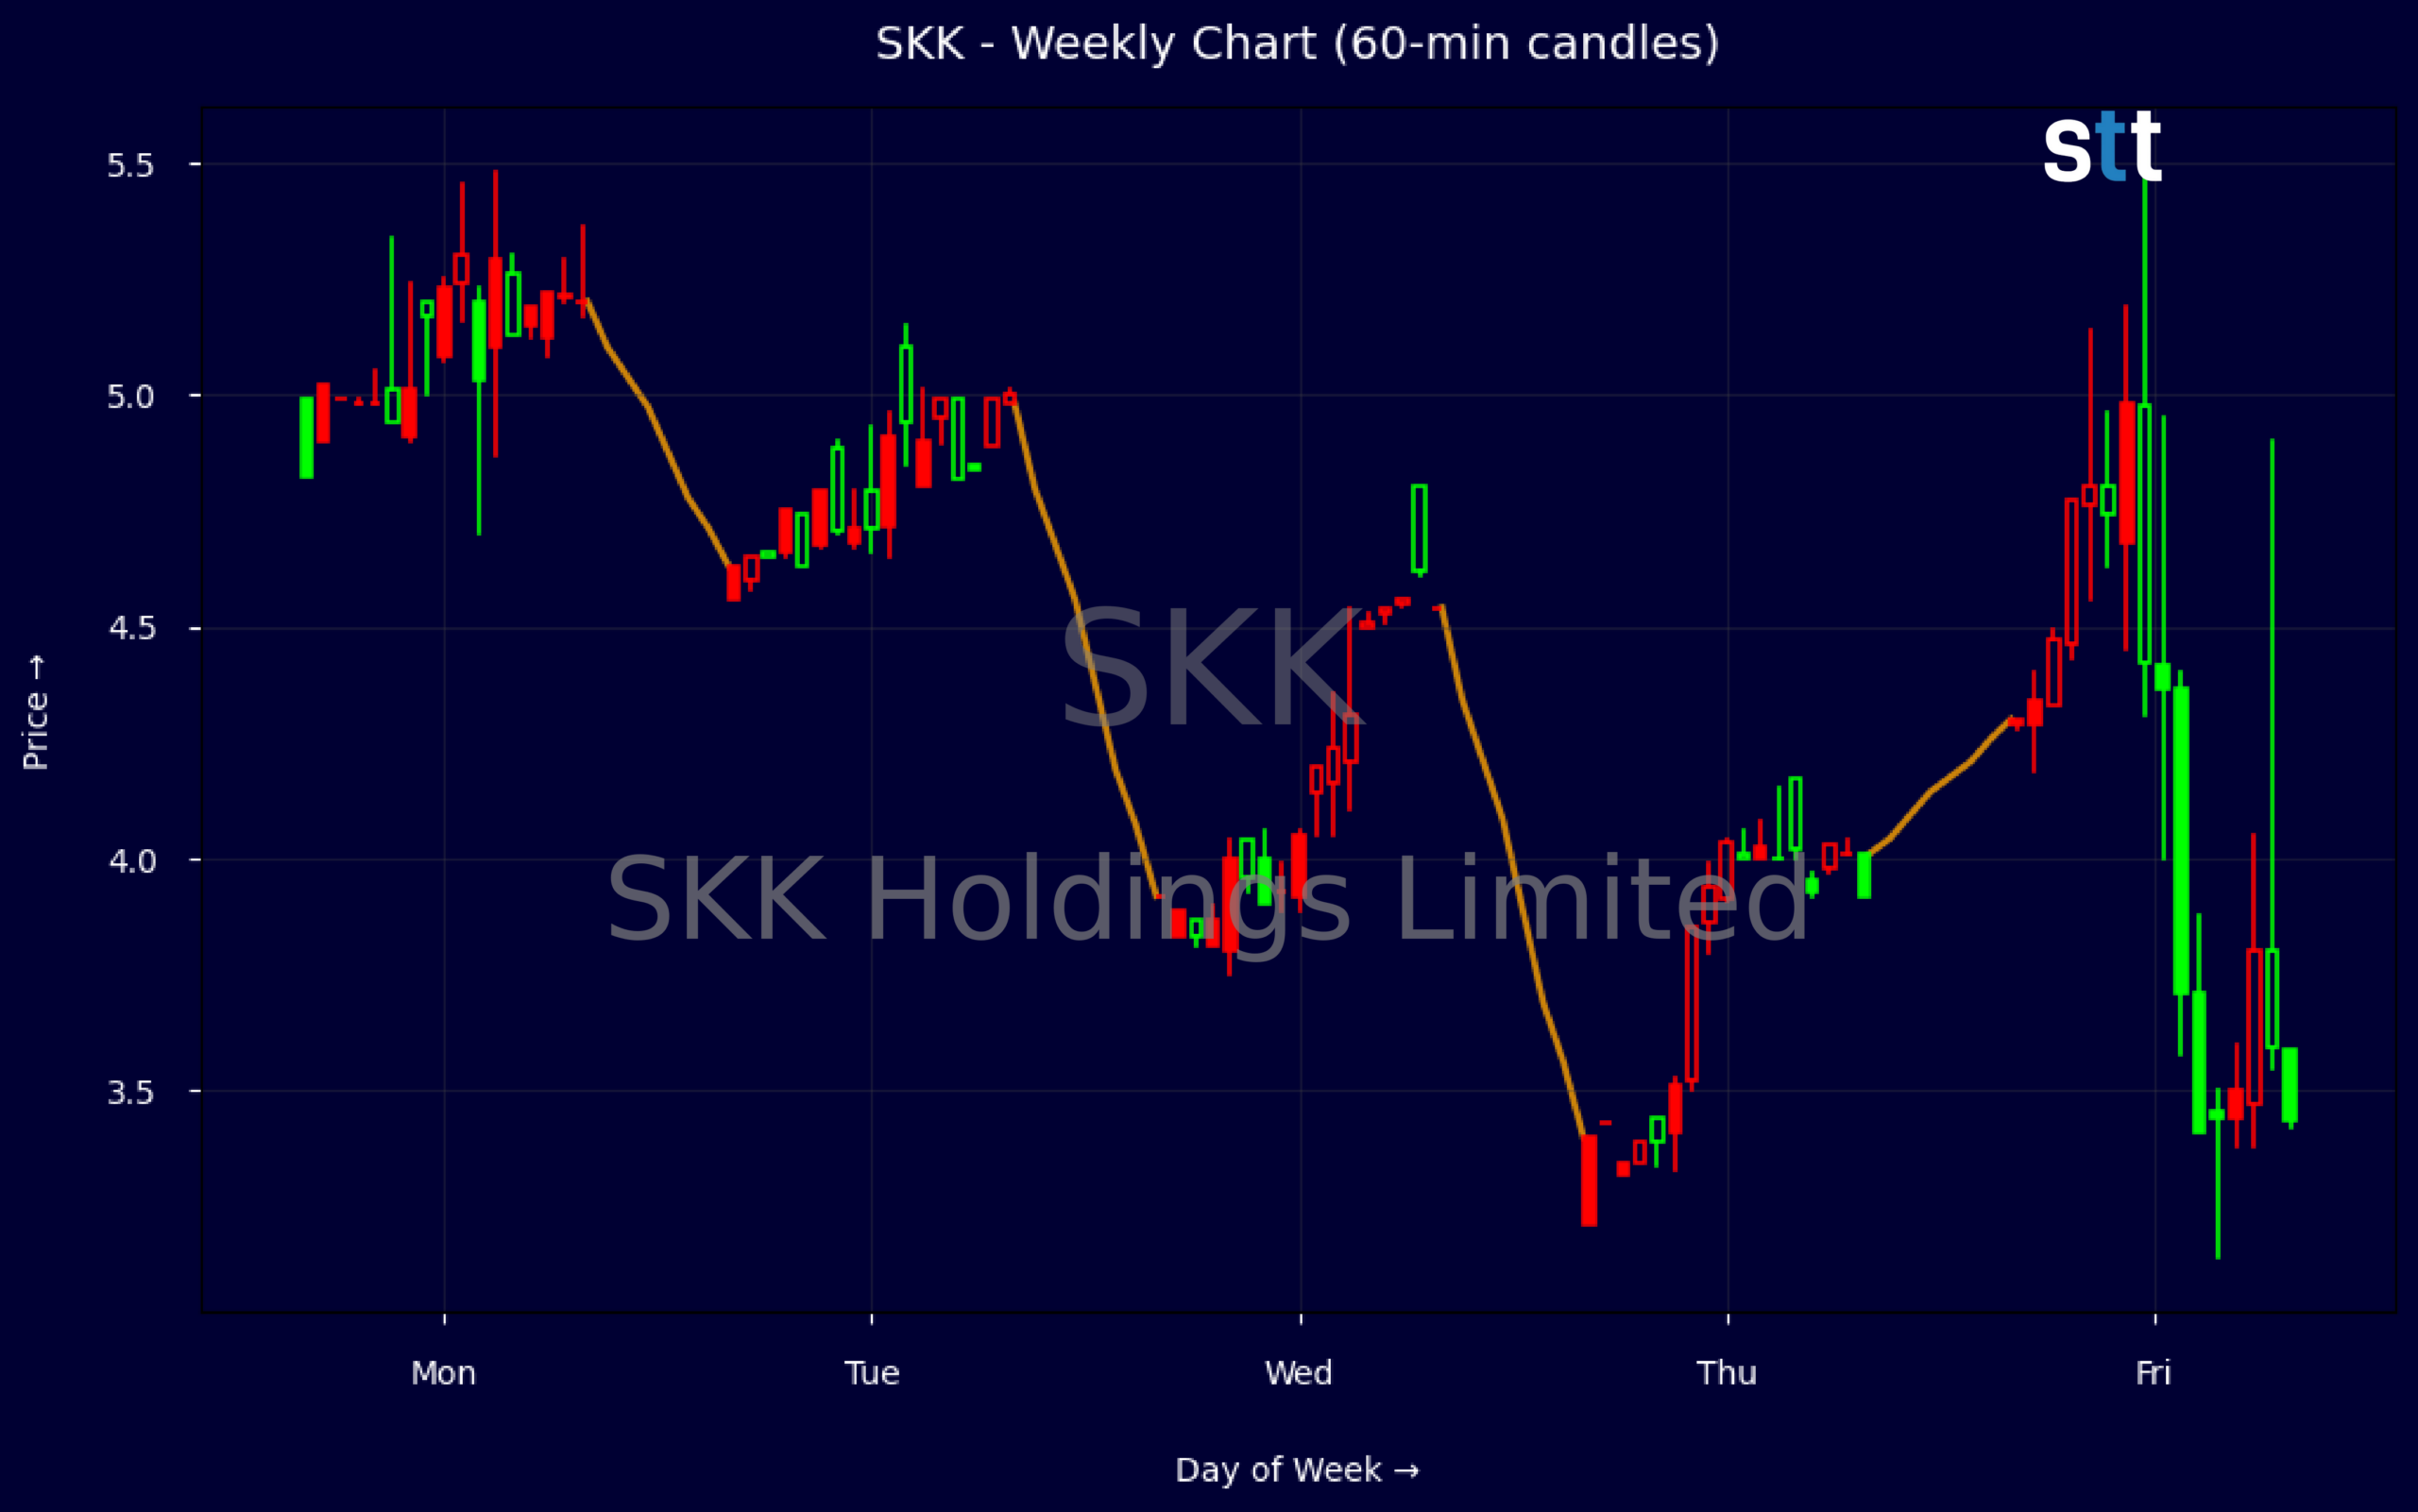
Weekly Update May 11 – May 15, 2026: On Sunday, May 17, 2026 SKK Holdings Limited stock [NASDAQ: SKK] is trending up by 26.55%! Discover the key drivers behind this movement as well as our expert analysis in the detailed breakdown below.
Industrials industry expert:
Analyst sentiment – negative
SKK operates as a small, asset-heavy industrial/construction name with modest scale (revenue ~$12.9m) and a lean workforce (169 employees), implying high capital intensity and operating leverage. Valuation is undemanding at ~0.9x sales and ~1.6x book (BVPS 2.96), but negative ROIC (-13.9%) signals value destruction. The balance sheet is stretched: leverage ratio 4.4, long‑term debt and leases ~9.2m vs equity 7.24m, working capital negative at -3.93m, and retained losses of -2.33m.
Technically, SKK is in a short-term downtrend after failing near 5.00. Weekly structure shows a sharp roll from 4.99 to 3.30, then a weak rebound to 4.29, with lower highs and elevated intraday volatility on 5‑minute candles, consistent with distribution rather than accumulation. The critical actionable level is 4.80–5.00 resistance; as long as price stays below 4.80 with normal or rising volume on down days, the tactical trade is short or underweight, with tight risk above 5.05.
More Breaking News
- Micron Stock Slides As China’s CXMT DRAM Threat Rattles Traders
- GPN Rises As Global Payments Scores Wave Of Upgrades
- NU Stock Plunges Nearly 20% As Volatility Spikes
- NOK Stock Slides As Earnings Strength Fails To Impress Traders
With no identifiable positive news catalysts, SKK lacks a narrative to re‑rate versus broader Industrials and Construction peers that typically show stronger ROIC and healthier working capital. Balance‑sheet risk, negative retained earnings, and subscale operations argue for a discount multiple. Near term, I see resistance at 4.80–5.00 and first support at 3.20–3.40; a decisive break below 3.20 opens 3.00. Verdict: avoid on a fundamental basis and use strength toward 4.80–5.00 to reduce exposure.
Quick Financial Overview
SKK Holdings Limited shows a mix of aggressive price action and moderate scale fundamentals. Revenue stands near $12.9M, which translates into roughly $9.50 of revenue per share. With a price-to-sales ratio around 0.9, the market is valuing SKK at just under 1x current sales, which is relatively low for a name showing this kind of volatility. That combination attracts short-term traders who like tight floats and modest valuations with room for sentiment swings.
From a balance sheet standpoint, SKK carries total assets of about $31.6M and equity near $7.24M, implying leverage is meaningful. Working capital is negative by roughly $3.93M, as current liabilities exceed current assets, which raises liquidity risk if cash generation slows. The leverageratio of 4.4 and long-term debt around $7.0M underline that this is not a cash-rich story. For traders, that financial pressure often translates into sharper moves when sentiment shifts.
On the chart, SKK Holdings Limited printed a weekly high close at $4.99 before sliding across several weeks to about $3.30, then snapping back to the $4.29 area. That pattern suggests an early-stage attempt to base after a hard pullback. Intraday, a single 5-minute bar shows a wide range from about $3.50 to $5.50 with a close near $4.77, confirming that SKK can move quickly when volume hits. Traders should note how often SKK tests the $3.20–$3.40 zone as downside pivot and the $4.80–$5.00 band as near-term resistance.
Conclusion
This is stock news, not investment advice. StocksToTrade News delivers real-time stock market updates tailored to highlight the key catalysts driving short-term price movements. Our coverage is designed for active traders and investors who thrive in fast-moving markets, with a focus on volatile sectors like penny stocks, AI stocks, Robinhood stocks and other momentum plays. From earnings reports and FDA approvals to mergers, new contracts, and unusual trading volume, we break down the events that can spark significant price action.
Looking to level up your trading game? Explore StocksToTrade, the ultimate platform for traders. With powerful tools designed for swing and day trading, integrated news scanning, and even social media monitoring, StocksToTrade keeps you one step ahead.
Check out our quick startup guide for new traders!
- How to Read Stock Charts: A Guide for Beginners
- Trading Plan: 6 Steps to Create One
- How To Create a Stock Watchlist
Ready to build your watchlists? Check out these curated lists:
Once your watchlist is set, take the next step and trade with confidence using StocksToTrade’s robust platform. Don’t miss out — grab your 14-day trial for just $7 and experience the edge you need to thrive in today’s fast-paced markets.