

Satellogic Inc. stocks have been trading up by 8.11 percent amid upbeat sentiment on its expanding Earth-observation services demand.
Market Insights For SATL Traders
- Q2 revenue jumped 259% year over year to $15.9M, crushing the $9.6M consensus, while EPS of -$0.13 missed the -$0.02 estimate but came with positive operating income and adjusted EBITDA.
- Street support held firm as Cantor Fitzgerald trimmed its price target from $10 to $9 yet kept an Overweight rating after revenue and gross margin beats and execution on key growth projects.
- Roth Capital lowered its target from $15 to $10 but maintained a Buy rating, pointing to strong core growth, solid remaining performance obligations, and growing customer adoption.
- A new Senior Vice President of Space Systems, Jamil Kawar, was hired to ramp sovereign constellation and space infrastructure sales, especially across MENA and Europe.
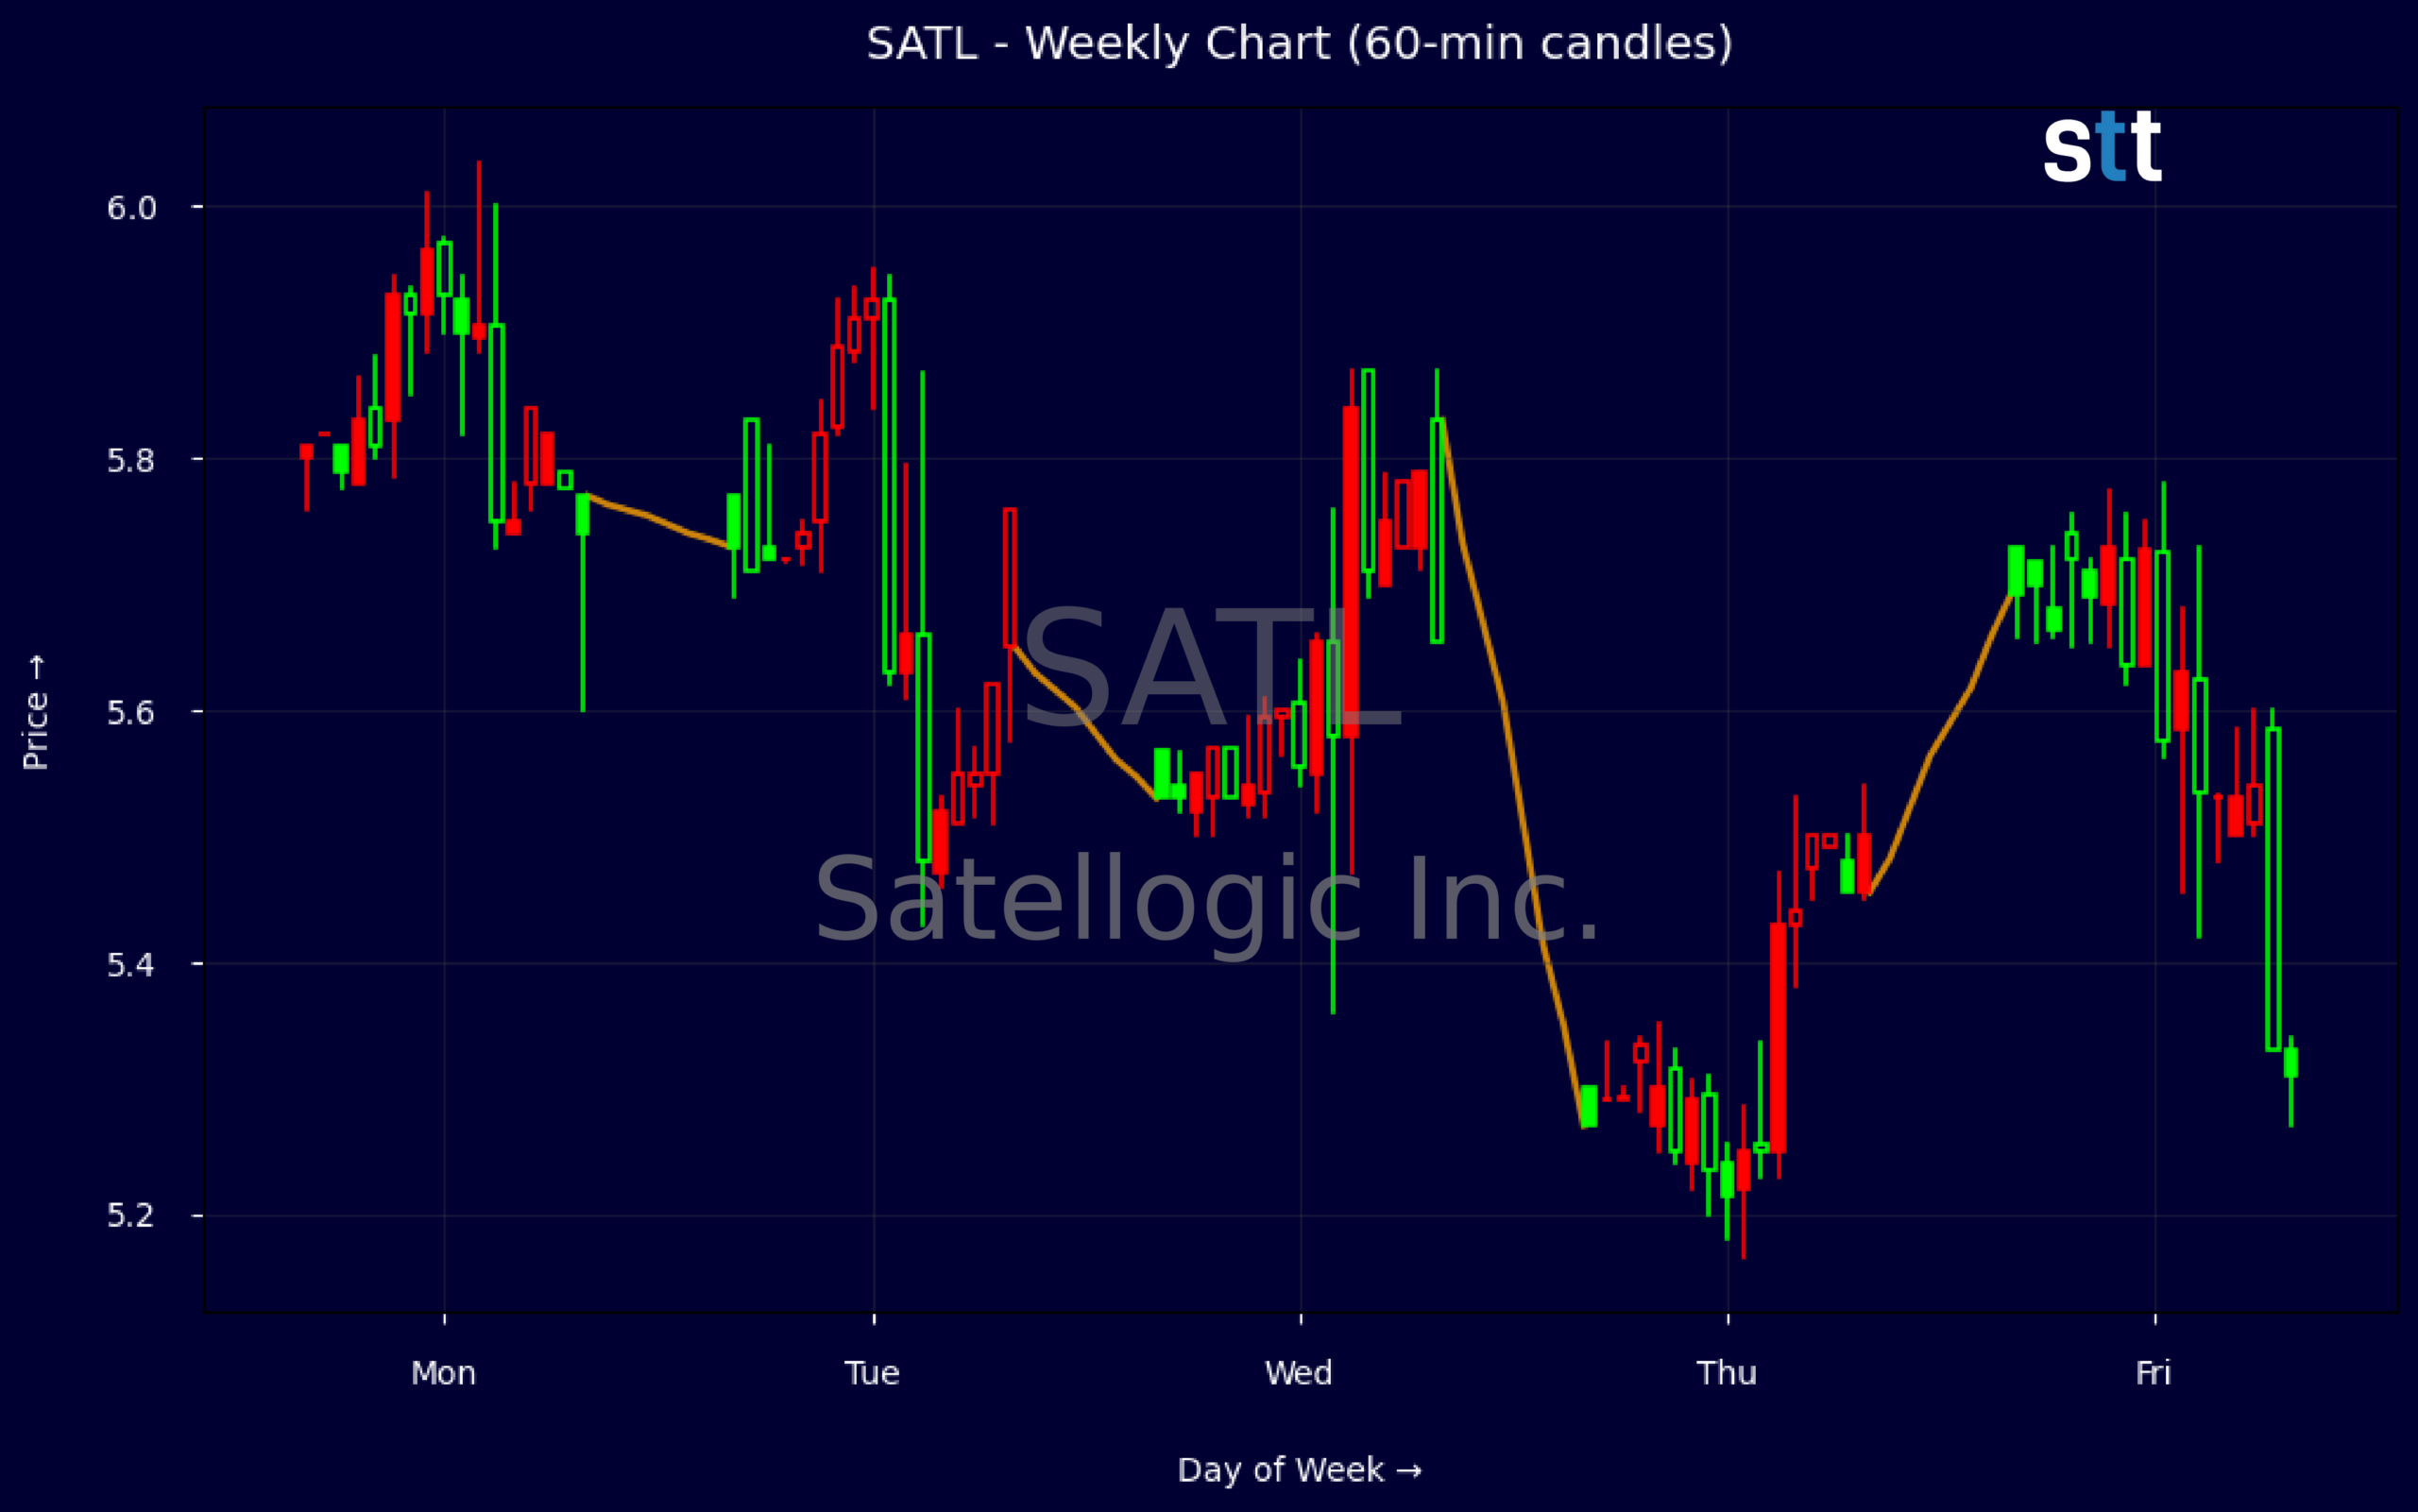
Weekly Update Aug 17 – Aug 21, 2026: On Sunday, August 23, 2026 Satellogic Inc. stock [NASDAQ: SATL] is trending up by 8.11%! Discover the key drivers behind this movement as well as our expert analysis in the detailed breakdown below.
Industrials industry expert:
Analyst sentiment – positive
Satellogic (SATL) is an early-stage space-imagery platform with hypergrowth but extremely weak underlying fundamentals. Q2 revenue of $15.9M on a trailing ~$17.7M base and 96.6% gross margin highlight a highly scalable model, yet EBIT margin of roughly -330% and FCF of -$14.3M underline a cash-burning profile. Leverage is elevated (long-term debt $95.2M; debt/cap ~44%), and equity is thin ($33.9M) versus $112.8M cash, giving a finite but adequate runway.
Technically, SATL is consolidating after a sharp pullback, with the weekly tape showing a rebound from a $5.27 low to a $5.73 close, but still below the early-week $5.81–5.82 zone. Intraday 5‑minute candles indicate buyers stepping in on dips near $5.30–5.40 with improving volume, yet upside stalls in the mid‑$5.70s. Dominant trend is sideways-to-mildly bullish; a specific tactical long entry is $5.35–5.40 with a tight stop below $5.25.
More Breaking News
- WKHS Stock Draws Traders As EV Orders Grow And AI Pivot Emerges
- SNDG ETF Slides As Volatility Pressures Bullish Traders
- REGN Stock Jumps As Bullish Data And Targets Pile Up
- BMNR Stock Holds Key Range As Traders Track Cash-Fueled Turnaround
Fundamentally, SATL’s setup is stronger than the typical small-cap industrial, with 259% YoY revenue growth, backlog visibility, and positive operating income/adjusted EBITDA contrasting sharply with its still deeply negative GAAP margins versus diversified Industrials and established Aerospace & Defense peers. Street remains constructive (Overweight/Buy ratings; trimmed but still high targets of $9–10). Near term, key resistance sits at $6.00–6.20, support at $5.25; base case 6–12 month upside target is $8, assuming execution on constellation and Merlin initiatives.
Quick Financial Overview
Satellogic Inc. just printed the kind of quarter that gets short-term traders paying attention. Q2 revenue came in at $15.9M, a 259% year‑over‑year jump, well ahead of the roughly $9.6M expectation. Even with EPS at -$0.13 versus -$0.02 expected, the key shift was to positive operating income and positive adjusted EBITDA, which management calls an inflection point toward sustainable profitability.
Under the hood, SATL still screens like a high‑risk growth name. Trailing revenue of about $17.7M sits against an enterprise value near $116.0M, driving a rich price‑to‑sales ratio around 27.6. Profitability ratios are deeply negative, with return on assets around -87% and heavy reported losses, even as gross margin sits at an extremely high 96.6%, reflecting an asset‑light data model leveraged over a costly space infrastructure base.
On the balance sheet, Satellogic Inc. holds about $112.8M in cash and short‑term investments, with working capital near $79.8M and a current ratio of 2.3, giving it room to keep funding growth. Long‑term debt of roughly $95.2M and a leverage ratio of 5.8 show meaningful financial risk, but also operating runway if revenue keeps scaling. On the chart, weekly closes between roughly $5.29 and $5.75 over recent sessions show a tight range after earnings, while an intraday 5‑minute candle that ran from a $5.45 open to a $5.78 high before closing at $5.72 signals active dip‑buying and momentum interest.
Conclusion
This is stock news, not investment advice. StocksToTrade News delivers real-time stock market updates tailored to highlight the key catalysts driving short-term price movements. Our coverage is designed for active traders and investors who thrive in fast-moving markets, with a focus on volatile sectors like penny stocks, AI stocks, Robinhood stocks and other momentum plays. From earnings reports and FDA approvals to mergers, new contracts, and unusual trading volume, we break down the events that can spark significant price action.
Looking to level up your trading game? Explore StocksToTrade, the ultimate platform for traders. With powerful tools designed for swing and day trading, integrated news scanning, and even social media monitoring, StocksToTrade keeps you one step ahead.
Check out our quick startup guide for new traders!
- How to Read Stock Charts: A Guide for Beginners
- Trading Plan: 6 Steps to Create One
- How To Create a Stock Watchlist
Ready to build your watchlists? Check out these curated lists:
Once your watchlist is set, take the next step and trade with confidence using StocksToTrade’s robust platform. Don’t miss out — grab your 14-day trial for just $7 and experience the edge you need to thrive in today’s fast-paced markets.