

Satellogic Inc. stocks have been trading up by 8.11 percent amid strong investor optimism over expanded satellite imaging contracts.
What Traders Need To Know
- Q2 showed a 259% revenue surge to $15.9M, crushing the $9.6M consensus and marking a shift to positive operating income and positive adjusted EBITDA despite a wider‑than‑expected EPS loss.
- Street reaction was mixed but constructive, with Cantor Fitzgerald trimming its price target from $10 to $9 while keeping an Overweight rating after revenue and gross margin beats.
- Another boost came from Roth Capital, which cut its price target from $15 to $10 but reiterated a Buy rating, pointing to strong core growth and better revenue visibility.
- Leadership depth improved as the company hired space and defense veteran Jamil Kawar to scale sovereign constellation and infrastructure deals, especially across MENA and Europe.
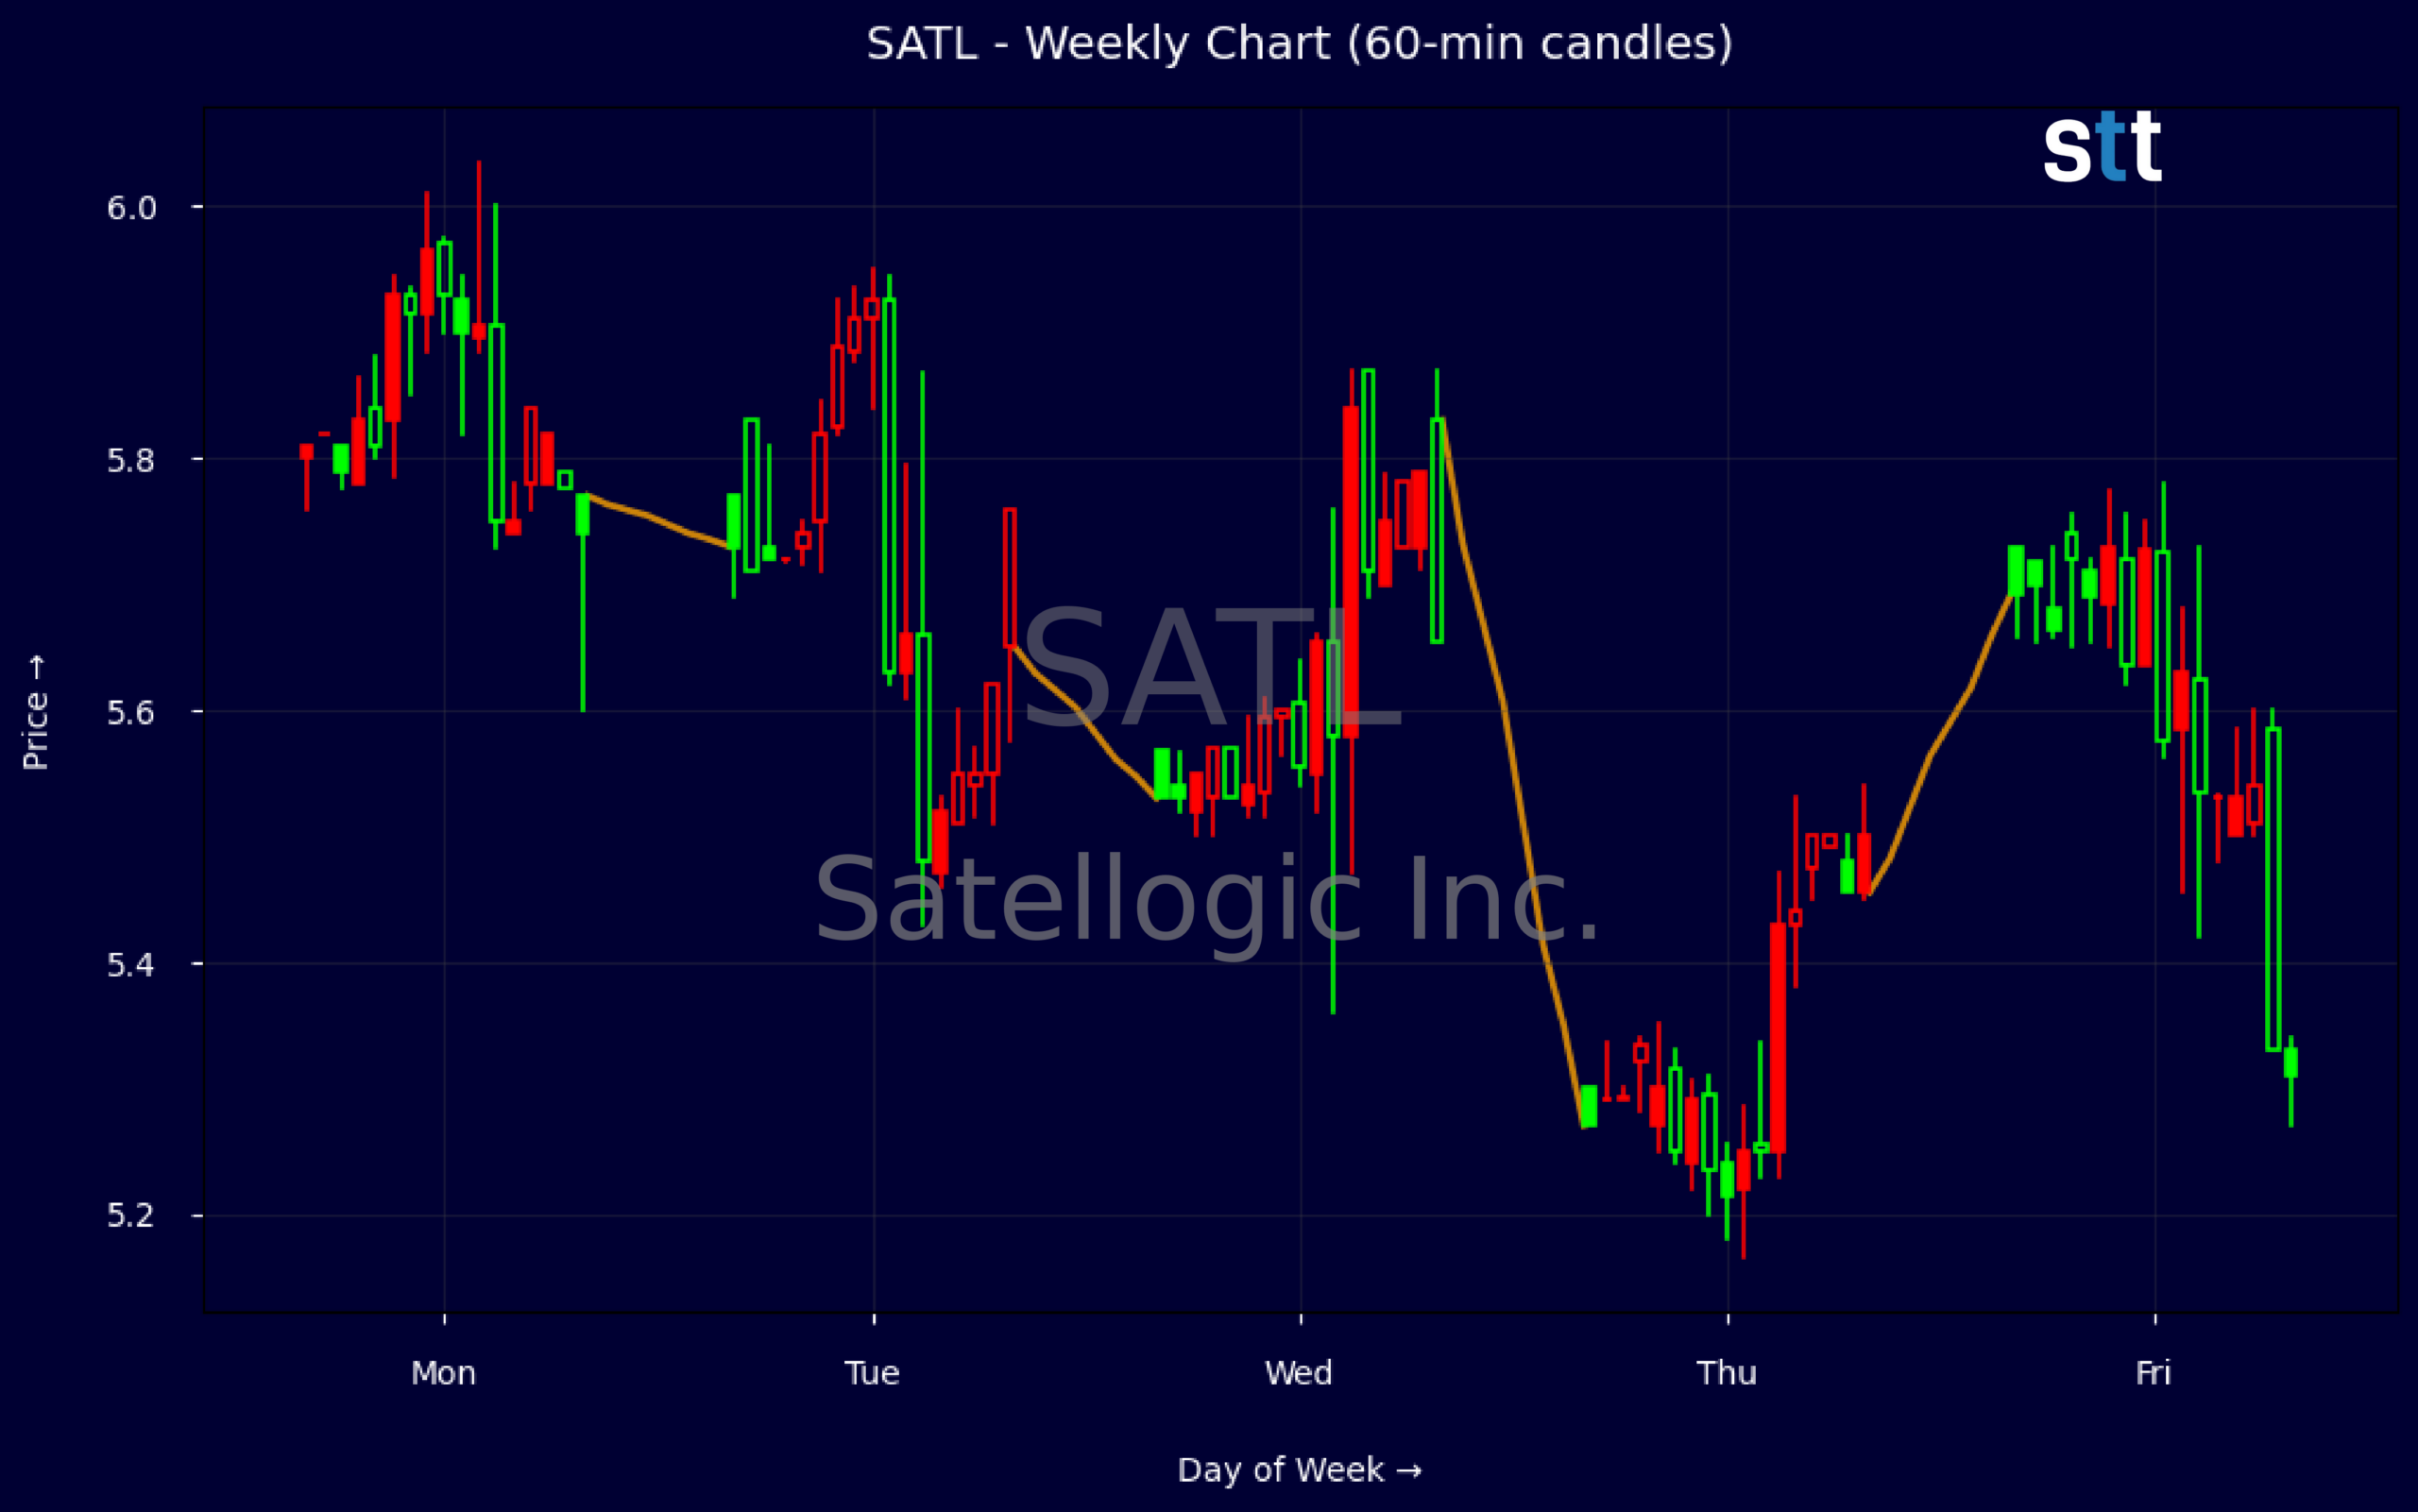
Weekly Update Aug 17 – Aug 21, 2026: On Saturday, August 22, 2026 Satellogic Inc. stock [NASDAQ: SATL] is trending up by 8.11%! Discover the key drivers behind this movement as well as our expert analysis in the detailed breakdown below.
Industrials industry expert:
Analyst sentiment – positive
Satellogic occupies a niche, high‑growth position in Earth observation but remains fundamentally speculative. Q2 revenue of $15.9M on a TTM base of ~$17.7M and gross margin near 97% underscore strong unit economics, yet EBIT margin around –330% and free cash flow of –$14.3M highlight a capital‑hungry model. Equity is thin ($33.9M) versus $95.2M long‑term debt, leverage ratio 5.8x, and ROA of –87% signals heavy value‑destructive losses despite adequate liquidity (current ratio 2.3x).
Technically, SATL is consolidating after a brief shakeout. This week’s range (high $5.82, low $5.27) shows a failed breakdown on 8/20 to $5.27 followed by aggressive dip buying, with closes back above $5.70 and a strong finish at $5.73. Intraday 5‑minute tape shows support building near $5.50–5.55 and overhead supply into $5.80–6.00. Dominant trend is sideways to mildly bullish; actionable level: buy against $5.50 support with a stop below $5.25.
More Breaking News
- SNDG ETF Slides As Volatility Grips Short-Term Traders
- CMCSA Rises As Comcast Beats Earnings And Expands Broadband Footprint
- FDXF Stock Climbs As Price Action Attracts Momentum Traders
- Global Payments Stock Jumps As Analysts Hike Targets
Fundamentally, SATL is high beta versus Industrials and even Aerospace & Defense, but revenue growth of 259% and positive operating income/adjusted EBITDA place it ahead of most small‑cap peers on growth momentum. Street targets ($9–10) imply material upside, supported by backlog visibility, constellation expansion, and the Merlin launch plus senior hiring in sovereign space systems. Base case: accumulation zone $5.25–5.75, first resistance $6.25, secondary $7.50; 6‑12 month upside target $8 with downside support anchored at $4.75.
Quick Financial Overview
Satellogic Inc. just printed the kind of revenue growth that forces traders to pay attention. Q2 revenue jumped 259% year over year to $15.9M, well ahead of the $9.6M expectation, and gross profit of $18.7M translated into a very high 96.6% gross margin. Operating income flipped positive at $0.27M and adjusted EBITDA also turned positive, even though EPS came in at -$0.13 versus the -$0.02 estimate, keeping headline losses in focus.
Under the hood, the balance sheet shows $112.8M in cash and short-term investments against $95.2M of long-term debt, with a current ratio of 2.3. That gives Satellogic Inc. some breathing room, but metrics like a -87.4% return on assets and deeply negative free cash flow of -$14.3M highlight that the path to self-funded growth is not complete. A price-to-sales ratio near 25.5 and price-to-book above 24 tell traders this is still priced as a high-expectation story.
On the tape, SATL has been consolidating in a tight band between roughly $5.27 and $5.82 over the recent weekly data, with closes generally holding the mid-$5s. The most recent week shows a grind from about $5.27 back to the $5.70s, suggesting dip buying near the low-$5s. Intraday, a single 5-minute bar captures a push from a $5.45 open to a $5.78 high before settling near $5.72, a strong intraday reversal that fits the idea of aggressive buying after earnings momentum.
Conclusion
This is stock news, not investment advice. StocksToTrade News delivers real-time stock market updates tailored to highlight the key catalysts driving short-term price movements. Our coverage is designed for active traders and investors who thrive in fast-moving markets, with a focus on volatile sectors like penny stocks, AI stocks, Robinhood stocks and other momentum plays. From earnings reports and FDA approvals to mergers, new contracts, and unusual trading volume, we break down the events that can spark significant price action.
Looking to level up your trading game? Explore StocksToTrade, the ultimate platform for traders. With powerful tools designed for swing and day trading, integrated news scanning, and even social media monitoring, StocksToTrade keeps you one step ahead.
Check out our quick startup guide for new traders!
- How to Read Stock Charts: A Guide for Beginners
- Trading Plan: 6 Steps to Create One
- How To Create a Stock Watchlist
Ready to build your watchlists? Check out these curated lists:
Once your watchlist is set, take the next step and trade with confidence using StocksToTrade’s robust platform. Don’t miss out — grab your 14-day trial for just $7 and experience the edge you need to thrive in today’s fast-paced markets.