

rYojbaba Co. Ltd. surges as blockbuster contract win fuels optimism, with stocks have been trading up by 104.48 percent.
Market Insights For RYOJ Traders
- Intraday action shows an extreme spike from the low $2s to over $8 before closing near $5, signaling aggressive speculative interest.
- Weekly chart for RYOJ shows a sharp run from under $2 to above $5, followed by a pullback to the low $4s.
- Recent candles highlight wide trading ranges, suggesting elevated risk but also strong short-term opportunity for active traders.
- Balance sheet for rYojbaba Co. Ltd. carries solid cash relative to total assets, which can support operations through volatility.
- Valuation ratios such as price-to-sales and price-to-book signal a market that is already pricing in meaningful growth expectations.
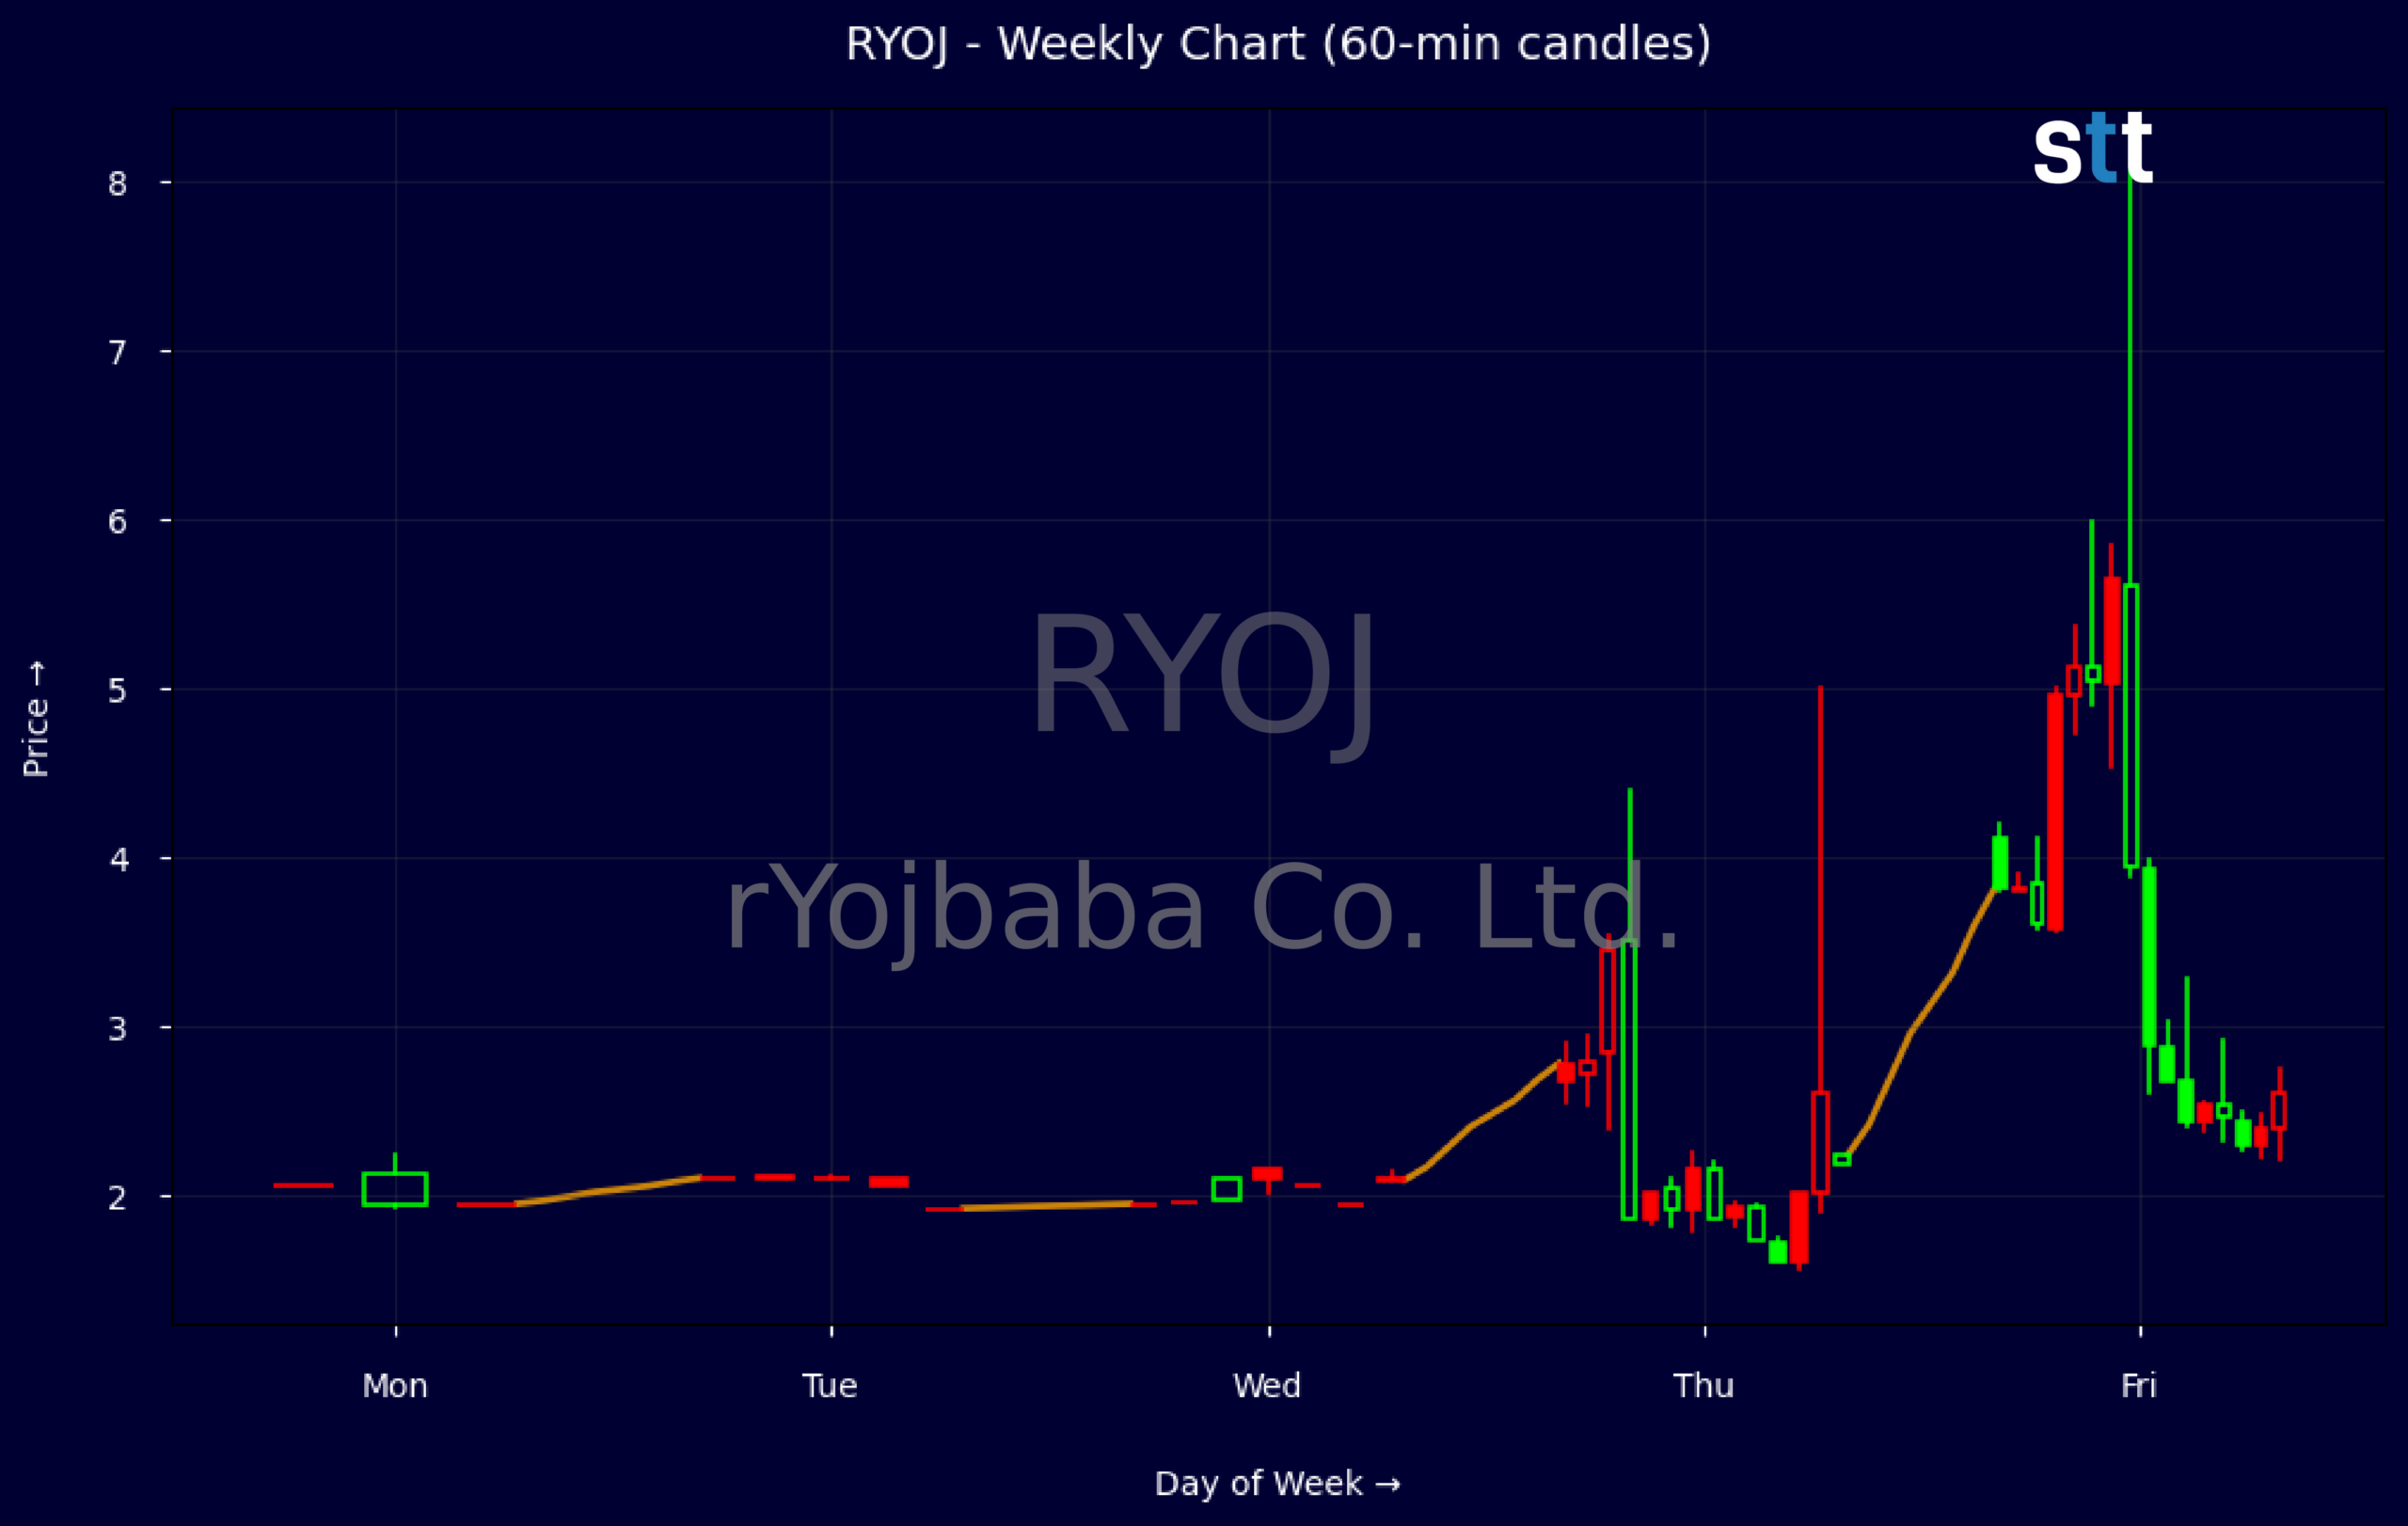
Weekly Update May 18 – May 22, 2026: On Sunday, May 24, 2026 rYojbaba Co. Ltd. stock [NASDAQ: RYOJ] is trending up by 104.48%! Discover the key drivers behind this movement as well as our expert analysis in the detailed breakdown below.
Healthcare industry expert:
Analyst sentiment – positive
RYOJ sits as a small-cap healthcare provider with modest scale (revenue ≈ $9.3m; P/S 2.49; EV ≈ $55m) but reasonably solid capitalization. Book value per share of $0.53 and price-to-book of 3.81 imply the market is discounting above-average growth or margin expansion despite currently thin or volatile profitability metrics. Balance sheet quality is acceptable: cash of $6.2m, working capital of $4.8m, and leverage ratio of 2.8 with long-term debt at 0.34 of capital.
Technically, RYOJ has transitioned from a tight base around ¥1.95–2.10 into a sharp momentum breakout, with the weekly close at 4.11 after a high of 5.00. The dominant trend is now firmly bullish, with evidence of aggressive buying and likely volume expansion on the 2.78→5.00 run. A clear actionable level is support at 3.00–3.10; as long as price holds above this zone on pullbacks, the long bias remains intact.
More Breaking News
- REGN Stock Climbs As Libtayo Data And Targets Rise
- CDE Stock Pullback Has Active Metals Traders On Watch
- Global Payments Stock Climbs As Analysts Bet On Worldpay Upside
- Global Payments Stock Jumps As Analysts Hike Targets
Near-term, there are no discrete company-specific news catalysts, so trading will be driven by technical momentum and sector sentiment. Relative to broader Healthcare and Healthcare Providers & Services benchmarks, RYOJ trades richer on sales and book multiples, reflecting speculative growth expectations rather than proven returns. Upside targets cluster around 5.00–5.50 as resistance, with strong downside support at 3.00. Verdict: cautiously positive, favoring tactical long positions above 3.00 with tight risk controls.
Quick Financial Overview
rYojbaba Co. Ltd. (RYOJ) shows a clear volatility ramp in the weekly data. Price moved from about 1.95 to over 5 within a few weeks, with the most recent weekly close around 4.11 after a high near 5. This kind of fast expansion followed by a pullback often marks the transition from early breakout to consolidation, where traders reassess risk and reward.
On the intraday side, the 5-minute candle with a range from roughly 2.43 to 8.10 and a close near 5 underscores how aggressively RYOJ can move within a single session. That type of bar usually reflects either a major liquidity event or concentrated speculative trading, and it warns short-term traders that slippage and gap risk are real. For day traders, this is the kind of tape where position size and hard stops matter more than usual.
Financially, rYojbaba Co. Ltd. posts revenue of about $9.34M, with an enterprise value near $55.11M and a price-to-sales ratio of 2.49. A price-to-book of 3.81 on a book value per share of 0.53 shows the market is paying a premium over the company’s accounting value, which is common in growth or speculative names. The balance sheet lists total assets of about $16.92M, equity near $6.09M, and cash and equivalents around $6.16M, giving RYOJ meaningful liquidity versus current liabilities of roughly $2.84M. A leverage ratio of 2.8 and long-term debt around $3.13M mean traders should track how future cash flow supports that capital structure.
Conclusion
This is stock news, not investment advice. StocksToTrade News delivers real-time stock market updates tailored to highlight the key catalysts driving short-term price movements. Our coverage is designed for active traders and investors who thrive in fast-moving markets, with a focus on volatile sectors like penny stocks, AI stocks, Robinhood stocks and other momentum plays. From earnings reports and FDA approvals to mergers, new contracts, and unusual trading volume, we break down the events that can spark significant price action.
Looking to level up your trading game? Explore StocksToTrade, the ultimate platform for traders. With powerful tools designed for swing and day trading, integrated news scanning, and even social media monitoring, StocksToTrade keeps you one step ahead.
Check out our quick startup guide for new traders!
- How to Read Stock Charts: A Guide for Beginners
- Trading Plan: 6 Steps to Create One
- How To Create a Stock Watchlist
Ready to build your watchlists? Check out these curated lists:
Once your watchlist is set, take the next step and trade with confidence using StocksToTrade’s robust platform. Don’t miss out — grab your 14-day trial for just $7 and experience the edge you need to thrive in today’s fast-paced markets.