

rYojbaba Co. Ltd. stocks have been trading up by 104.48 percent following highly favorable sentiment from the ## Ma headlines.
Market Insights For Active Traders
- Intraday price ripped from the low $2 area to above $8, then closed near $5, signaling extreme volatility and heavy short-term interest.
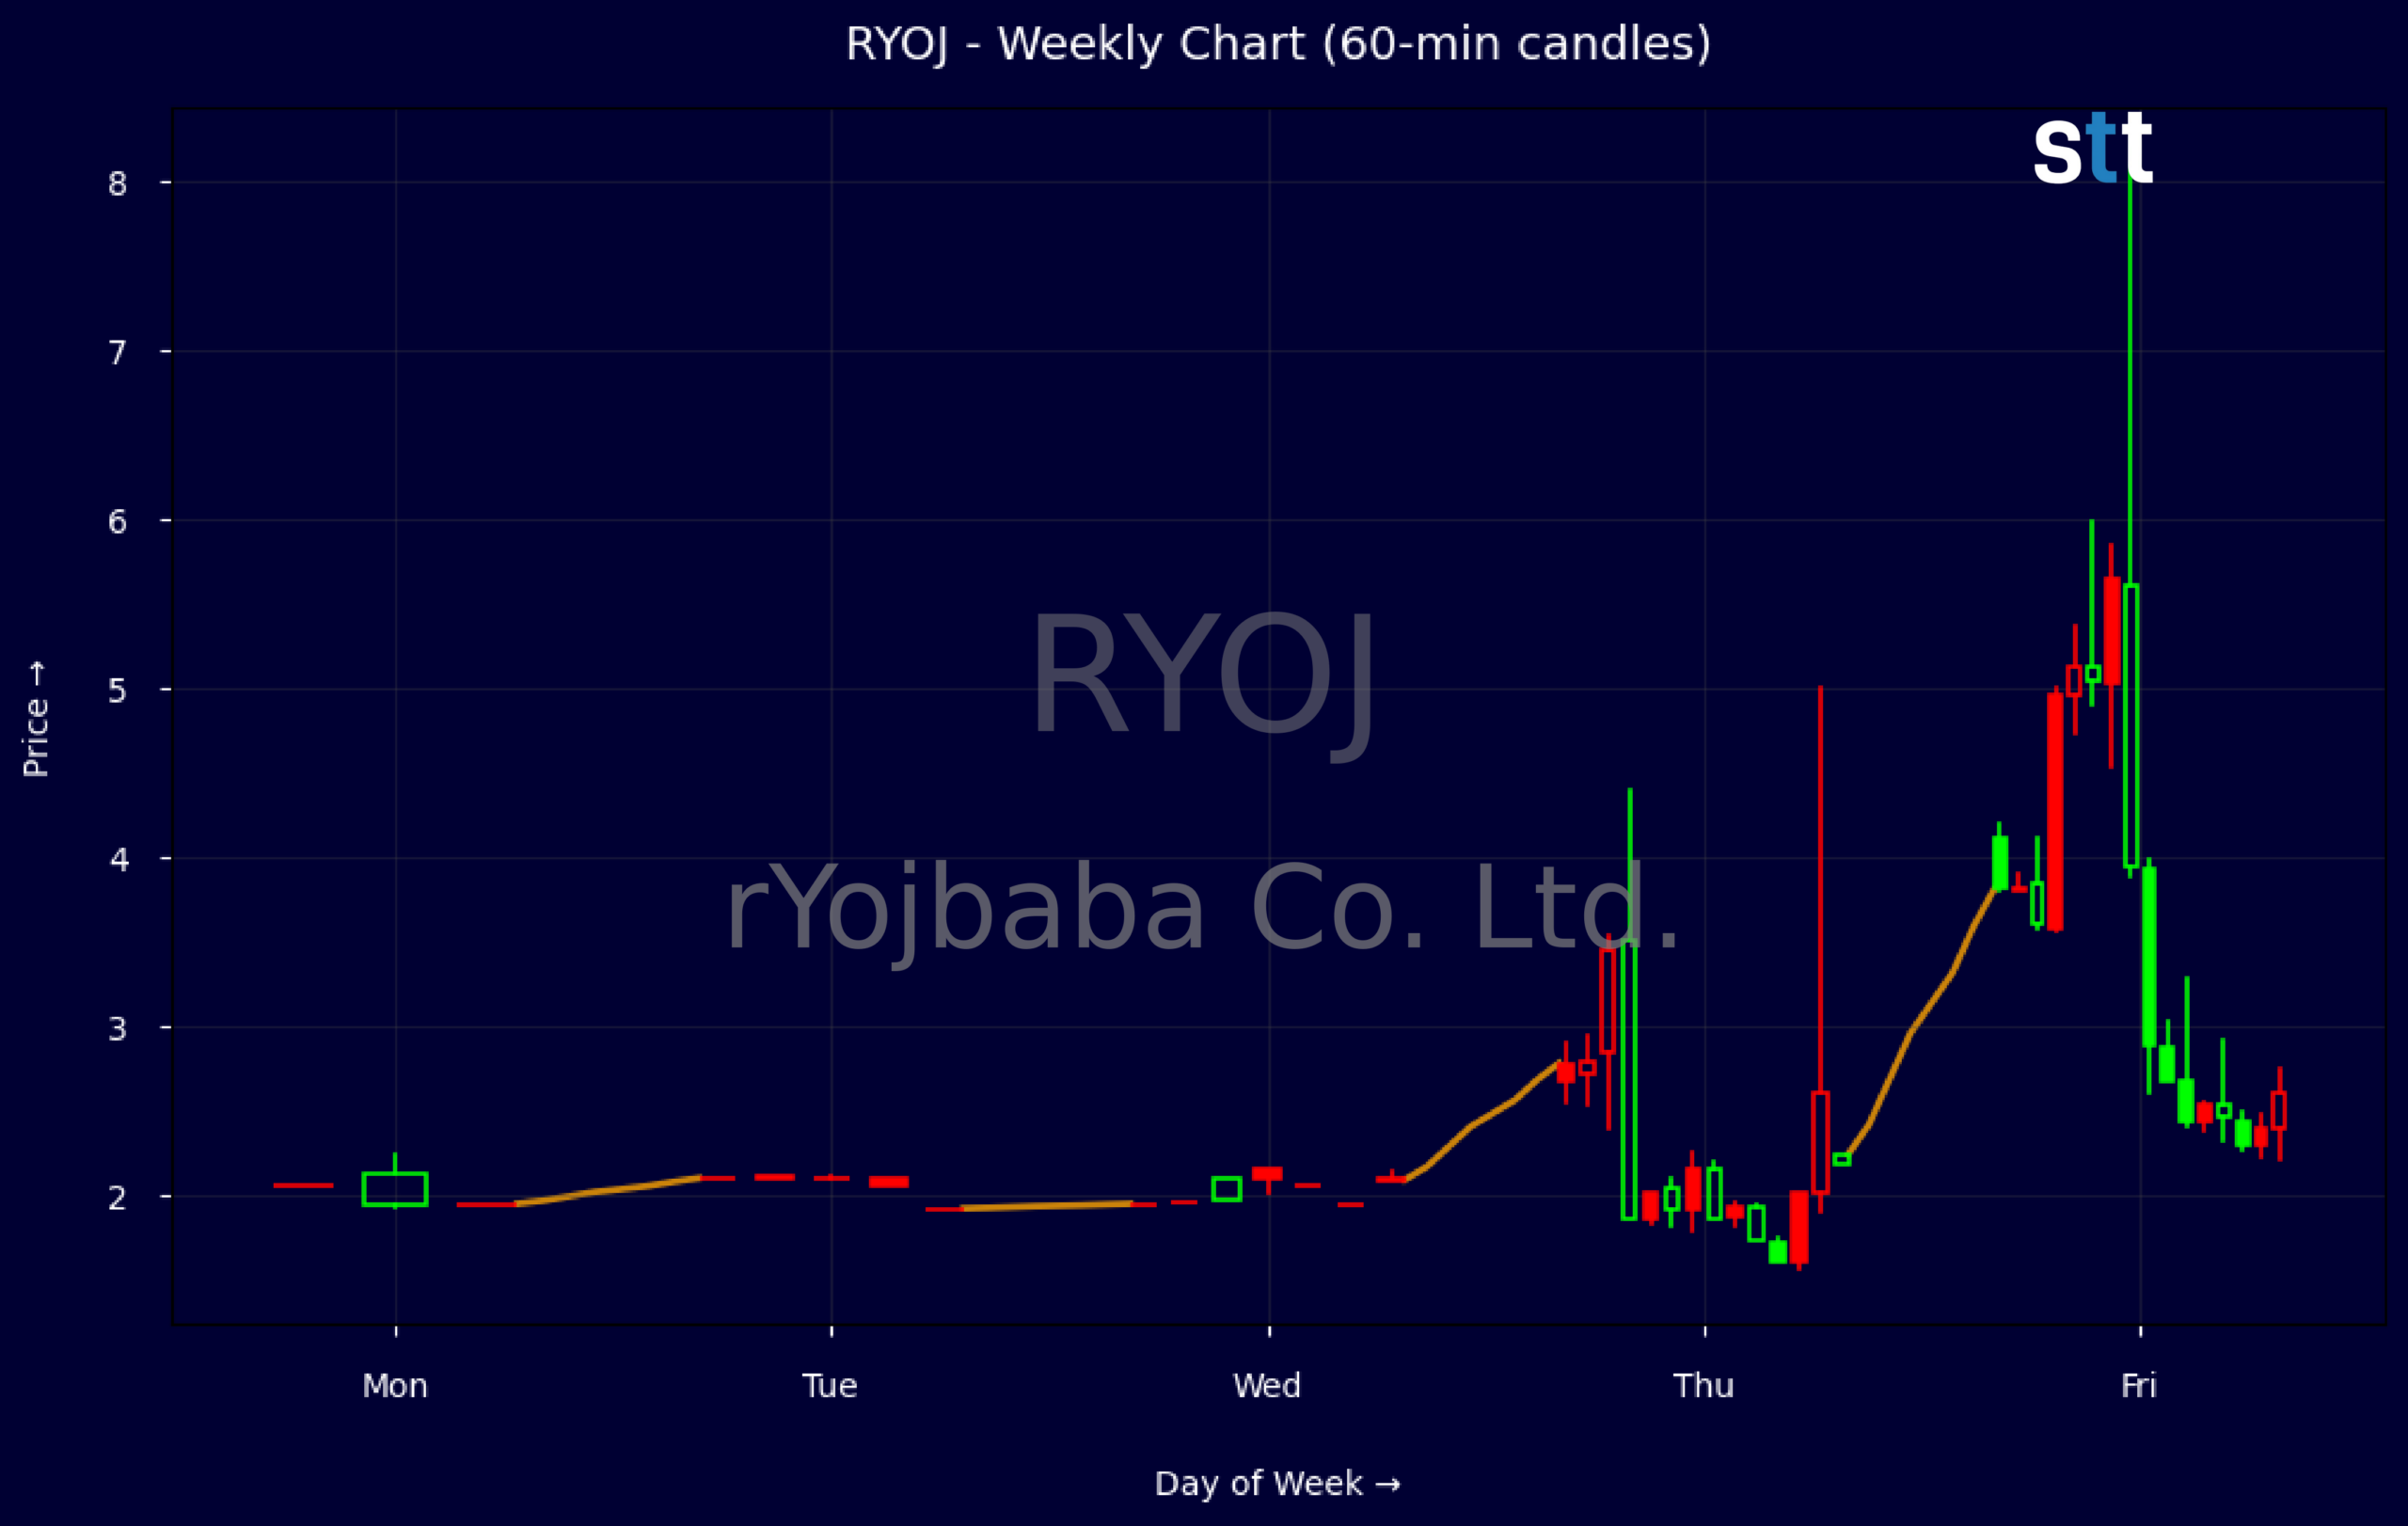
- Weekly chart shows RYOJ jumping from under $2 in early weeks to above $4, with expanding ranges and strong upside momentum.
- Valuation sits around 2.4x sales and 3.7x book value, putting rYojbaba Co. Ltd. in a growth-style pricing zone.
- Balance sheet shows solid cash and working capital, giving the company room to support operations while traders focus on price swings.
- Traders are watching whether recent explosive moves in RYOJ form a sustainable trend or fade into a sharp mean reversion.
Weekly Update May 18 – May 22, 2026: On Saturday, May 23, 2026 rYojbaba Co. Ltd. stock [NASDAQ: RYOJ] is trending up by 104.48%! Discover the key drivers behind this movement as well as our expert analysis in the detailed breakdown below.
Healthcare industry expert:
Analyst sentiment – negative
RYOJ currently screens as an early-stage, relatively high-risk healthcare name with modest scale: revenue of ~¥9.3m and price-to-sales of 2.4x imply a micro-cap valuation with limited operating leverage yet. Balance sheet quality is reasonable: cash and equivalents of ¥6.2m versus total debt (incl. leases) of ~¥3.2m, and leverage ratio of 2.8x with long-term debt-to-capital at 0.34. Returns on assets and equity are effectively flat, while ROIC at 1.27% signals underutilized capital and an immature profit model.
Technically, RYOJ has shifted from a low-volatility consolidation near ¥1.95–2.10 into a momentum breakout, with a sharp move to ¥3.01 and then ¥4.11 on expanding ranges, indicating aggressive speculative buying. The dominant trend on the weekly tape is strongly bullish, but the parabolic structure and intraday 5-minute candles likely show wide upper wicks and elevated volume, signaling short-term exhaustion. A key actionable level is ¥3.00–3.10: above it remains a long bias; a sustained break below invites a fast mean reversion toward ¥2.40–2.50.
More Breaking News
- Global Payments Stock Climbs As Analysts Hike Price Targets
- GoDaddy Stock Jumps As Q3 Beat And AI Airo Fuel Bullish Outlook
- NOK Stock Slides As Earnings Strength Fails To Impress Traders
- GoDaddy GDDY Jumps As Earnings Beat And AI Airo Shine
With no new fundamental news disclosed, the latest price spike appears sentiment- or liquidity-driven rather than anchored in improving cash flows or margins, contrasting with steadier Healthcare and Providers & Services benchmarks that typically trade on earnings momentum and utilization trends. Near term, I expect high volatility and event sensitivity. Support sits at ¥3.00 and then ¥2.40, with resistance at ¥4.20–4.50. Base-case fair value skews closer to ¥2.50–3.00 until profitability and ROIC inflect decisively higher.
Quick Financial Overview
RYOJ has shifted from quiet trading to aggressive expansion in price range. The weekly candles show a clean acceleration: from about $1.95 to $2.10, then a brief dip, followed by a surge to a $3.01 close, and finally a push into the low-$4 range. That pattern tells traders that demand has stepped up, but it has also raised the risk level as each week’s range has widened.
The intraday snapshot is even more intense. Price opened around $2.43, tagged an intraday high above $8, and then settled near $5. That type of move in a single session is often driven by fast money, forced covering, and momentum traders crowding in. For short-term traders, this means wide spreads, rapid swings, and the need to size smaller and manage risk tightly.
Fundamentals for rYojbaba Co. Ltd. show a company with roughly $9.34M in revenue, trading at about 2.42x sales and 3.71x book value. Total assets are near $16.9M with cash of about $6.16M, and working capital around $4.84M, which signals decent liquidity. Leverage is meaningful, with long-term debt and lease obligations notable, but equity of roughly $6.09M and a leverageratio of 2.8 suggest the capital structure is still manageable. For traders, that mix supports a story where aggressive price action is backed by a business that has some financial runway.
Conclusion
This is stock news, not investment advice. StocksToTrade News delivers real-time stock market updates tailored to highlight the key catalysts driving short-term price movements. Our coverage is designed for active traders and investors who thrive in fast-moving markets, with a focus on volatile sectors like penny stocks, AI stocks, Robinhood stocks and other momentum plays. From earnings reports and FDA approvals to mergers, new contracts, and unusual trading volume, we break down the events that can spark significant price action.
Looking to level up your trading game? Explore StocksToTrade, the ultimate platform for traders. With powerful tools designed for swing and day trading, integrated news scanning, and even social media monitoring, StocksToTrade keeps you one step ahead.
Check out our quick startup guide for new traders!
- How to Read Stock Charts: A Guide for Beginners
- Trading Plan: 6 Steps to Create One
- How To Create a Stock Watchlist
Ready to build your watchlists? Check out these curated lists:
Once your watchlist is set, take the next step and trade with confidence using StocksToTrade’s robust platform. Don’t miss out — grab your 14-day trial for just $7 and experience the edge you need to thrive in today’s fast-paced markets.