
Robin Energy Ltd. stocks have been trading up by 166.47 percent amid strong investor optimism on robust renewable project wins.
Click Here for a Millionaire's POV on Trading RBNE
SUBSCRIBE FOR ALERTSJOIN 50,000+ ACTIVE TRADERS
Key Takeaways
- RBNE has collapsed from about $2.40 to under $0.40 in days, signaling aggressive selling and broken momentum.
- Intraday, Robin Energy Ltd. swung from $0.47 at the open to above $2.00 before fading, showing extreme volatility ideal for day trading but dangerous for chasing.
- RBNE’s balance sheet lists roughly $23.7M in cash and low liabilities, giving the company breathing room despite the stock slide.
- Valuation metrics show Robin Energy Ltd. trading at a steep discount to sales and book value, drawing value-focused traders to the tape.
- Active traders are watching whether RBNE can base above recent lows or if more forced selling is still ahead.
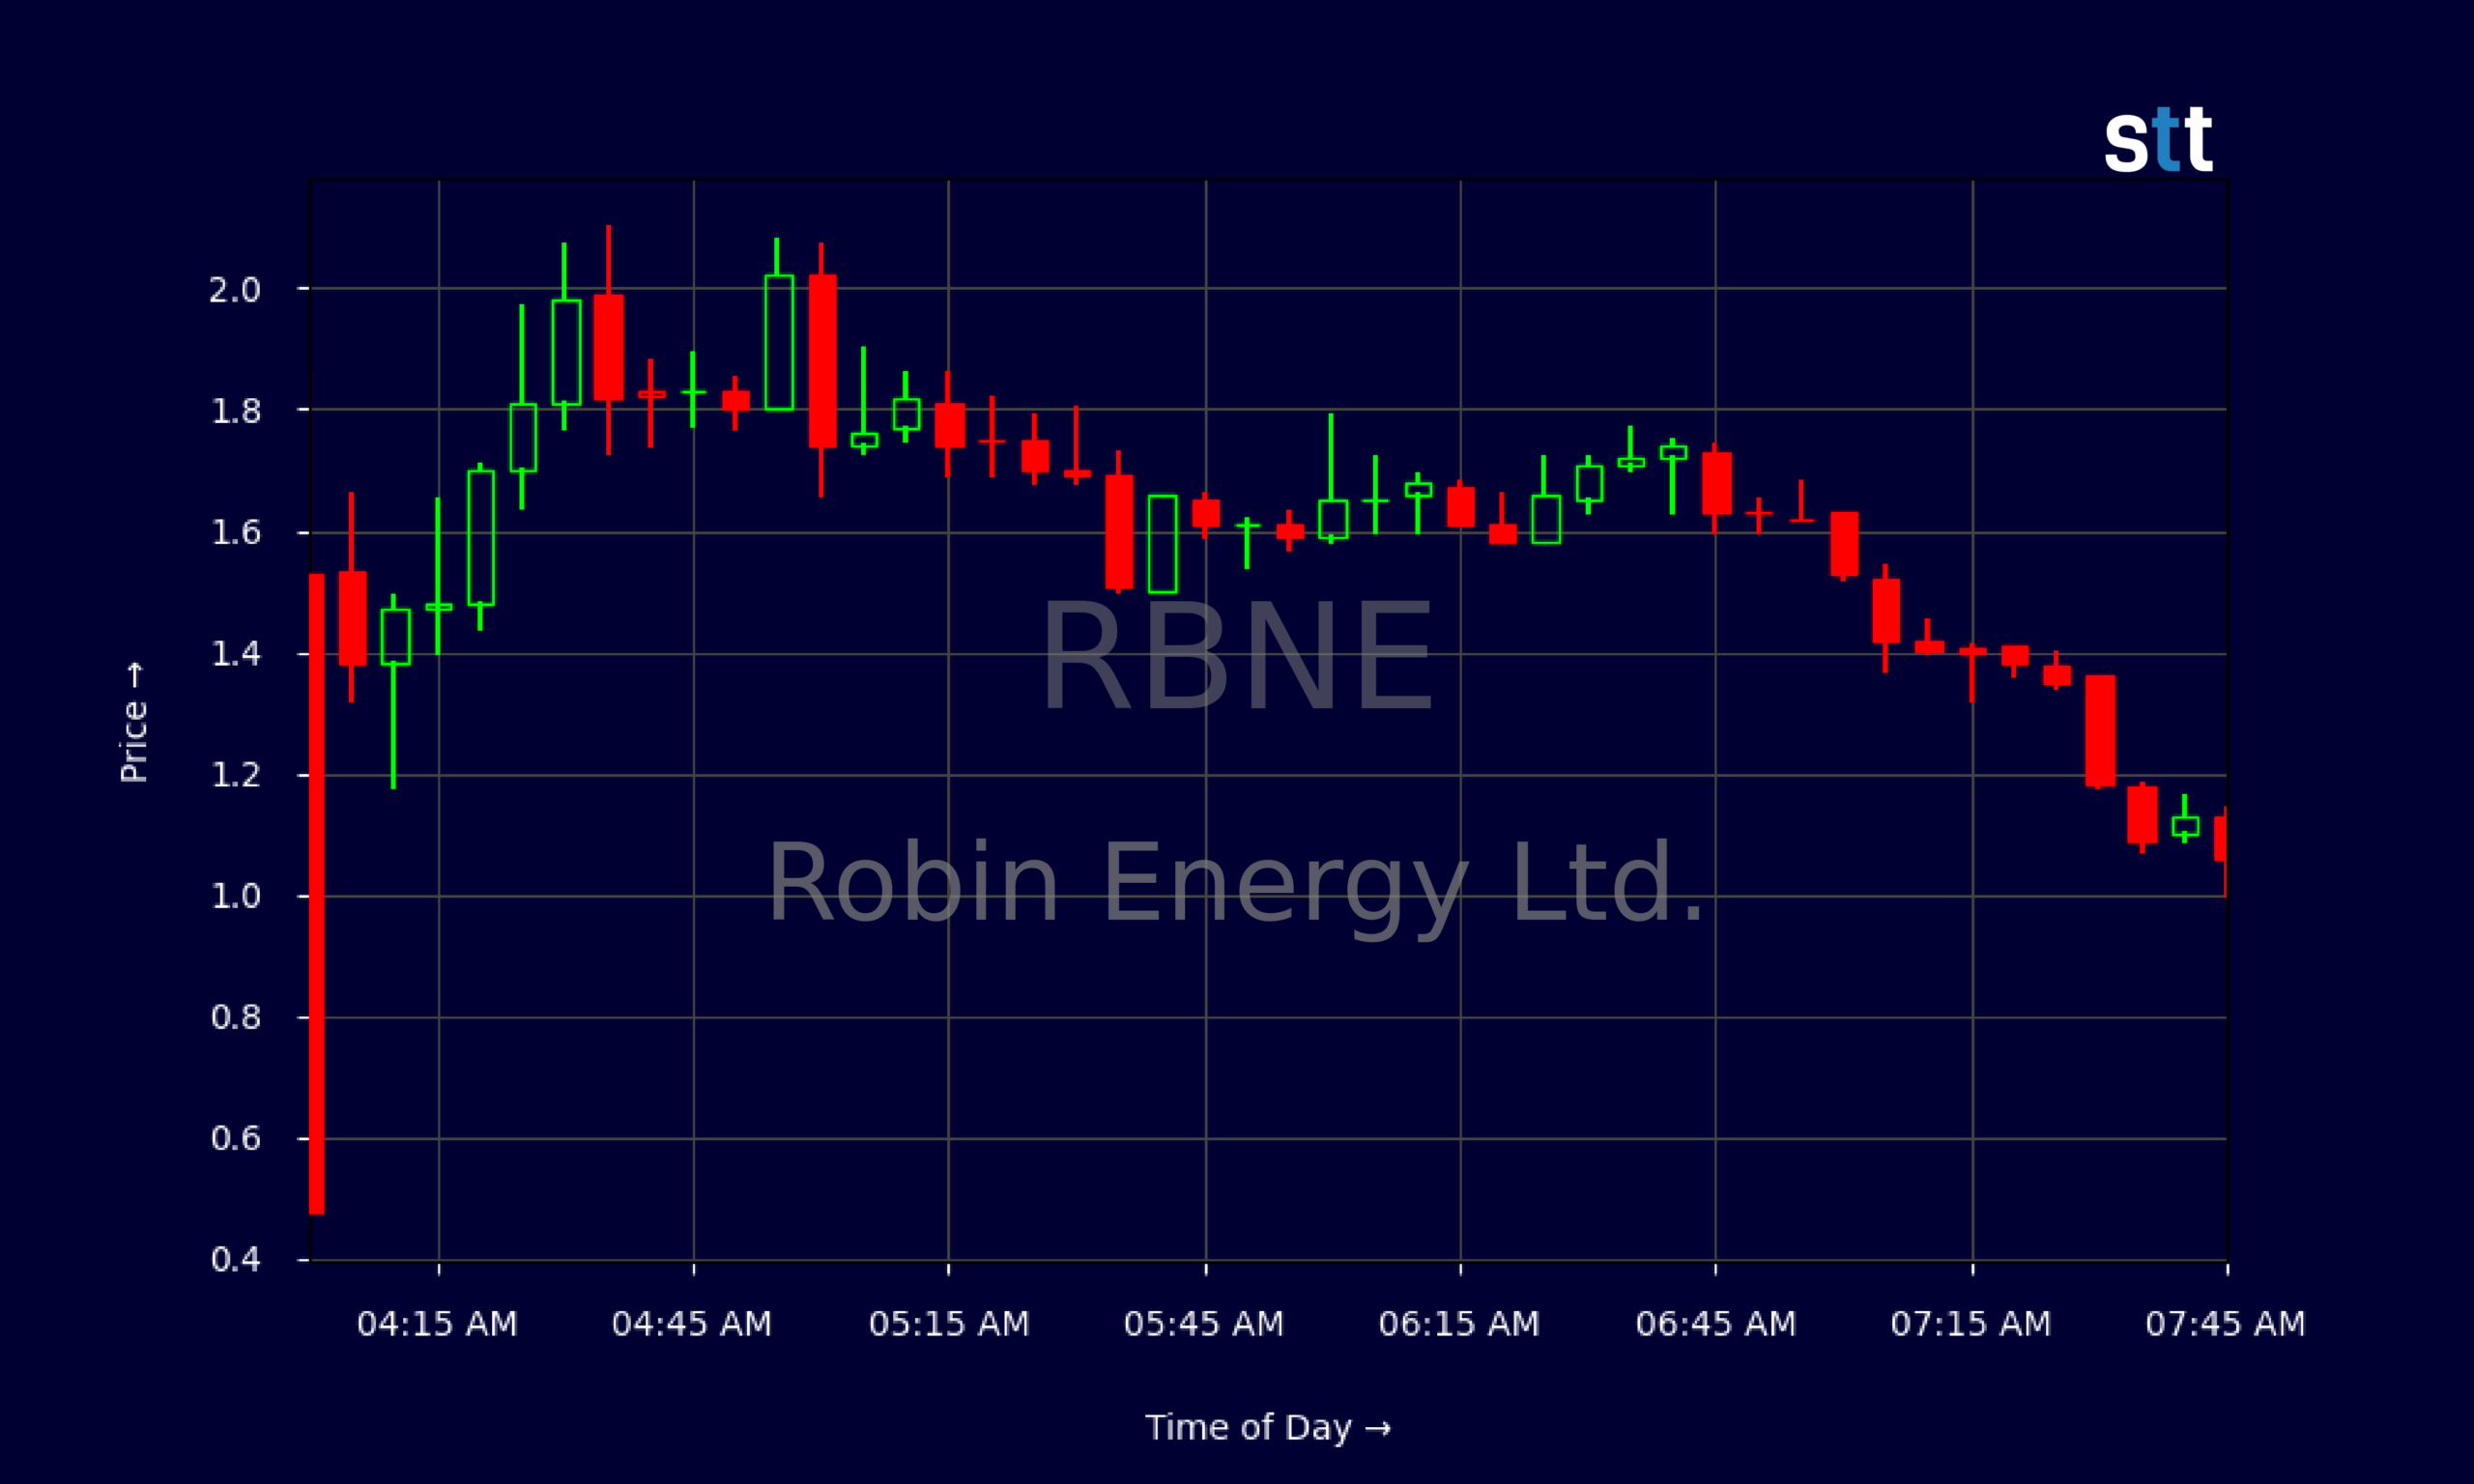
Live Update At 07:48:09 EDT: On Wednesday, October 21, 2026 Robin Energy Ltd. stock [NASDAQ: RBNE] is trending up by 166.47%! Discover the key drivers behind this movement as well as our expert analysis in the detailed breakdown below.
Quick Financial Overview
RBNE is trading like a classic low-priced momentum name that just lost its footing. On the daily chart, Robin Energy Ltd. fell from around $2.39 on 2026/09/29 to roughly $0.40 by 2026/10/20. That is an almost straight-line drop, which tells traders one thing: longs are trapped and shorts are in control for now.
Under the hood, though, RBNE’s numbers look surprisingly sturdy for such a beaten-down stock. Robin Energy Ltd. reported about $9.9M in revenue over the period, with a pretax margin of 5.7%. Net income from continuing operations came in near $525,000, and RBNE posted positive operating cash flow of about $3.9M and free cash flow around $3.8M.
More Breaking News
- OLOX Stock Volatility Draws Trader Focus After Sharp Reversal
- YMAT Stock Erupts As Houston Carbon-Fiber Plan Ignites Volume
- SPCX Stock Climbs As Starlink Mobile And AI Bets Accelerate
- Intel Stock Climbs As AI Bets And Terafab Jitters Collide
The balance sheet is even more striking. Robin Energy Ltd. shows total assets of roughly $74.1M, equity of about $71.0M, and cash of roughly $23.7M. Debt is minimal relative to equity, with a leverageratio of 1.6 and long-term debt effectively at zero. Valuation-wise, RBNE trades at around 0.55x sales and only 0.07x book value, metrics that screen as “deep discount” on many scanners. For traders, that mix of brutal chart and strong balance sheet often sets up either high-conviction breakdowns or sharp mean-reversion bounces.
Why Traders Are Watching RBNE’s Wild Price Swings
The chart is where RBNE really grabs attention. Robin Energy Ltd. spent late September grinding between roughly $2.30 and $2.40, a slow, steady range that suggested stability. Then the floor gave way. By 2026/10/16, RBNE had already slid to $0.78 from $1.82 open levels, and by 2026/10/20 it printed a low near $0.35 and closed just under $0.40. That is a near-telegraphed collapse.
Intraday data shows the same chaos at a finer scale. On the most recent session, RBNE opened around $0.47 at 04:00, then ripped to the $2.00+ area within the first hour. Robin Energy Ltd. hit highs near $2.07–$2.10, then faded step-by-step as sellers unloaded into strength, closing intraday candles progressively lower into the $1.00–$1.10 zone and eventually back under that. For active day traders, those 200–300% swings in a single morning are both opportunity and trap.
This type of action in RBNE usually comes when momentum traders crowd in, liquidity spikes, and then the air pockets appear once demand dries up. Robin Energy Ltd. still has real revenue, positive cash flow, and about $23.7M in cash in the bank, which keeps it on the radar of both momentum and fundamentals-focused traders. But the key technical takeaway is that RBNE has broken its prior support levels. Until Robin Energy Ltd. can hold a higher low and prove it can sustain bids, every bounce is suspect and every spike is a potential short entry for disciplined traders.
Conclusion
For Robin Energy Ltd., the story right now is simple: the fundamentals look better than the chart. RBNE trades at roughly 0.55x sales and only 0.07x book value, while showing positive earnings and solid free cash flow. Cash of around $23.7M versus modest liabilities gives RBNE room to operate, even as its share price gets punished. Many penny names do not have that kind of balance sheet strength.
But traders do not get paid on balance sheets alone. They trade price. And RBNE’s price action is telling a clear story of broken momentum, trapped longs, and short-term uncertainty. Robin Energy Ltd. has seen violent intraday spikes from under $0.50 to over $2.00, only to give most of it back by the close. That is classic “hot potato” price action, where speed and discipline matter more than opinions. This is where trading mindset really matters. As Tim Bohen, lead trainer with StocksToTrade says, “I focus on what a stock is doing, not what I want it to do. Let the stock prove itself before you make a move.” That kind of rule-based approach fits perfectly with a name like RBNE, where reacting to the price action beats trying to predict it.
For now, RBNE belongs on watchlists, not blind conviction lists. As Tim Sykes likes to say, “The market doesn’t care about what you think it ‘should’ do — it only cares about supply and demand right now.” Traders studying Robin Energy Ltd. should map the recent highs and lows, size down, and respect the volatility. This content is for educational and research purposes only and is not trading advice; each trader must make their own decisions and manage risk accordingly.
This is stock news, not investment advice. StocksToTrade News delivers real-time stock market updates tailored to highlight the key catalysts driving short-term price movements. Our coverage is designed for active traders and investors who thrive in fast-moving markets, with a focus on volatile sectors like penny stocks, AI stocks, Robinhood stocks and other momentum plays. From earnings reports and FDA approvals to mergers, new contracts, and unusual trading volume, we break down the events that can spark significant price action.
Looking to level up your trading game? Explore StocksToTrade, the ultimate platform for traders. With powerful tools designed for swing and day trading, integrated news scanning, and even social media monitoring, StocksToTrade keeps you one step ahead.
Check out our quick startup guide for new traders!
- How to Read Stock Charts: A Guide for Beginners
- Trading Plan: 6 Steps to Create One
- How To Create a Stock Watchlist
Ready to build your watchlists? Check out these curated lists:
Once your watchlist is set, take the next step and trade with confidence using StocksToTrade’s robust platform. Don’t miss out — grab your 14-day trial for just $7 and experience the edge you need to thrive in today’s fast-paced markets.