
Robin Energy Ltd. could see heightened investor interest after its most impactful news, as stocks have been trading up by 158.92 percent
Click Here for a Millionaire's POV on Trading RBNE
SUBSCRIBE FOR ALERTSJOIN 50,000+ ACTIVE TRADERS
Key Takeaways
- RBNE has crashed from the $2.30s to under $0.40 in days, signaling a broken short-term trend and heavy selling pressure.
- Robin Energy Ltd. shows strong cash of about $23.7M against only $3.2M in liabilities, giving the company breathing room.
- Valuation on RBNE is extremely low, with price-to-sales near 0.55 and price-to-book around 0.07, attracting deep-value swing traders.
- Intraday RBNE action shows wild spikes from $0.47 to nearly $2.00 in one session, ideal for momentum day trading if risk is controlled.
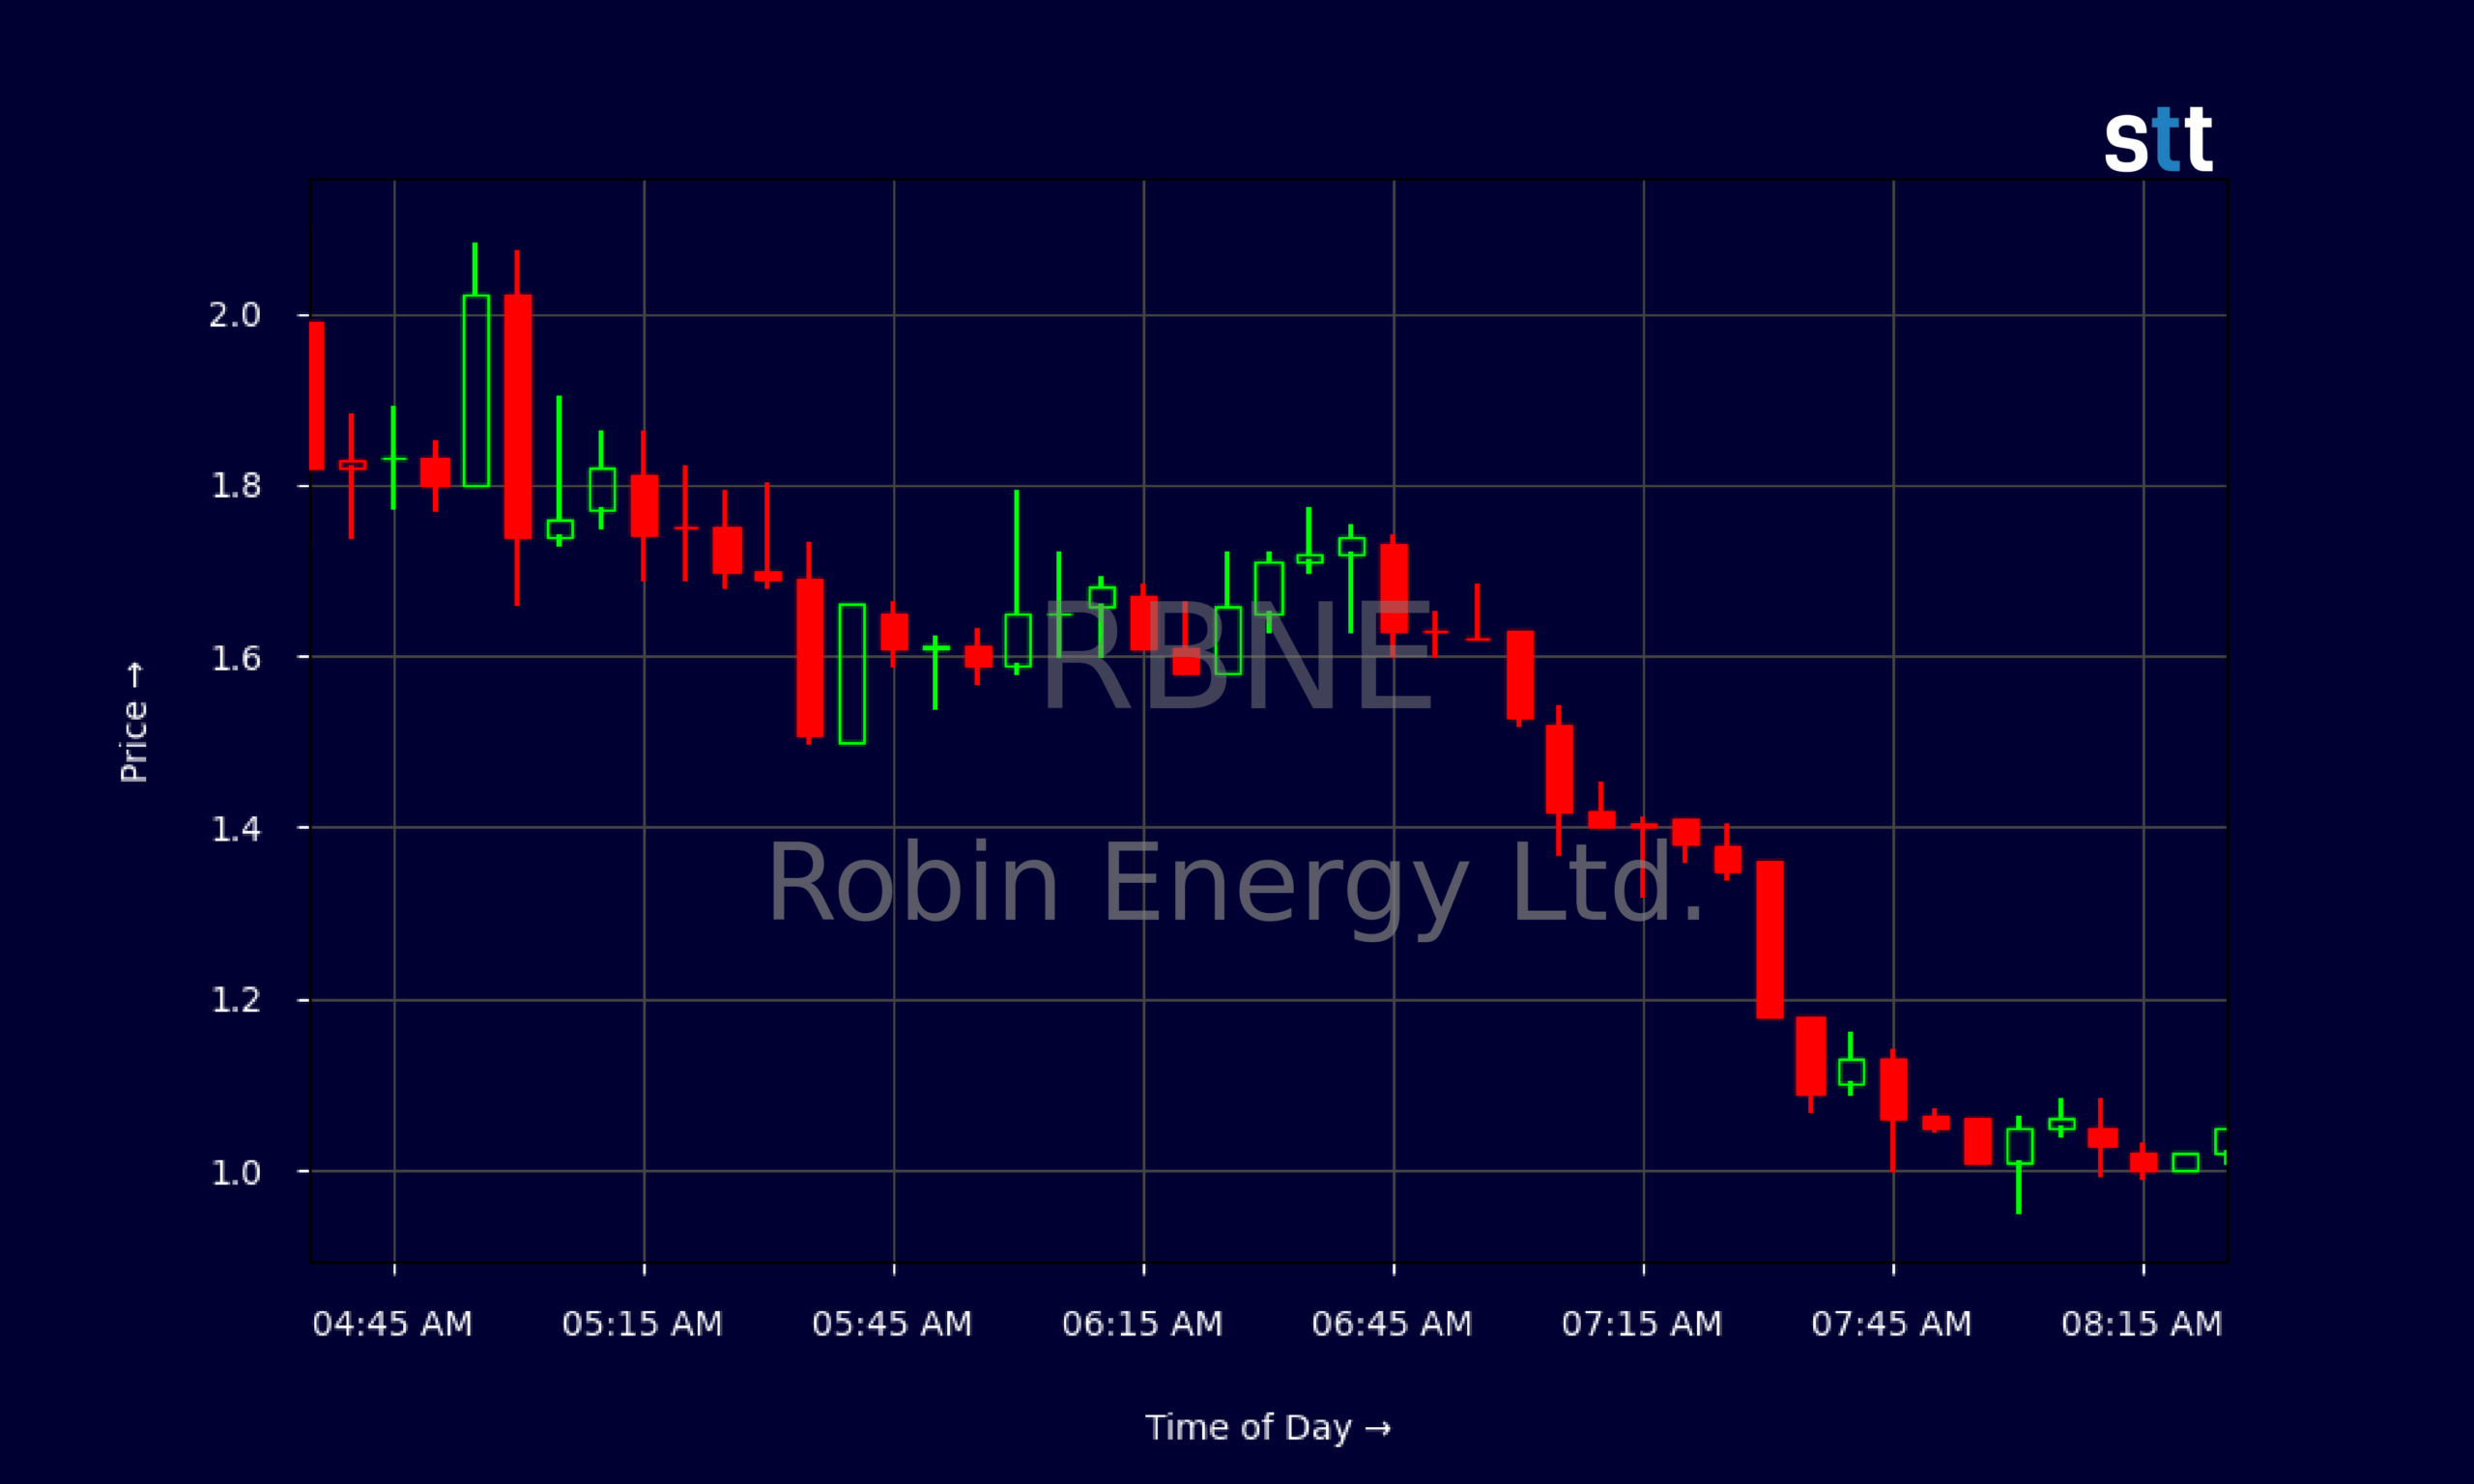
Live Update At 08:32:12 EDT: On Wednesday, October 21, 2026 Robin Energy Ltd. stock [NASDAQ: RBNE] is trending up by 158.92%! Discover the key drivers behind this movement as well as our expert analysis in the detailed breakdown below.
Quick Financial Overview
RBNE is trading like a rollercoaster, but Robin Energy Ltd.’s numbers show a business with real assets and cash behind the ticker. Recent revenue is about $9.9M, with pretax profit margin near 5.7%. That tells traders RBNE is not just a story stock; it is actually generating sales and staying slightly profitable.
The balance sheet is a key edge here. Robin Energy Ltd. reports roughly $23.7M in cash against only about $3.2M in total liabilities. Working capital sits near $29.6M, and total assets approach $74.1M. For a small-cap name, that is serious cash runway. RBNE also carries a book value per share around 33.84, while the market prices the stock at just a fraction of that, reflected in a price-to-book near 0.07.
More Breaking News
- SAIQ Stock Rockets On Nasdaq Debut As Funding And QSOC Deal Set The Stage
- INVE Stock Holds Cash-Heavy Ground As Traders Map Next Move
- SPCH Stock Pulls Back As Volatility Grips Leveraged Trade
- Intel Stock Climbs As AI Bets And Terafab Jitters Collide
Cash flow is another plus for traders studying RBNE. Operating cash flow of roughly $3.9M and free cash flow above $3.8M mean Robin Energy Ltd. is bringing in real money, not just printing shares. At the same time, leverage is modest, with a leverage ratio of 1.6 and no long-term debt-to-capital. On paper, RBNE looks more like a battered value play than a bankruptcy candidate.
Why Traders Are Watching RBNE Price Action
Where RBNE really stands out is the chart. Robin Energy Ltd. traded in the $2.30–$2.40 range as recently as late September. Then the floor gave way. Over a few sessions, RBNE slid from the low $2.00s into the $0.70s, then flushed again to close around $0.40 on the latest daily candle. That is an almost 80% drawdown in a blink, the sort of move that momentum traders stalk every day.
The intraday 1‑day chart makes it even clearer. RBNE opened sub-$0.50, then ripped as high as about $1.86 in the same session. From there, Robin Energy Ltd. swung wildly between $1.40 and $2.10 in the premarket and early hours, before fading into a heavy grind lower. Later candles show RBNE chopping around $1.00–$1.30, then slipping back toward $1.00. For traders, that means spreads, slippage, and emotional pressure are all elevated.
This behavior is classic for a small-cap name where sentiment flipped hard. RBNE went from steady $2.20–$2.40 closes to a waterfall, trapping late longs and giving shorts huge range. Yet, with Robin Energy Ltd. still showing cash, positive EBITDA, and meaningful revenue, RBNE remains attractive as a potential bounce candidate once selling exhausts.
Active traders studying RBNE will focus on key intraday levels around $1.00, $1.50, and the prior daily support near $0.70. Those zones mark where Robin Energy Ltd. has seen heavy volume and emotional pivots. If volume ramps again, RBNE can deliver big percentage moves both ways in minutes, rewarding disciplined pattern traders and punishing anyone who overstays a setup.
Conclusion
RBNE is a textbook example of why chart-focused traders track fundamentals but trade price. On one hand, Robin Energy Ltd. shows real revenue near $9.9M, positive net income around $525,000, and solid free cash flow with more than $23M in cash. Valuation metrics, including a price-to-sales ratio near 0.55 and price-to-book about 0.07, suggest RBNE is priced for deep pessimism.
On the other hand, the market is speaking loudly through the chart. RBNE has broken down from a stable $2‑plus channel into a sub-$1 battleground, with intraday spikes above $1.80 and fades back toward $1.00 and below. That kind of whipsaw action around Robin Energy Ltd. tells traders emotions, forced liquidations, and short-term speculation are driving the tape right now.
For active traders, RBNE offers both opportunity and danger. The opportunity is in the huge daily range and strong liquidity around key psychological levels. The danger is chasing Robin Energy Ltd. moves without a clear plan, stop, and risk size. As Tim Bohen, lead trainer with StocksToTrade says, “For me, trading is more about managing risk than finding the next big mover.” That mindset lines up with another classic reminder from Tim Sykes, who always says, “The market doesn’t owe you anything — it just rewards preparation and discipline.” RBNE fits those lessons perfectly: study the chart, respect the volatility, and remember this is educational and research content, not a signal to buy or sell.
This is stock news, not investment advice. StocksToTrade News delivers real-time stock market updates tailored to highlight the key catalysts driving short-term price movements. Our coverage is designed for active traders and investors who thrive in fast-moving markets, with a focus on volatile sectors like penny stocks, AI stocks, Robinhood stocks and other momentum plays. From earnings reports and FDA approvals to mergers, new contracts, and unusual trading volume, we break down the events that can spark significant price action.
Looking to level up your trading game? Explore StocksToTrade, the ultimate platform for traders. With powerful tools designed for swing and day trading, integrated news scanning, and even social media monitoring, StocksToTrade keeps you one step ahead.
Check out our quick startup guide for new traders!
- How to Read Stock Charts: A Guide for Beginners
- Trading Plan: 6 Steps to Create One
- How To Create a Stock Watchlist
Ready to build your watchlists? Check out these curated lists:
Once your watchlist is set, take the next step and trade with confidence using StocksToTrade’s robust platform. Don’t miss out — grab your 14-day trial for just $7 and experience the edge you need to thrive in today’s fast-paced markets.