
QXO Inc. stocks have been trading down by -7.04 percent amid heightened investor concern over its latest strategic restructuring news.
Click Here for a Millionaire's POV on Trading QXO
SUBSCRIBE FOR ALERTSJOIN 50,000+ ACTIVE TRADERS
Key Takeaways
- Shares of QXO have faded from the $12 area to near $10, showing steady selling pressure over the past few weeks.
- Recent QXO intraday trading shows a tight consolidation around $10 with lower volatility, hinting at a wait-and-see mindset from traders.
- QXO is growing revenue fast but still posts losses, with negative profit margins and red EPS.
- The balance sheet shows QXO holding over $5B in cash while carrying sizable long-term debt, giving runway but raising leverage questions.
- Active traders are watching whether QXO can hold the $10 zone or breaks down toward prior support levels.
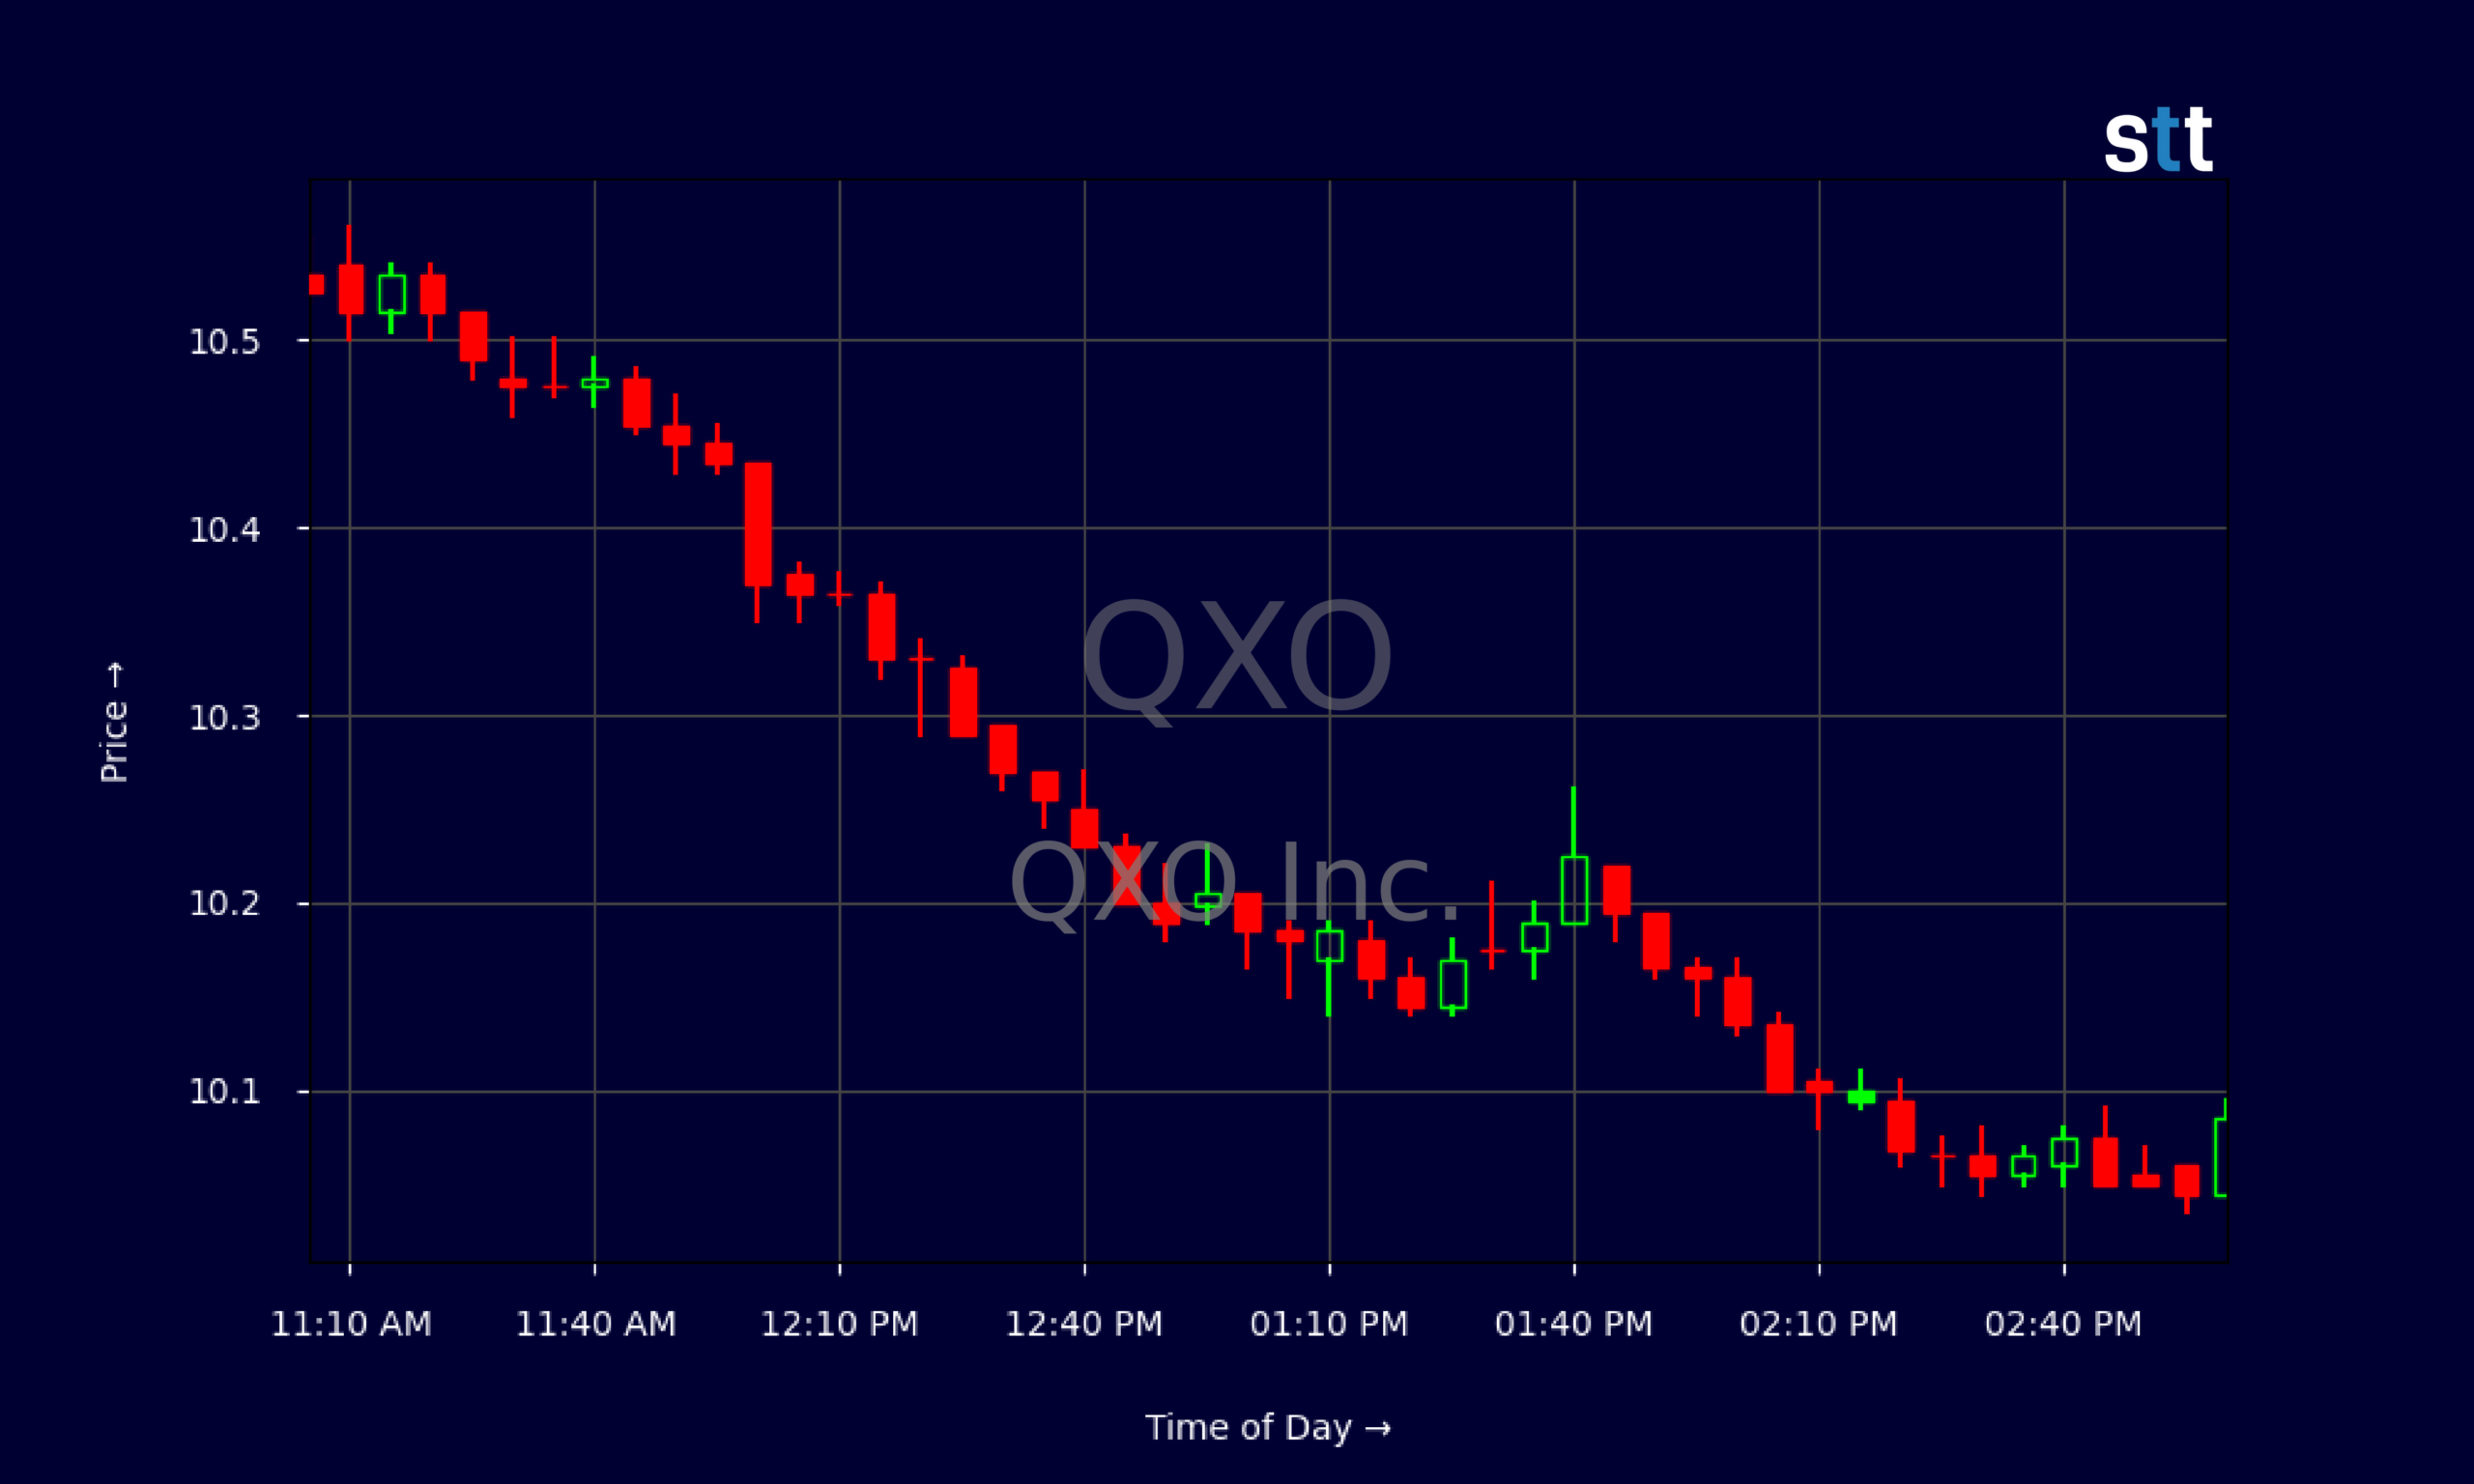
Live Update At 15:03:19 EDT: On Monday, October 19, 2026 QXO Inc. stock [NYSE: QXO] is trending down by -7.04%! Discover the key drivers behind this movement as well as our expert analysis in the detailed breakdown below.
Quick Financial Overview
QXO is a classic high-revenue, low-profit story. The company generated about $6.84B in revenue over the last year, with revenue growth above 400% in three years and almost 200% in five years. That kind of scale-up gets momentum traders’ attention. But QXO is not yet a profit machine. Profit margins are negative across the board, and recent quarterly EPS came in around -$0.14, reminding traders that this is still a turnaround and build-out phase.
On the positive side, QXO posts a 24% gross margin, so the core business creates solid value above direct costs. The drag shows up in operating expenses and financing costs. QXO reported EBITDA of roughly $235.8M last quarter but still booked a net loss near $55M. That gap tells traders the company is spending aggressively on growth, integration, or overhead.
More Breaking News
- APLD Stock Pops As AI Factory Earnings Crush Expectations
- IBRX Stock Rattled As Legal Probes Target ImmunityBio
- FRGT Stock Whipsaws Higher As Volatility Attracts Day Traders
- TeraWulf Stock Draws Bold Targets As AI Power Bet Scales Up
The balance sheet is mixed but interesting. QXO controls roughly $5.77B in cash at quarter end and around $2.77B in pure cash and equivalents, while total assets sit near $22.7B. Debt is not light, with about $6.04B in long-term debt and leverage ratios that demand attention. For short-term traders, this backdrop creates a battleground between growth expectations and balance-sheet risk.
Why Traders Are Watching QXO Price Action
QXO price action is speaking loudly right now. On the daily chart, QXO traded as high as roughly $12.50 in late September. Since then, the stock has trended lower, closing recently around $10.09 after an intraday range from about $11 down to just above $10. This is a clear downtrend over several weeks, with lower highs and lower lows. Swing traders see that as a broken short-term uptrend.
Zoom into the intraday 5‑minute chart and the story changes. QXO opened near $10.95, dumped quickly into the $10.60s, and then spent most of the session grinding lower toward $10.10. The tape shows a staircase pattern down, followed by tight consolidation between $10.05 and $10.10 late in the day. That tells day traders two things: sellers are still active, but panic has cooled, with both sides catching their breath.
From a risk-reward standpoint, QXO now trades just above its stated book value per share around $10. That 1.08 price‑to‑book multiple is modest for a growth name and will attract value‑oriented traders. At the same time, the price‑to‑sales ratio around 1.13 suggests the market is no longer willing to pay a big premium for QXO’s rapid revenue growth until the company shows clearer progress toward profitability.
The most aggressive part of QXO’s story sits in its cash flows. The company spent roughly $1.97B on acquisitions and burned free cash flow of about $248.1M last quarter, funded by over $3.01B of new debt and about $1.99B of preferred stock issuance. Traders who track dilution and leverage will stay laser-focused on that mix. For now, QXO remains a liquid, actively traded name where sentiment can flip quickly on technical breaks around the $10 level.
Conclusion
QXO is not a quiet, mature dividend payer. It is a high-growth, high-spend platform that is still proving itself to the market. Revenue growth north of 400% over three years is real momentum, and the 24% gross margin shows QXO’s core operations can generate solid contribution profit. But negative EBIT margins and recurring net losses keep longer‑term, fundamentals‑driven traders cautious. The capital structure—heavy acquisition spend, sizable long‑term debt, and meaningful preferred stock—is the price of that growth.
On the chart, QXO’s slide from the $12s to near $10 tells you sentiment has cooled. The stock now sits near book value, grinding sideways intraday with shrinking volatility. That kind of action often comes before a bigger move in either direction. Short-term traders in QXO will key off the $10 area as a line in the sand. Hold and bounce, and you might see a squeeze toward the $11s. Lose it on volume, and the trend downside can accelerate.
For active traders who study price action and manage risk tightly, QXO offers a live case study in how growth, leverage, and sentiment collide. As Tim Sykes likes to say, “The market doesn’t care about your opinion, it only cares about price action—trade what you see, not what you hope.” As Tim Bohen, lead trainer with StocksToTrade says, “Success in trading is more about cutting losses quickly than finding winners.”. In QXO, that means respecting the downtrend, watching the levels, and always staying ready to cut losses fast.
This is stock news, not investment advice. StocksToTrade News delivers real-time stock market updates tailored to highlight the key catalysts driving short-term price movements. Our coverage is designed for active traders and investors who thrive in fast-moving markets, with a focus on volatile sectors like penny stocks, AI stocks, Robinhood stocks and other momentum plays. From earnings reports and FDA approvals to mergers, new contracts, and unusual trading volume, we break down the events that can spark significant price action.
Looking to level up your trading game? Explore StocksToTrade, the ultimate platform for traders. With powerful tools designed for swing and day trading, integrated news scanning, and even social media monitoring, StocksToTrade keeps you one step ahead.
Check out our quick startup guide for new traders!
- How to Read Stock Charts: A Guide for Beginners
- Trading Plan: 6 Steps to Create One
- How To Create a Stock Watchlist
Ready to build your watchlists? Check out these curated lists:
Once your watchlist is set, take the next step and trade with confidence using StocksToTrade’s robust platform. Don’t miss out — grab your 14-day trial for just $7 and experience the edge you need to thrive in today’s fast-paced markets.