

Propanc Biopharma Inc. stocks have been trading down by -39.91 percent amid bearish sentiment over its clinical and financing outlook.
Market Insights For PPCB Traders
- Weekly chart shows a spike from near $1.07 to almost $1.98, followed by a sharp fade, signaling aggressive short-term speculation.
- Intraday action around $1.93–$1.35 reveals a wide trading range and heavy volatility, which can cut both ways for small accounts.
- Extremely weak profitability ratios and deep negative returns highlight that Propanc Biopharma Inc. remains a high-risk, early-stage style name.
- Balance sheet shows low debt and positive working capital, giving PPCB some runway despite heavy operating cash burn.
- Traders are watching whether recent pullbacks build a base above $1.30–$1.35 or break lower, which would shift the short-term bias.
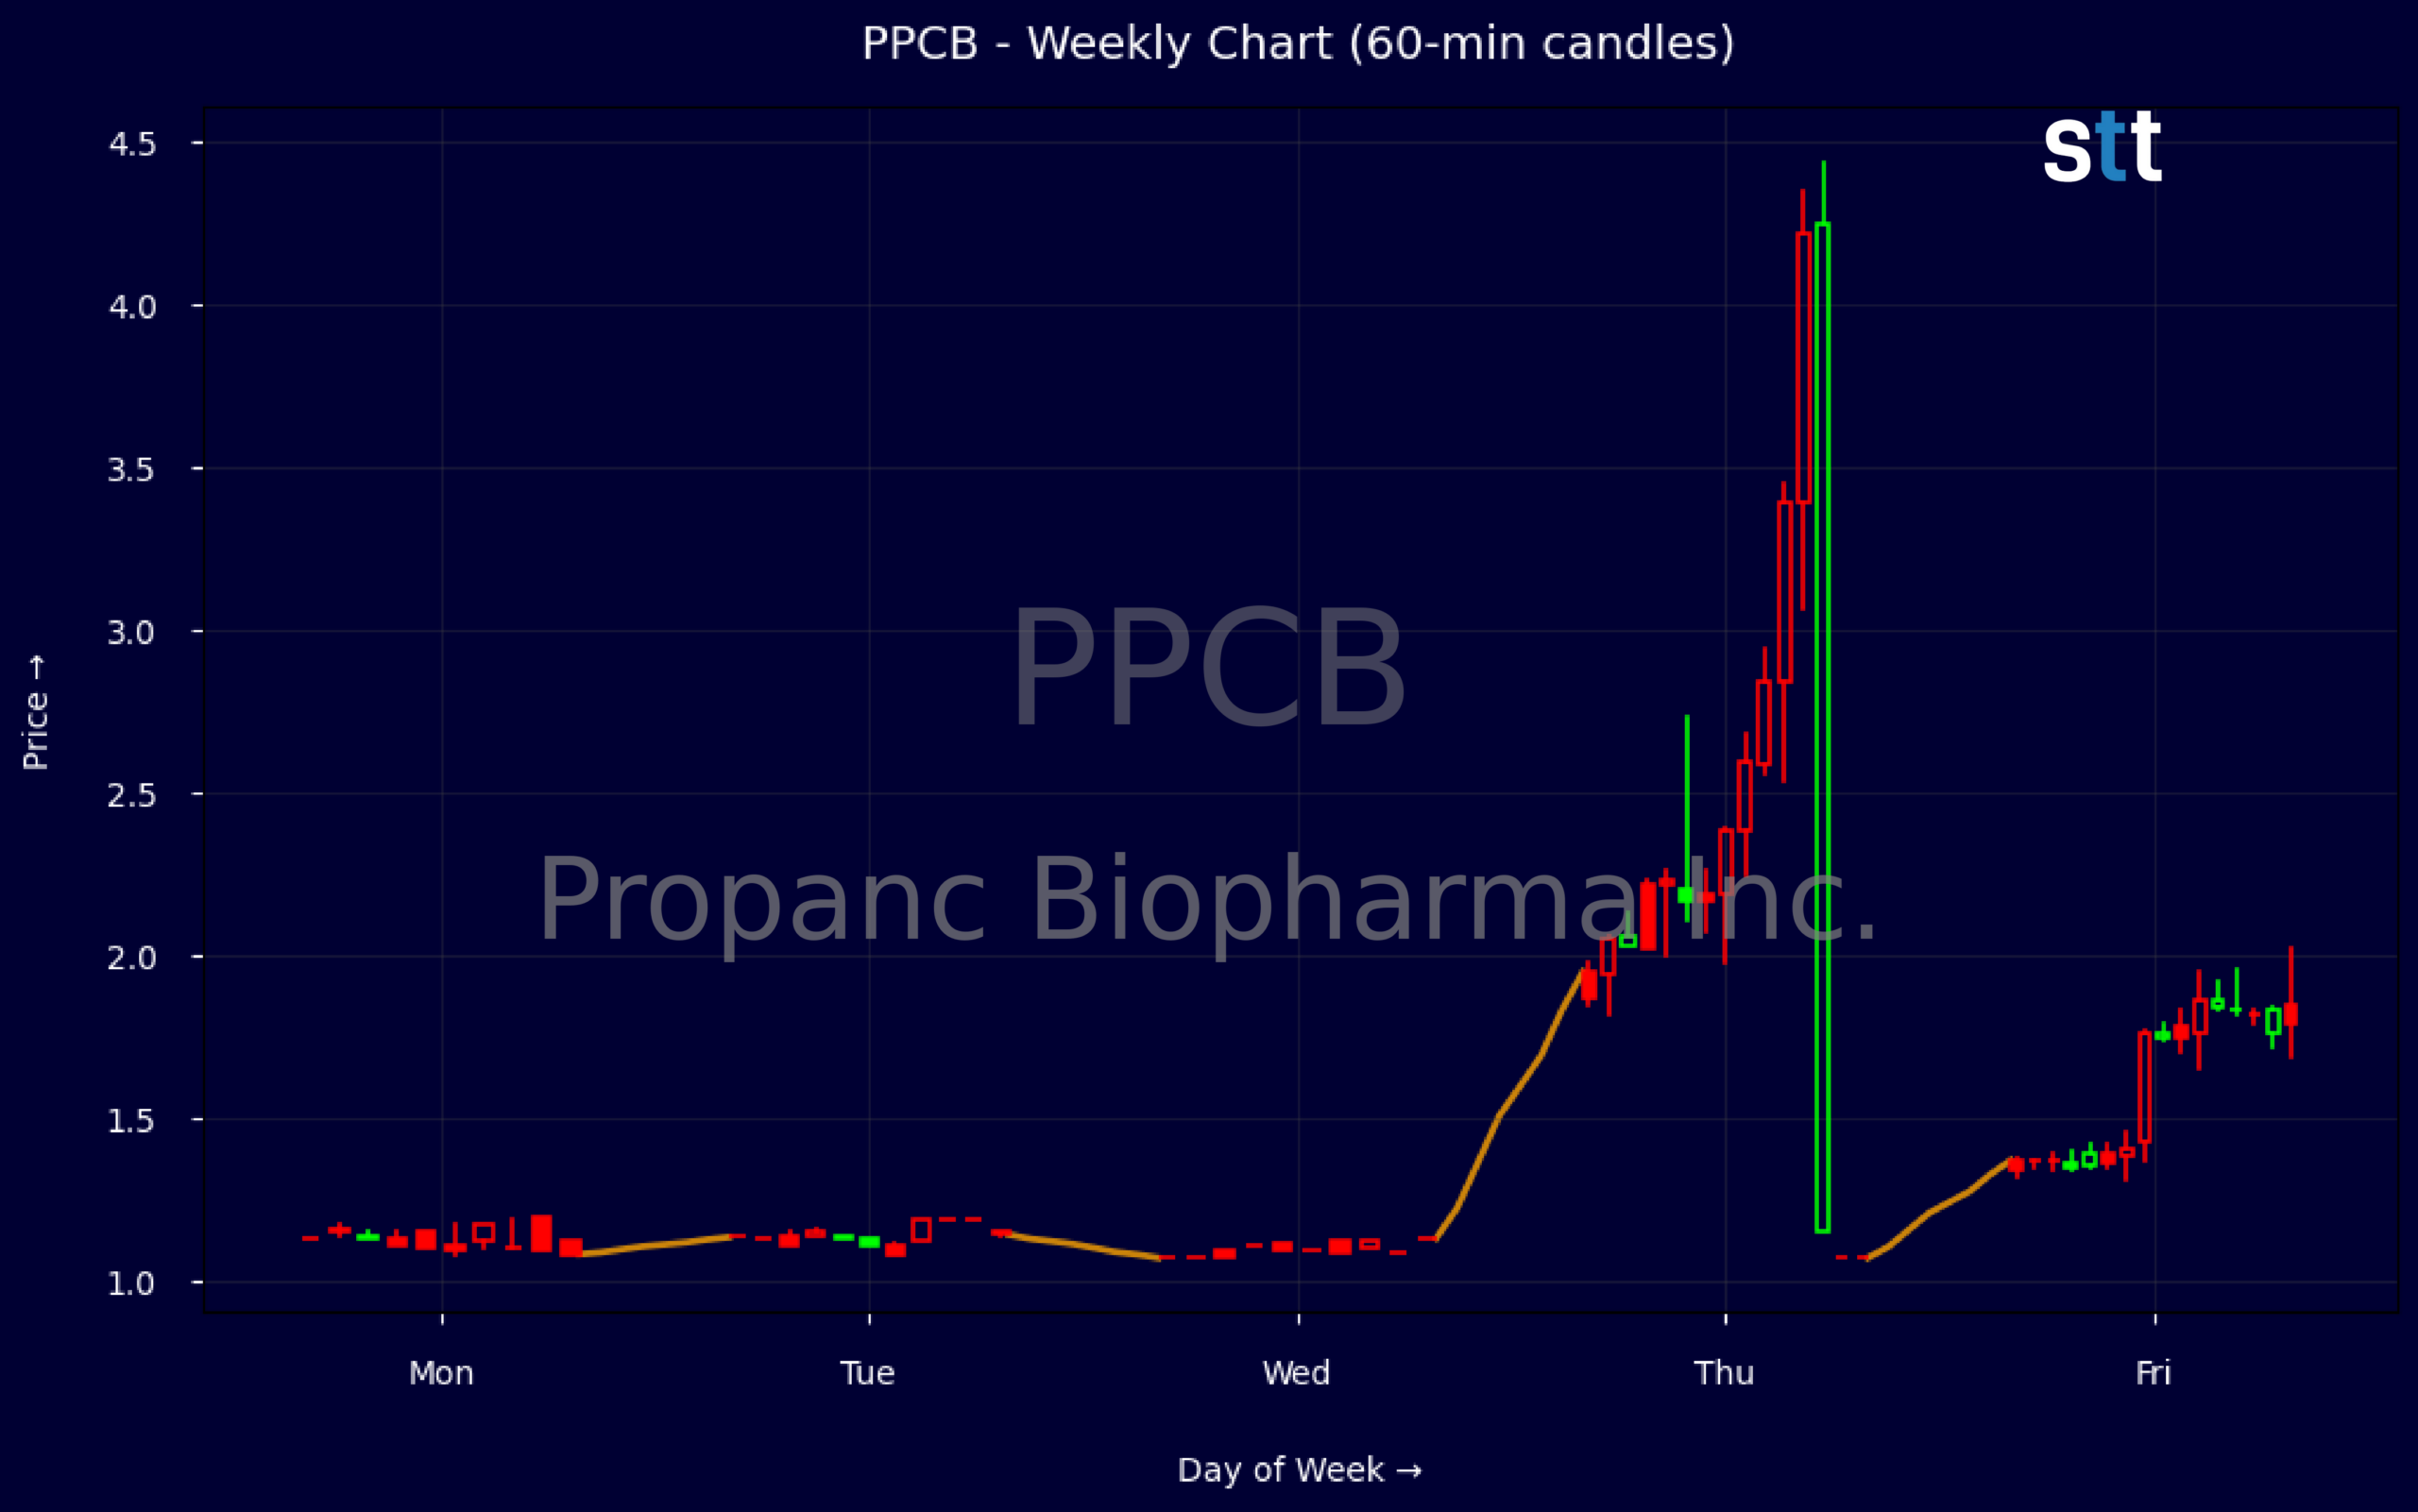
Weekly Update Aug 24 – Aug 28, 2026: On Sunday, August 30, 2026 Propanc Biopharma Inc. stock [NASDAQ: PPCB] is trending down by -39.91%! Discover the key drivers behind this movement as well as our expert analysis in the detailed breakdown below.
Healthcare industry expert:
Analyst sentiment – negative
PPCB sits at the extreme speculative end of small-cap healthcare. Fundamentals are severely impaired: Q3 FY26 net income was -$6.4m on a very small revenue base, with ROE around -138% and ROA worse than -100%, signaling a structurally unprofitable model. Despite low leverage (total debt/equity ~0.01, long-term debt/capital 0), the company is effectively funding operations via dilution and warrant issuance (APIC ~$149m vs retained deficit of -$140m). Cash of ~$0.44m and negative operating cash flow of -$1.1m underscore high financing risk.
Technically, PPCB is in a highly volatile, event-driven pattern rather than a stable trend. The price spiked from 1.07 to an intraday high of 1.98 on 8/27 before pulling back to the 1.30s, indicating a failed breakout and aggressive profit-taking, likely on thin float and elevated intraday volume. The dominant short-term trend is mean reversion within a 1.30–1.90 band. A specific actionable level is 1.05–1.10: a break and sustained trade below this zone is a clear short trigger targeting sub-1.00, while bounces into 1.80–1.90 are sell/short zones, given the absence of fundamental support.
More Breaking News
- CMCSA Rallies As Earnings Beat Collides With Restructuring Overhang
- Regeneron Stock Jumps As Libtayo Data Fuels Bullish Targets
- CMCSA Stock Grinds Higher As Earnings Beat Meets Big Restructure
- IOVA Stock Collapses As Traders Flee Biotech High‑Flier
With no material news catalysts disclosed and only two employees on record, PPCB lacks operational scale and strategic visibility relative to broader Healthcare and Biotechnology & Life Sciences benchmarks, which typically offer diversified pipelines and clearer regulatory milestones. PPCB trades more like a financing vehicle than a progressing biotech. I expect underperformance versus sector ETFs over 12–18 months. Key resistance sits at 1.90–2.00, support at 1.00–1.10; base-case bias is for a breakdown toward 0.60–0.70 absent a credible clinical or partnership catalyst.
Quick Financial Overview
Propanc Biopharma Inc. (PPCB) trades like a speculative small-cap name, and the recent weekly data confirms that. Price jumped from about $1.07 to an intrawEEK high near $1.98 before closing the week closer to the mid-$1 range. That kind of fast spike and fade tells traders momentum came in quickly and then just as quickly backed off, often a sign of short-term trading rather than steady accumulation.
The intraday candle shows an open near $1.93 and a close around $1.35 in one wide range move. That is a large intraday swing in percentage terms, which means slippage and execution risk are real for PPCB traders. When a stock can move that far in a single session, position size and hard stops matter more than usual.
On the fundamentals, PPCB shows a price-to-book near 0.48 with book value per share around $2.80, which suggests the market is valuing the equity below its accounting value. Debt looks modest, with total debt-to-equity near 0.01 and a current ratio of roughly 2.4, so near-term obligations appear manageable. The flip side is severe unprofitability: returns on assets and equity are deeply negative, and recent quarterly net income is around -$6.4M with operating cash flow also firmly negative. That combination — low valuation, low debt, but heavy losses — typically keeps a name in the high-risk bucket.
Conclusion
PPCB: High Volatility, High Risk, Tactical Setups Only
Propanc Biopharma Inc. sits in a tight corner of the market where story, liquidity, and emotion can drive price much faster than fundamentals do. The recent swing from roughly $1.07 up toward $1.98, then back down toward the mid-$1 range, shows that PPCB can reward fast entries but can punish hesitation just as quickly. For short-term traders, that action is attractive, but only if risk is defined before the trade, not after.
Financially, PPCB carries light debt and a current ratio that suggests short-term bills can be paid, which buys the company some time. At the same time, deep quarterly losses and large negative returns on equity and assets remind traders that cash burn is a real overhang. Any sustained push higher will likely need continued speculative flow or a clear improvement in the numbers, not just hope.
For traders building a plan, the key battleground in the near term is the $1.30–$1.35 area, with the prior spike high near $1.95–$1.98 as the obvious resistance reference. Propanc Biopharma Inc. remains, by all the data on price and financials, a textbook speculative trading vehicle rather than a stable compounder. As I tell my students, “Names like PPCB are not good or bad — they are just tools; your edge comes from knowing the risk, sizing small, and letting the chart, not your ego, call the shots.” And that edge is sharpened by rigorous review and journaling of every setup and outcome. As Tim Bohen, lead trainer with StocksToTrade says, “The best way to learn is by tracking trades, wins, losses, and lessons learned. Every trade has something to teach.”
This is stock news, not investment advice. StocksToTrade News delivers real-time stock market updates tailored to highlight the key catalysts driving short-term price movements. Our coverage is designed for active traders and investors who thrive in fast-moving markets, with a focus on volatile sectors like penny stocks, AI stocks, Robinhood stocks and other momentum plays. From earnings reports and FDA approvals to mergers, new contracts, and unusual trading volume, we break down the events that can spark significant price action.
Looking to level up your trading game? Explore StocksToTrade, the ultimate platform for traders. With powerful tools designed for swing and day trading, integrated news scanning, and even social media monitoring, StocksToTrade keeps you one step ahead.
Check out our quick startup guide for new traders!
- How to Read Stock Charts: A Guide for Beginners
- Trading Plan: 6 Steps to Create One
- How To Create a Stock Watchlist
Ready to build your watchlists? Check out these curated lists:
Once your watchlist is set, take the next step and trade with confidence using StocksToTrade’s robust platform. Don’t miss out — grab your 14-day trial for just $7 and experience the edge you need to thrive in today’s fast-paced markets.