
Profusa Inc. stock has been trading up by 21.27 percent amid heightened optimism surrounding its latest biomedical sensor developments.
Click Here for a Millionaire's POV on Trading PFSA
SUBSCRIBE FOR ALERTSJOIN 50,000+ ACTIVE TRADERS
Key Takeaways
- PFSA has dropped from near $2.30 to below $0.90 in weeks, signaling heavy selling and fading momentum.
- Intraday PFSA action shows sharp spikes and deep dips, a classic day-trader playground with big risk.
- Profusa Inc. is burning cash fast, with negative free cash flow and heavy short-term debt pressure.
- PFSA carries deeply negative equity, making this a high-risk, story-driven biotech-style ticker.
- Active traders are watching PFSA for emotion-fueled bounces while respecting strict risk rules.
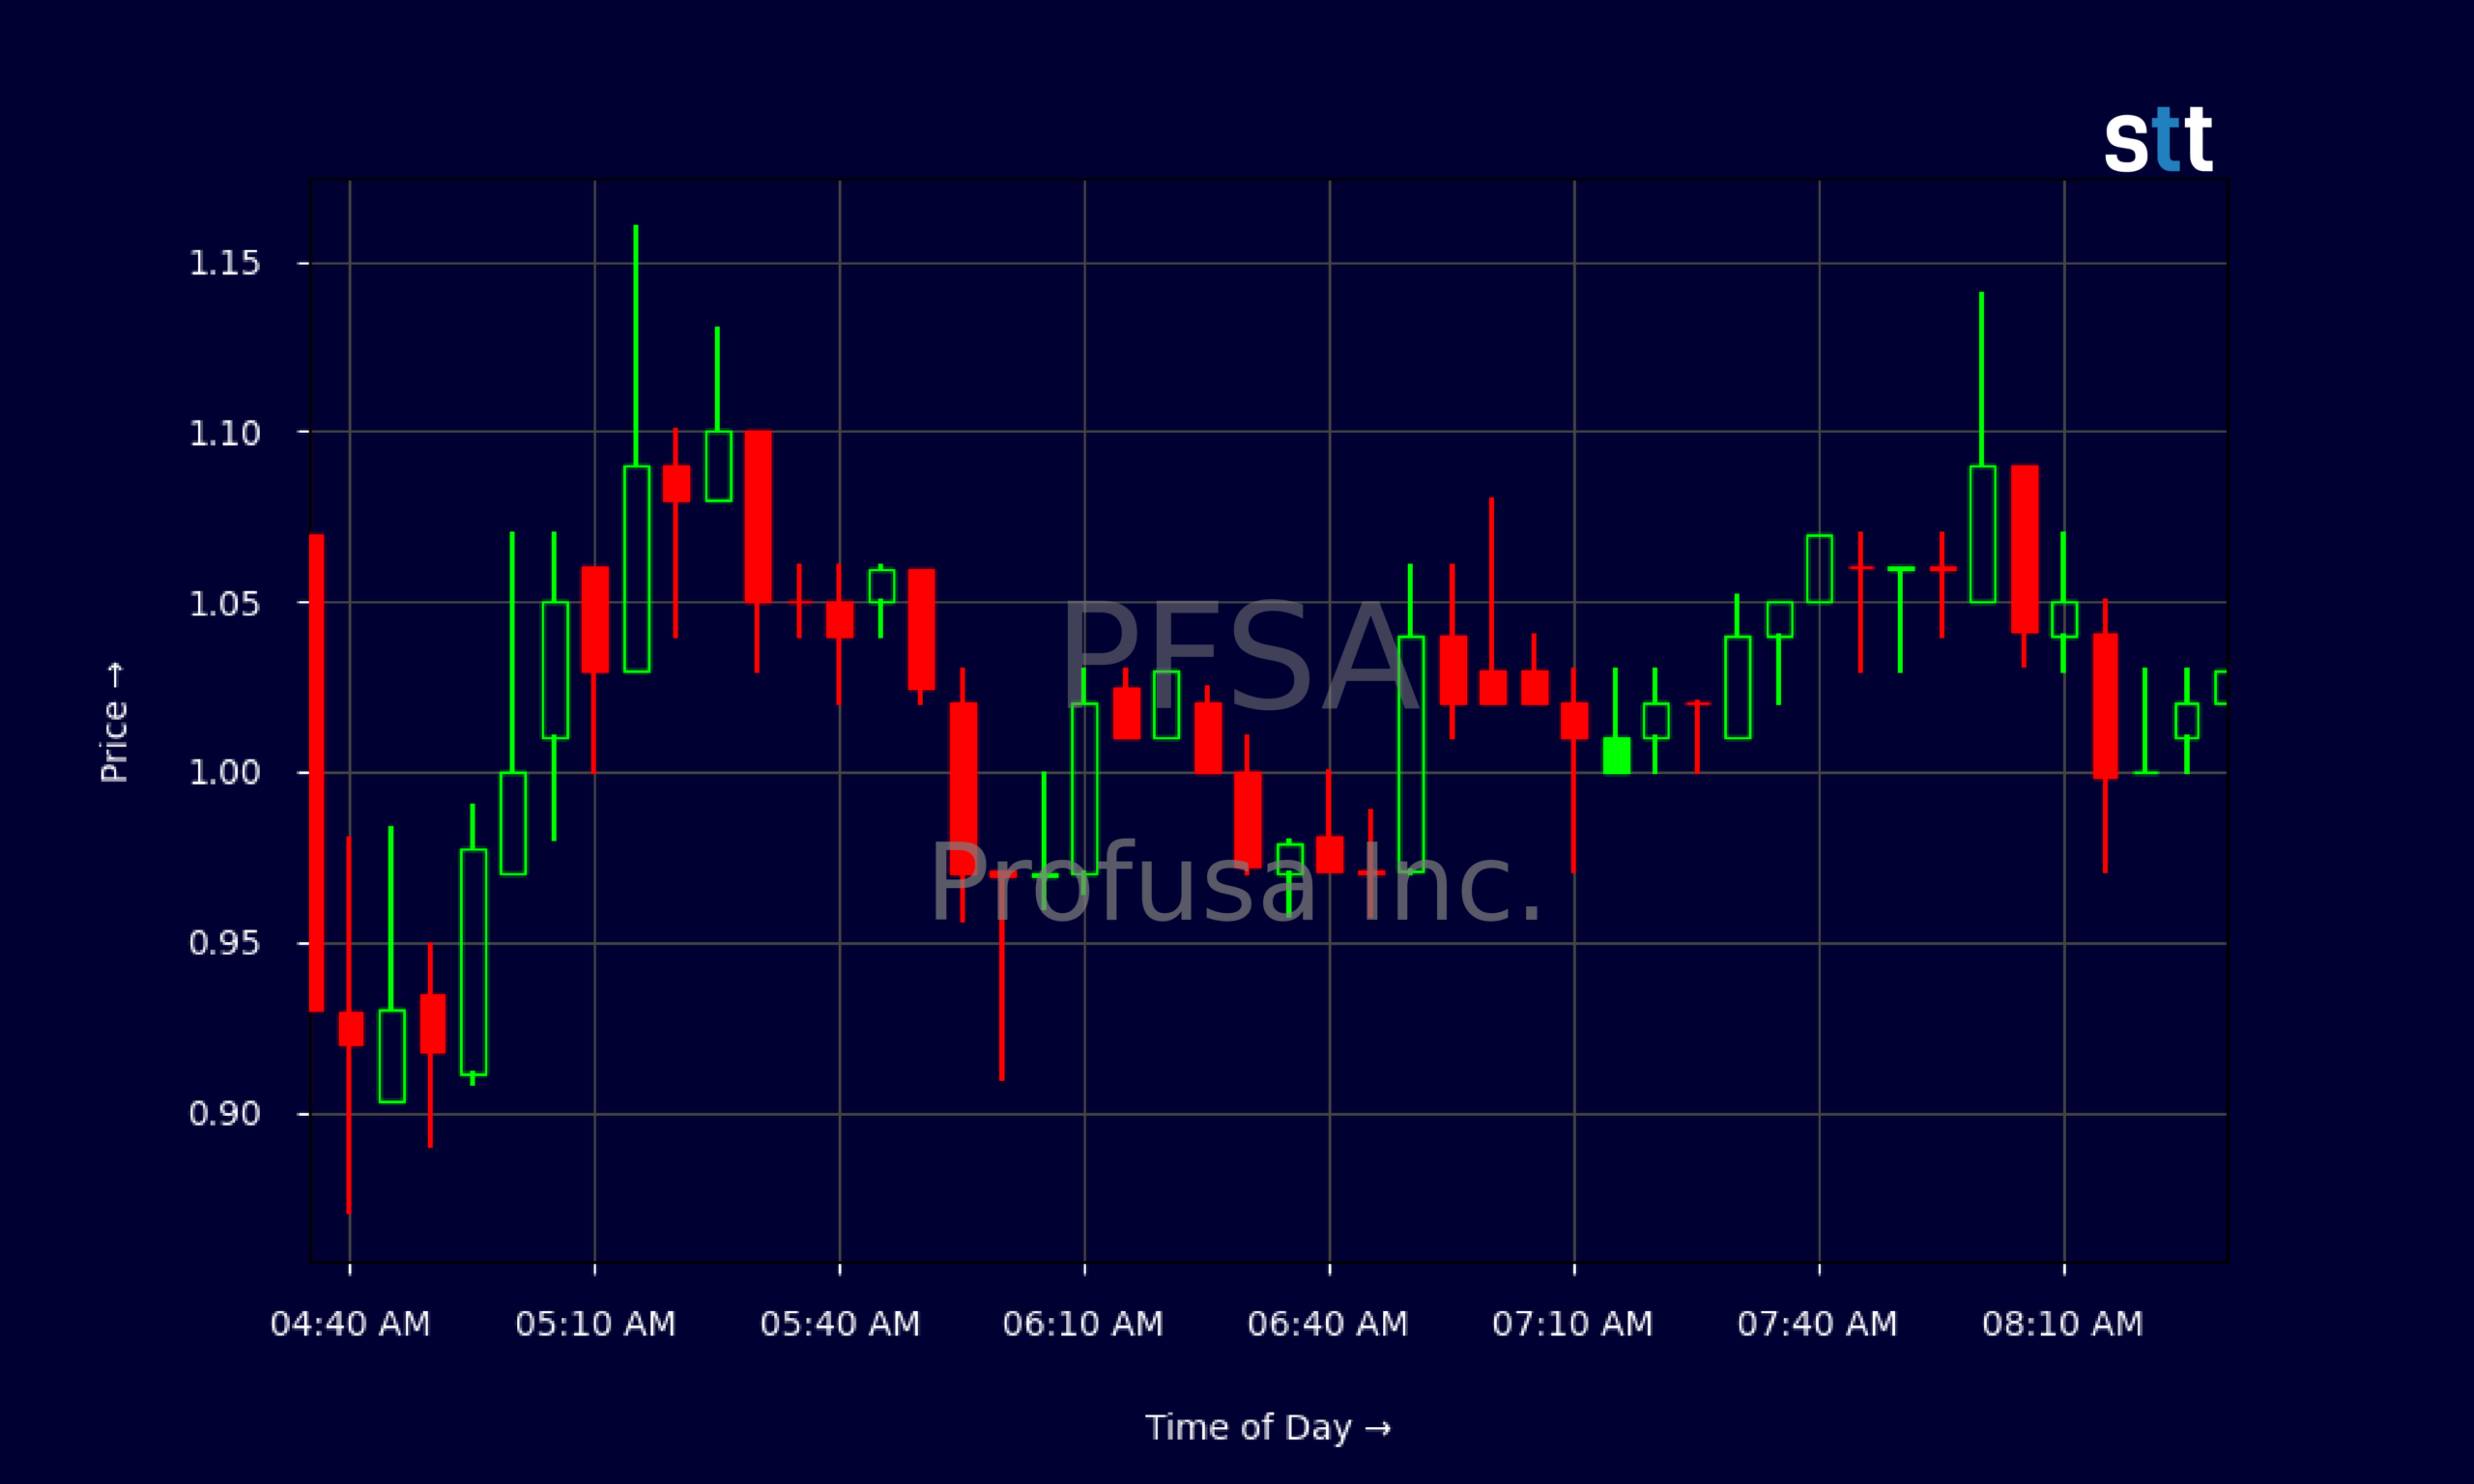
Live Update At 08:33:27 EDT: On Thursday, October 22, 2026 Profusa Inc. stock [NASDAQ: PFSA] is trending up by 21.27%! Discover the key drivers behind this movement as well as our expert analysis in the detailed breakdown below.
Quick Financial Overview
PFSA is trading like a distressed micro-cap, and the fundamentals back that up. Profusa Inc. shows total assets of about $1.0M against total liabilities near $28.2M, leaving stockholders’ equity at roughly -$27.1M. That means, on paper, PFSA owes far more than it owns. For traders, this is not a stable, cash-rich story. It’s a speculative, high-risk name.
The balance sheet shows current debt of about $14.0M and working capital of roughly -$27.3M. PFSA is under clear short-term pressure to keep funding operations. Operating cash flow for the recent quarter was about -$2.6M, with free cash flow around -$2.7M. Profusa Inc. is spending far more than it is bringing in.
More Breaking News
- Nebius Group NBIS Stock Jumps As AI Cloud Momentum Builds
- CRWV Stock Rebounds As Debt Fears Meet AI Expansion
- SPHL Stock Slides Premarket After Sharp 36% Rally
- MARA Stock Grinds Lower As Analysts Stay Bullish On Miners
Return on assets sits at extreme negative levels, and book value per share is heavily negative. That lines up with a low share price and constant dilution risk. For traders, PFSA is less about traditional value and more about timing sentiment, liquidity, and pure price action. When these numbers meet a chat-fueled spike, moves get violent fast.
Why Traders Are Watching PFSA Price Swings
PFSA has been on a wild ride. Just a few weeks ago, Profusa Inc. traded near $2.27–$2.29. Now, recent closes are down around $0.85–$0.90. That’s more than a 60% drawdown, which tells you how fast traders have pulled back from PFSA. Big runs up followed by steep fades are textbook for speculative small caps.
Look at the daily chart: PFSA popped from $1.66 on 2026/09/29 to $2.27 on 2026/09/29, then rolled over and has been grinding lower almost every day since 2026/10/02. Each bounce has been weaker. Profusa Inc. lost the $1.50 area, then $1.30, then $1.00, and now it’s fighting to hold the $0.80s. That stair-step pattern down shows control on the sell side.
Intraday, PFSA is still very active. In the premarket and early hours, Profusa Inc. traded from $0.96 up to $2.53 and back into the $1.40s within one session. That kind of range attracts day traders, momentum scanners, and shorts hunting overextended spikes. Every PFSA candle shows long wicks and fast reversals, signaling trapped late buyers and aggressive profit-taking.
Traders who focus on Profusa Inc. now are not looking for long-term safety. They’re stalking panic flushes and short-lived breakouts, using the chart as their guide. PFSA is a lesson in what happens when hot money moves on and the float becomes a battleground.
Conclusion
PFSA sits at the crossroads of brutal fundamentals and explosive chart action. Profusa Inc. is carrying negative equity, heavy current liabilities, and consistent cash burn. Traditional value screens will flag PFSA as deeply risky, and that’s accurate. Yet for active traders, that same stress can drive sharp squeezes and panics that create short-term opportunity.
The key is discipline. PFSA price history shows violent intraday swings and multi-day trend breaks. Traders who chase Profusa Inc. without a plan often get caught buying the top of a spike or shorting the bottom of a panic. The daily and intraday charts spell it out: support levels fail quickly, and bounces fade just as fast.
For those studying PFSA, this ticker is best treated as a trading classroom. Map clear levels, use tight risk, and think in terms of minutes and hours, not months. As Tim Sykes likes to hammer home, “Cut losses quickly, because staying stubborn is how small mistakes turn into blown-up accounts.” As Tim Bohen, lead trainer with StocksToTrade says, “If you’re still guessing at the end of your analysis, it’s probably not a trade worth taking.”. PFSA is exactly the kind of stock where that rule matters most. This is educational territory, not a comfort zone.
This is stock news, not investment advice. StocksToTrade News delivers real-time stock market updates tailored to highlight the key catalysts driving short-term price movements. Our coverage is designed for active traders and investors who thrive in fast-moving markets, with a focus on volatile sectors like penny stocks, AI stocks, Robinhood stocks and other momentum plays. From earnings reports and FDA approvals to mergers, new contracts, and unusual trading volume, we break down the events that can spark significant price action.
Looking to level up your trading game? Explore StocksToTrade, the ultimate platform for traders. With powerful tools designed for swing and day trading, integrated news scanning, and even social media monitoring, StocksToTrade keeps you one step ahead.
Check out our quick startup guide for new traders!
- How to Read Stock Charts: A Guide for Beginners
- Trading Plan: 6 Steps to Create One
- How To Create a Stock Watchlist
Ready to build your watchlists? Check out these curated lists:
Once your watchlist is set, take the next step and trade with confidence using StocksToTrade’s robust platform. Don’t miss out — grab your 14-day trial for just $7 and experience the edge you need to thrive in today’s fast-paced markets.