

PicoCELA Inc. shares have been trading up by 32.61 percent following strong market optimism over its latest technology partnership.
Key Takeaways
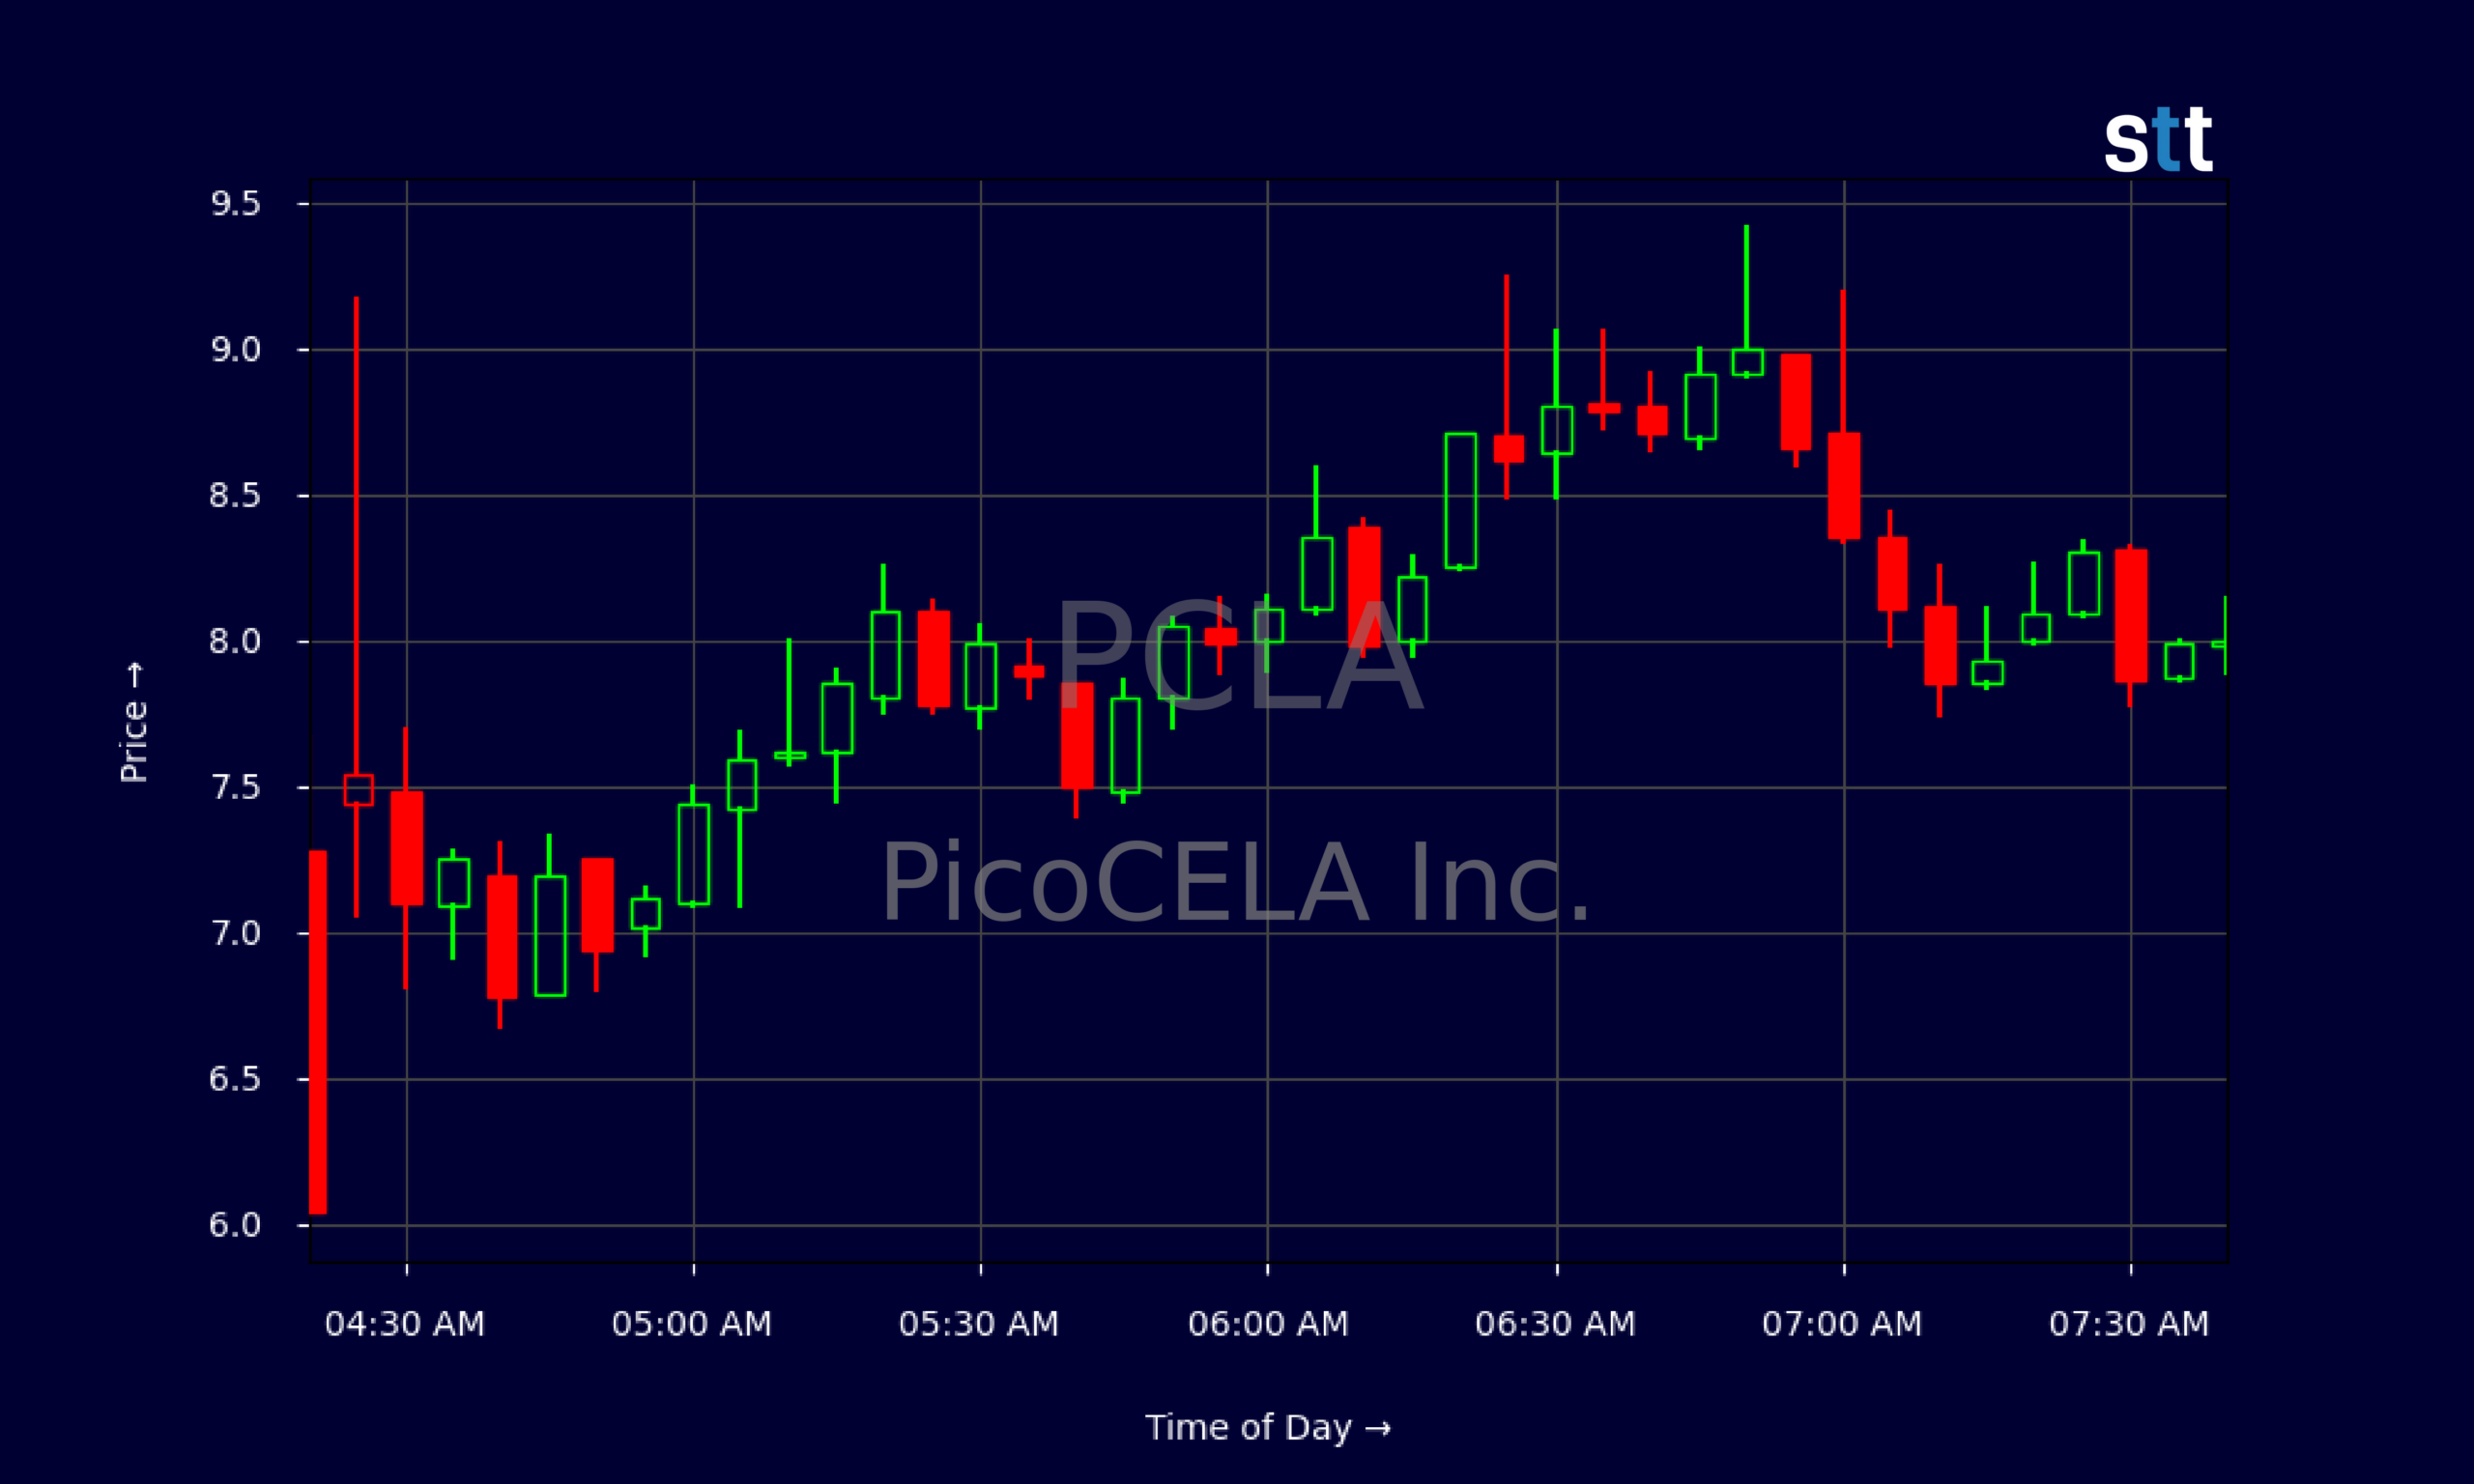
- PCLA is trading sharply higher intraday, spiking from the mid-$7s toward $9 before pulling back, showing strong day-trading interest and wide ranges.
- Recent daily candles for PicoCELA Inc. show a steady grind lower from the $6.80–$6.90 area into the high-$5s, followed by today’s momentum bounce.
- PCLA runs a lean operation with only 53 employees and about $534.9M in cash, but it also carries meaningful short-term debt and heavy accumulated losses.
- Valuation looks rich, with PCLA trading at roughly 17.9x sales and over 20x book value, signaling a sentiment-driven name rather than a fundamentals bargain.
- Traders are watching whether PCLA can hold above recent resistance-turned-support zones and turn this intraday spike into a sustained trend.
Live Update At 07:46:52 EDT: On Thursday, October 29, 2026 PicoCELA Inc. stock [NASDAQ: PCLA] is trending up by 32.61%! Discover the key drivers behind this movement as well as our expert analysis in the detailed breakdown below.
Quick Financial Overview
PicoCELA Inc., trading under ticker PCLA, is a classic high-growth, high-burn story that momentum traders love to stalk. The company pulled in about $544.7M in revenue over the last period, which is solid top-line scale for a relatively small operation with just 53 employees. But PCLA is far from a profit machine. Pretax profit margin sits around -114.1%, and returns on equity and assets are deeply negative at -15.98% and -7.62%, showing the business is still in heavy spend mode.
On the balance sheet, PCLA has roughly $534.9M in cash and short-term investments, plus $992.4M in current assets. That’s the good news. Against that, PicoCELA Inc. carries about $261.9M in current debt and $465.0M in total current liabilities. The working capital cushion of roughly $527.4M gives PCLA some breathing room, but the leverage ratio of 2.3 reminds traders this is not a no‑risk balance sheet.
More Breaking News
- MRVL Stock Pulls Back As Traders Eye High-Valuation Setup
- Microsoft Stock Pops As Cloud And AI Guidance Smash Expectations
- INTR Stock Plunges As Brazil Fintech Selloff Deepens
- SPCH ETF Slides From Highs As Volatility Grips Traders
Valuation is aggressive. PCLA trades at about 17.93x sales and 20.78x book value, very high multiples for a company still losing money. For short-term traders, that usually means one thing: sentiment and momentum can overpower fundamentals in a hurry.
Why Traders Are Watching PCLA Price Action
The PCLA chart is exactly the kind of setup that attracts active traders. On the daily timeframe, PicoCELA Inc. has been drifting lower for weeks. From early in the data set, PCLA was closing around $6.60–$6.80. More recently, closes slipped into the $5.90–$6.00 zone, showing a steady fade and clear pressure from sellers. That slow grind down often wears out weak hands and sets up a sharp reversal when fresh buying shows up.
Today’s intraday action tells that story. PCLA opened the premarket in the low-$7s and ripped into the $9.00–$9.20 area before giving back a chunk. Five‑minute candles show big wicks both ways, with PCLA swinging between roughly $7.40 and $9.24. That kind of range is a day-trading playground but a risk management nightmare for anyone not respecting their stops. For PicoCELA Inc. traders, this is textbook volatility: gaps, fast spikes, and equally fast reversals.
Technically, the prior daily resistance around $6.70–$6.90 on PCLA now matters. When a stock like PicoCELA Inc. launches off the lows, traders watch whether pullbacks hold above those old levels. If PCLA can build a base above that zone, the squeeze can continue. If it loses that area again, this move turns into just another failed bounce in a broader downtrend.
Because PicoCELA Inc. is richly valued by price-to-sales and price-to-book, many fundamental players stay on the sidelines. That leaves a larger share of the float in the hands of short-term traders and speculators. In that environment, PCLA’s next move will likely be driven more by the chart than by new fundamentals.
Conclusion
PCLA sits at an interesting crossroads that active traders know well. On one side, PicoCELA Inc. shows heavy losses, negative returns, and a sky‑high valuation. Profitability is nowhere in sight, at least based on current margins and returns. On the other side, PCLA’s balance sheet has real muscle: more than half a billion dollars in cash and a sizeable working capital buffer. That combination often turns a stock into a trading vehicle rather than a long‑term fundamental story.
For short-term players, the message is simple. PCLA is moving because traders are pushing it, not because the underlying numbers suddenly flipped from red to green. The intraday surge from the $7s toward $9, following weeks of slow daily weakness, is exactly the kind of “change in character” that momentum traders on PicoCELA Inc. scan for every day. This is where routine and preparation give traders an edge; as Tim Bohen, lead trainer with StocksToTrade says, “A consistent trading routine beats sporadic action every time. Show up daily, and you’ll start to see the patterns others miss.”
In this kind of name, the core rules from the Tim Sykes community matter. Tim teaches traders to study the chart, trade the pattern, and respect risk above all. As he often says, “The key is not predicting the future, it’s reacting to what the market actually does while cutting losses quickly.” For PCLA, that means treating PicoCELA Inc. as a trading setup, not a sure thing, and letting the price action tell you when the party is over.
This is stock news, not investment advice. StocksToTrade News delivers real-time stock market updates tailored to highlight the key catalysts driving short-term price movements. Our coverage is designed for active traders and investors who thrive in fast-moving markets, with a focus on volatile sectors like penny stocks, AI stocks, Robinhood stocks and other momentum plays. From earnings reports and FDA approvals to mergers, new contracts, and unusual trading volume, we break down the events that can spark significant price action.
Looking to level up your trading game? Explore StocksToTrade, the ultimate platform for traders. With powerful tools designed for swing and day trading, integrated news scanning, and even social media monitoring, StocksToTrade keeps you one step ahead.
Check out our quick startup guide for new traders!
- How to Read Stock Charts: A Guide for Beginners
- Trading Plan: 6 Steps to Create One
- How To Create a Stock Watchlist
Ready to build your watchlists? Check out these curated lists:
Once your watchlist is set, take the next step and trade with confidence using StocksToTrade’s robust platform. Don’t miss out — grab your 14-day trial for just $7 and experience the edge you need to thrive in today’s fast-paced markets.