

Positive clinical trial news drives Park Ha Biological Technology Co. Ltd. optimism as stocks have been trading up by 23.21 percent
Market Insights For BYAH Traders
- Weekly chart for BYAH shows a swing from $1.30 support to a $1.76 high, then a pullback, signaling active short-term trading interest.
- Intraday action with a $1.68 high fading to a $1.32 close highlights sharp volatility and weak close, a red flag for momentum bulls.
- Park Ha Biological Technology Co. Ltd. posts roughly $2.52M in revenue with a price-to-sales near 1.2, suggesting the stock is not priced for extreme growth.
- Balance sheet shows about $3.79M in cash and solid working capital, giving the company room to operate despite heavy accumulated losses.
- Traders are tracking $1.30–$1.32 as key support and $1.70–$1.76 as resistance to frame near-term breakout or breakdown trades.
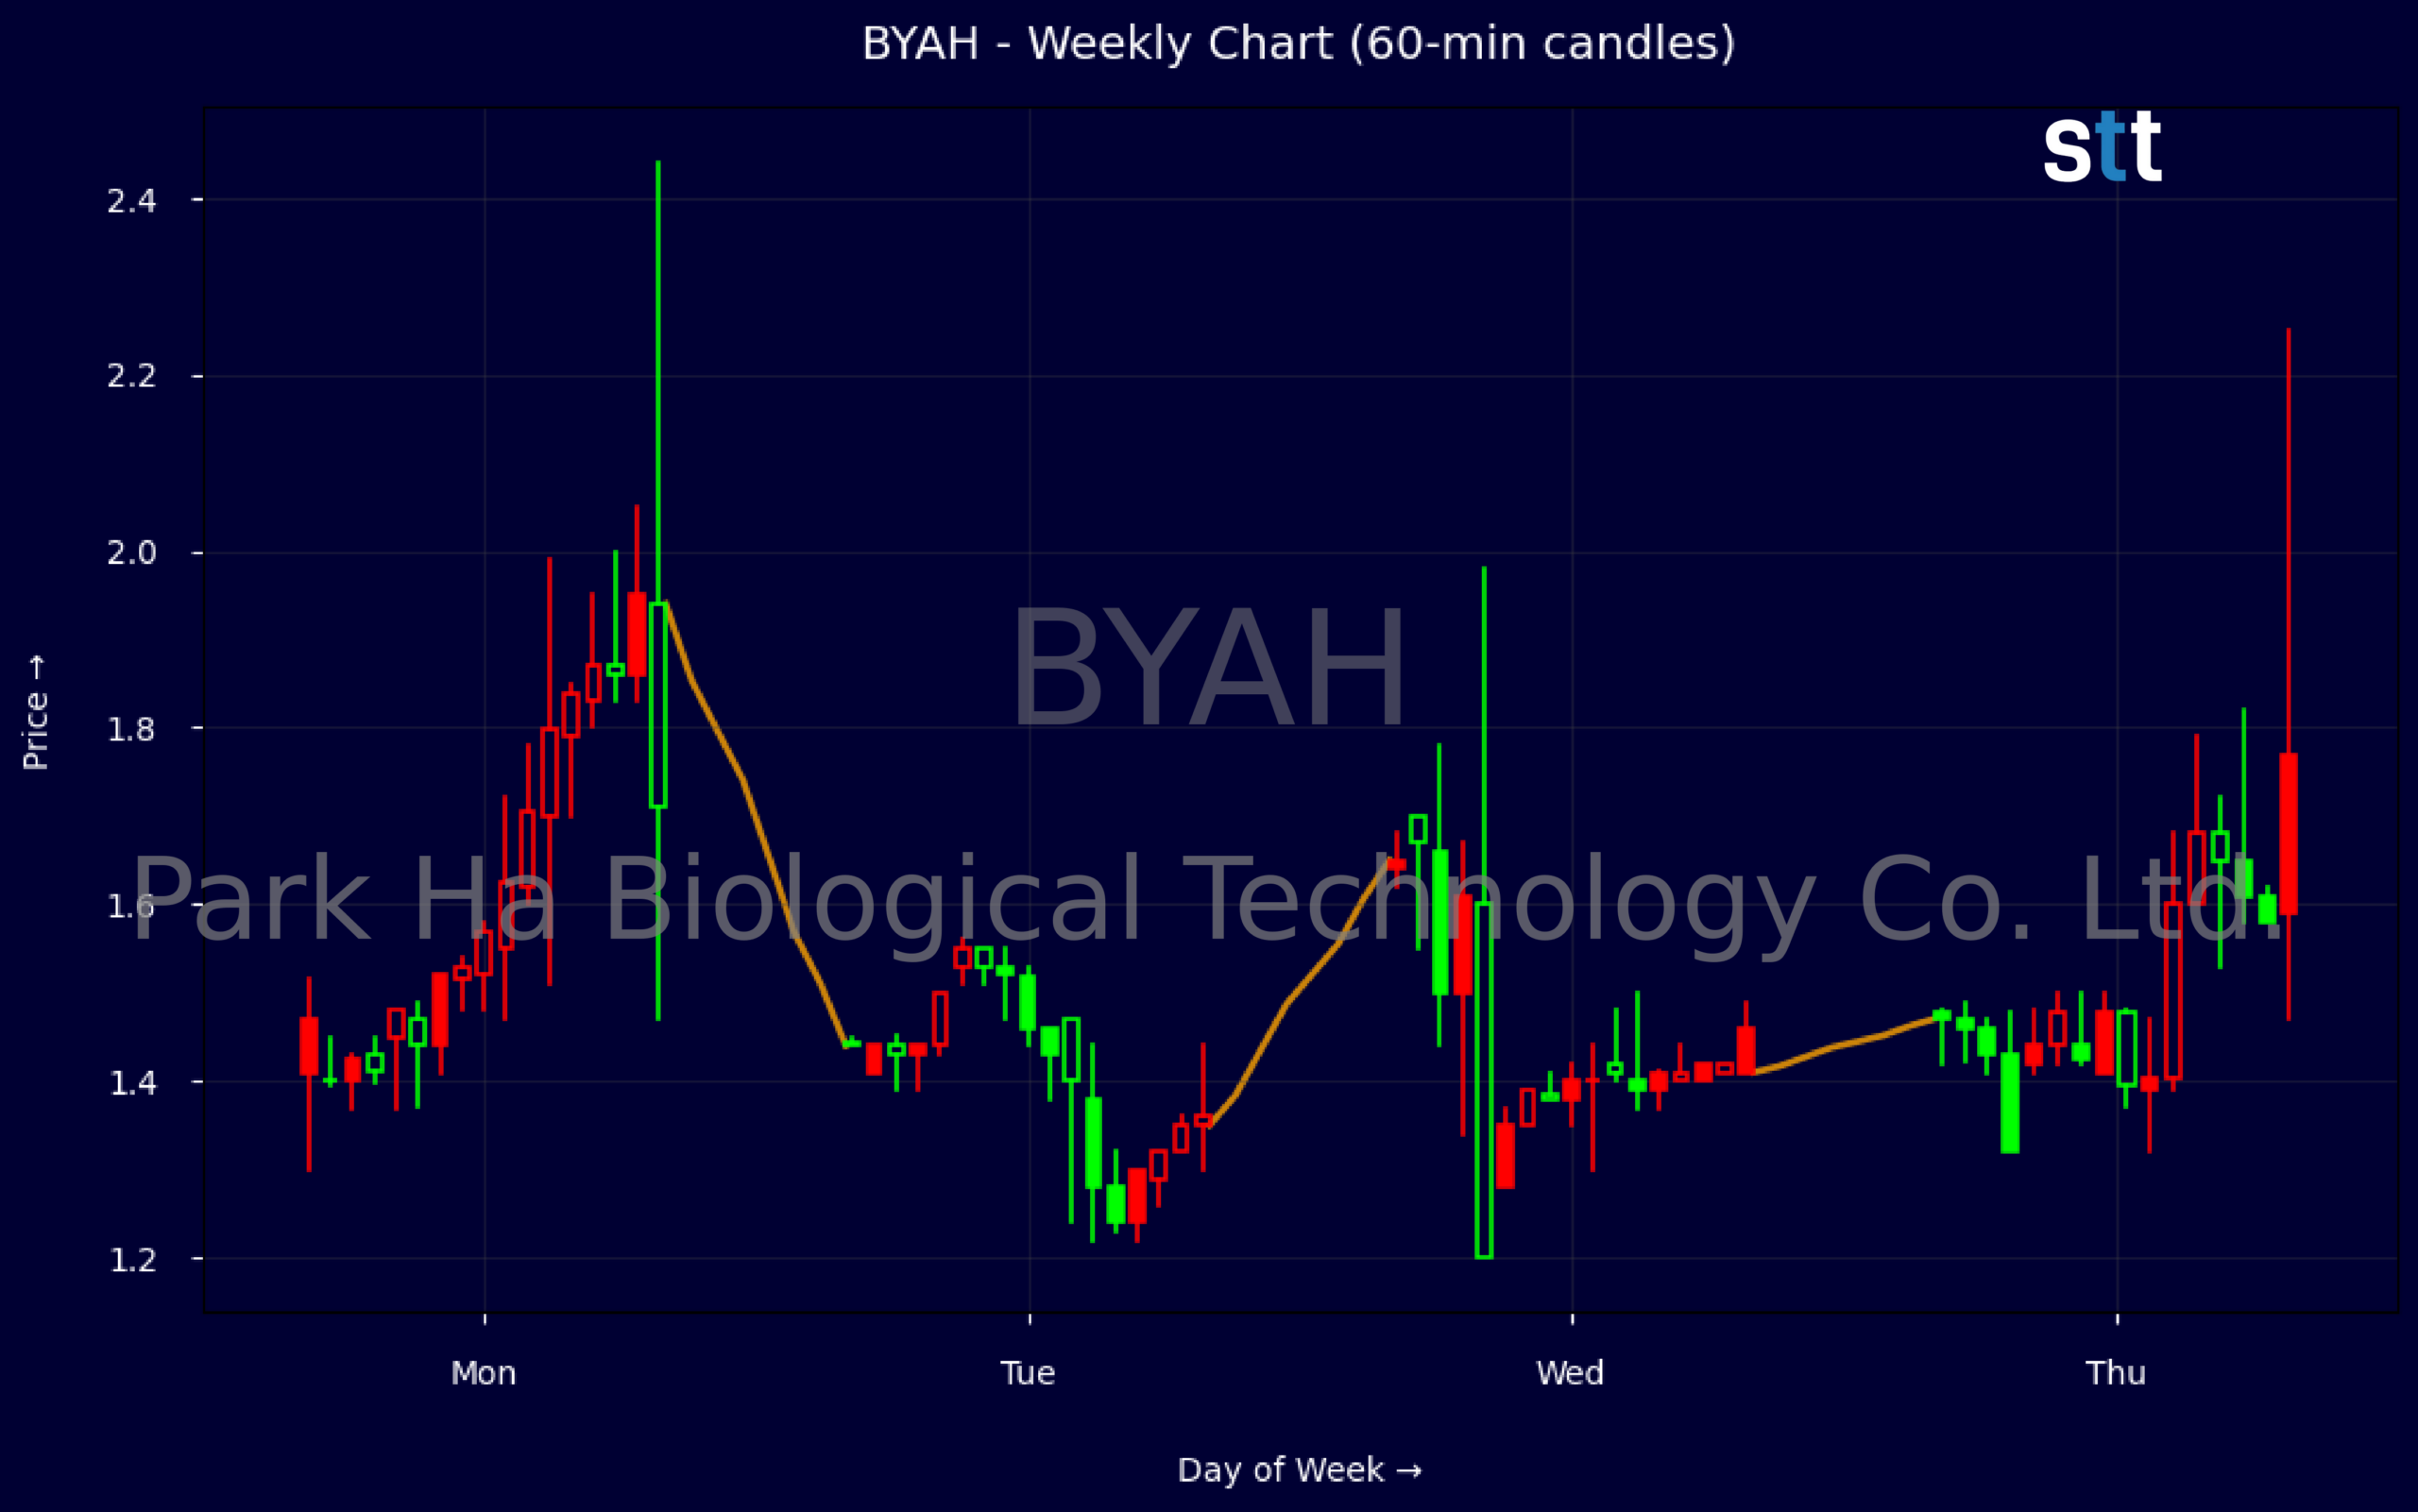
Weekly Update Jun 15 – Jun 19, 2026: On Sunday, June 21, 2026 Park Ha Biological Technology Co. Ltd. stock [NASDAQ: BYAH] is trending up by 23.21%! Discover the key drivers behind this movement as well as our expert analysis in the detailed breakdown below.
Consumer Staples industry expert:
Analyst sentiment – negative
BYAH is a tiny, thinly staffed platform business with consumer-staples adjacency, not a traditional operator. Revenue of ~$2.5M against a ~$2.9M enterprise value implies ~1.2x sales, but ROIC of roughly -847% and zero reported ROA/ROE highlight a non-viable core economic model today. The balance sheet is asset-rich (cash and investments ~3.8M, equity ~4.0M, leverage ratio 1.5, minimal long-term debt) but retained losses of -$24M signal chronic value destruction.
Technically, BYAH trades like an illiquid micro-cap. The weekly tape shows sharp swings: a drop from 1.47 to 1.43, stabilization near 1.45, a spike to 1.73, then retrace to ~1.48, suggesting a volatile, news- and flow-driven range. Intraday 5-minute candles indicate low, inconsistent volume with wide spreads. Dominant structure is range-bound between 1.30 support and 1.75 resistance. Actionable level: buyers only above 1.75 on strong volume confirmation; below 1.30, avoid or short-term speculative downside.
More Breaking News
- AMZN Stock Under Pressure As Rivals Target Core Businesses
- CareDx CDNA Soars After Earnings Beat And Guidance Hike
- SOFI Stock Slips As Analyst Warns Of $1B Headwind
- NOK Stock Slides As Earnings Strength Fails To Impress Traders
With no substantive recent news, BYAH lacks clear catalysts versus Consumer Staples and Household & Personal peers that benefit from stable brands, scale, and positive cash generation. The company trades more like a cash shell or platform option than a functioning staples business, making it structurally inferior to sector benchmarks. Base case: neutral-to-negative outlook with a trading range of 1.30–1.75; tactical traders can target 1.90 on a breakout above 1.75, while long-only investors should wait for a credible operating plan.
Quick Financial Overview
Park Ha Biological Technology Co. Ltd. (BYAH) shows modest revenue of about $2.52M, translating to revenue per share near $0.56. With a price-to-sales ratio around 1.18, the market values the business at a little over its annual revenue, a middle-of-the-road stance for a small-cap name. Book value per share sits near $0.15, while the price-to-book around 2.47 signals traders are paying a premium over accounting equity, often tied to growth hopes or speculative demand.
The balance sheet for Park Ha Biological Technology Co. Ltd. lists total assets of roughly $5.95M, with cash and equivalents around $3.79M, a strong cash-heavy profile. Current assets of about $5.50M against current liabilities of roughly $1.88M give working capital near $3.62M, which helps provide operational breathing room. Total liabilities around $1.96M against equity near $4.0M point to limited leverage, with a long-term debt and lease balance under $0.08M.
Despite that, retained earnings show a deep deficit of roughly -$24.18M and return on capital is sharply negative, flagging a history of losses and poor capital efficiency. For traders, that mix — cash runway plus heavy past losses — typically leads to binary outcomes over time, often tied to execution or financing moves. BYAH’s valuation metrics suggest the stock is not stretched on sales, but profitability metrics are weak or absent, which can keep the ticker firmly in the speculative bucket.
Conclusion
Park Ha Biological Technology Co. Ltd. Trading Setup
Recent price action in BYAH tells a clear story of speculation around a thinly traded small-cap. On the weekly chart, the move from a $1.30 low up to $1.76, followed by a close back around $1.48, frames a wide but tradable range. The intraday candle, which opened near $1.66, spiked to $1.68, and then sold off hard to close at $1.32, shows sellers taking control into the close, a warning sign for late longs.
Financially, Park Ha Biological Technology Co. Ltd. combines a healthy cash position and working capital with a deep retained loss and negative capital returns. That profile can invite short-term trading interest because the balance sheet can support operations, yet the business has not proved it can generate lasting profit. For traders, the key technical levels are clear: $1.30–$1.32 as a make-or-break support band and $1.70–$1.76 as the near-term resistance ceiling. A clean break with volume on either side can set up momentum trades, while choppy action inside that band favors quick scalps and tight risk. In setups like this, detailed planning before the open is crucial; as Tim Bohen, lead trainer with StocksToTrade says, “Preparation is half the trade. By the time the bell rings, my decisions are nearly made.” That mindset helps traders map out entries, exits, and risk levels in advance instead of reacting emotionally to fast intraday moves.
BYAH remains a speculative chart that rewards discipline more than hope. As I tell my students, “Price pays, risk kills, and your only real edge is respecting both on every single trade.”
This is stock news, not investment advice. StocksToTrade News delivers real-time stock market updates tailored to highlight the key catalysts driving short-term price movements. Our coverage is designed for active traders and investors who thrive in fast-moving markets, with a focus on volatile sectors like penny stocks, AI stocks, Robinhood stocks and other momentum plays. From earnings reports and FDA approvals to mergers, new contracts, and unusual trading volume, we break down the events that can spark significant price action.
Looking to level up your trading game? Explore StocksToTrade, the ultimate platform for traders. With powerful tools designed for swing and day trading, integrated news scanning, and even social media monitoring, StocksToTrade keeps you one step ahead.
Check out our quick startup guide for new traders!
- How to Read Stock Charts: A Guide for Beginners
- Trading Plan: 6 Steps to Create One
- How To Create a Stock Watchlist
Ready to build your watchlists? Check out these curated lists:
Once your watchlist is set, take the next step and trade with confidence using StocksToTrade’s robust platform. Don’t miss out — grab your 14-day trial for just $7 and experience the edge you need to thrive in today’s fast-paced markets.