
Pacific Gas & Electric Co. faces heightened wildfire liability concerns, and its stocks have been trading down by -3.43 percent.
Click Here for a Millionaire's POV on Trading PCG
SUBSCRIBE FOR ALERTSJOIN 50,000+ ACTIVE TRADERS
Key Takeaways
- Shares of PCG dropped 2.7% after Q3 results showed lower performance, with adjusted earnings matching expectations but revenue missing Wall Street estimates.
- Q3 revenue for Pacific Gas & Electric Co. came in at $6.19B versus the $6.82B FactSet consensus, signaling weaker-than-expected top-line momentum for PCG.
- UBS cut PCG from buy to neutral and slashed its price target to $14 from $19, triggering a 6.5% slide that made it the worst-performing utilities name that day.
- The downgrade pressured PCG again with a 3.4% decline, even as broader energy names benefited from firmer prices and a rising sector backdrop.
- Weak utilities sentiment plus the steep UBS target cut have added extra pressure on PCG, keeping the stock on many traders’ short and watch lists.
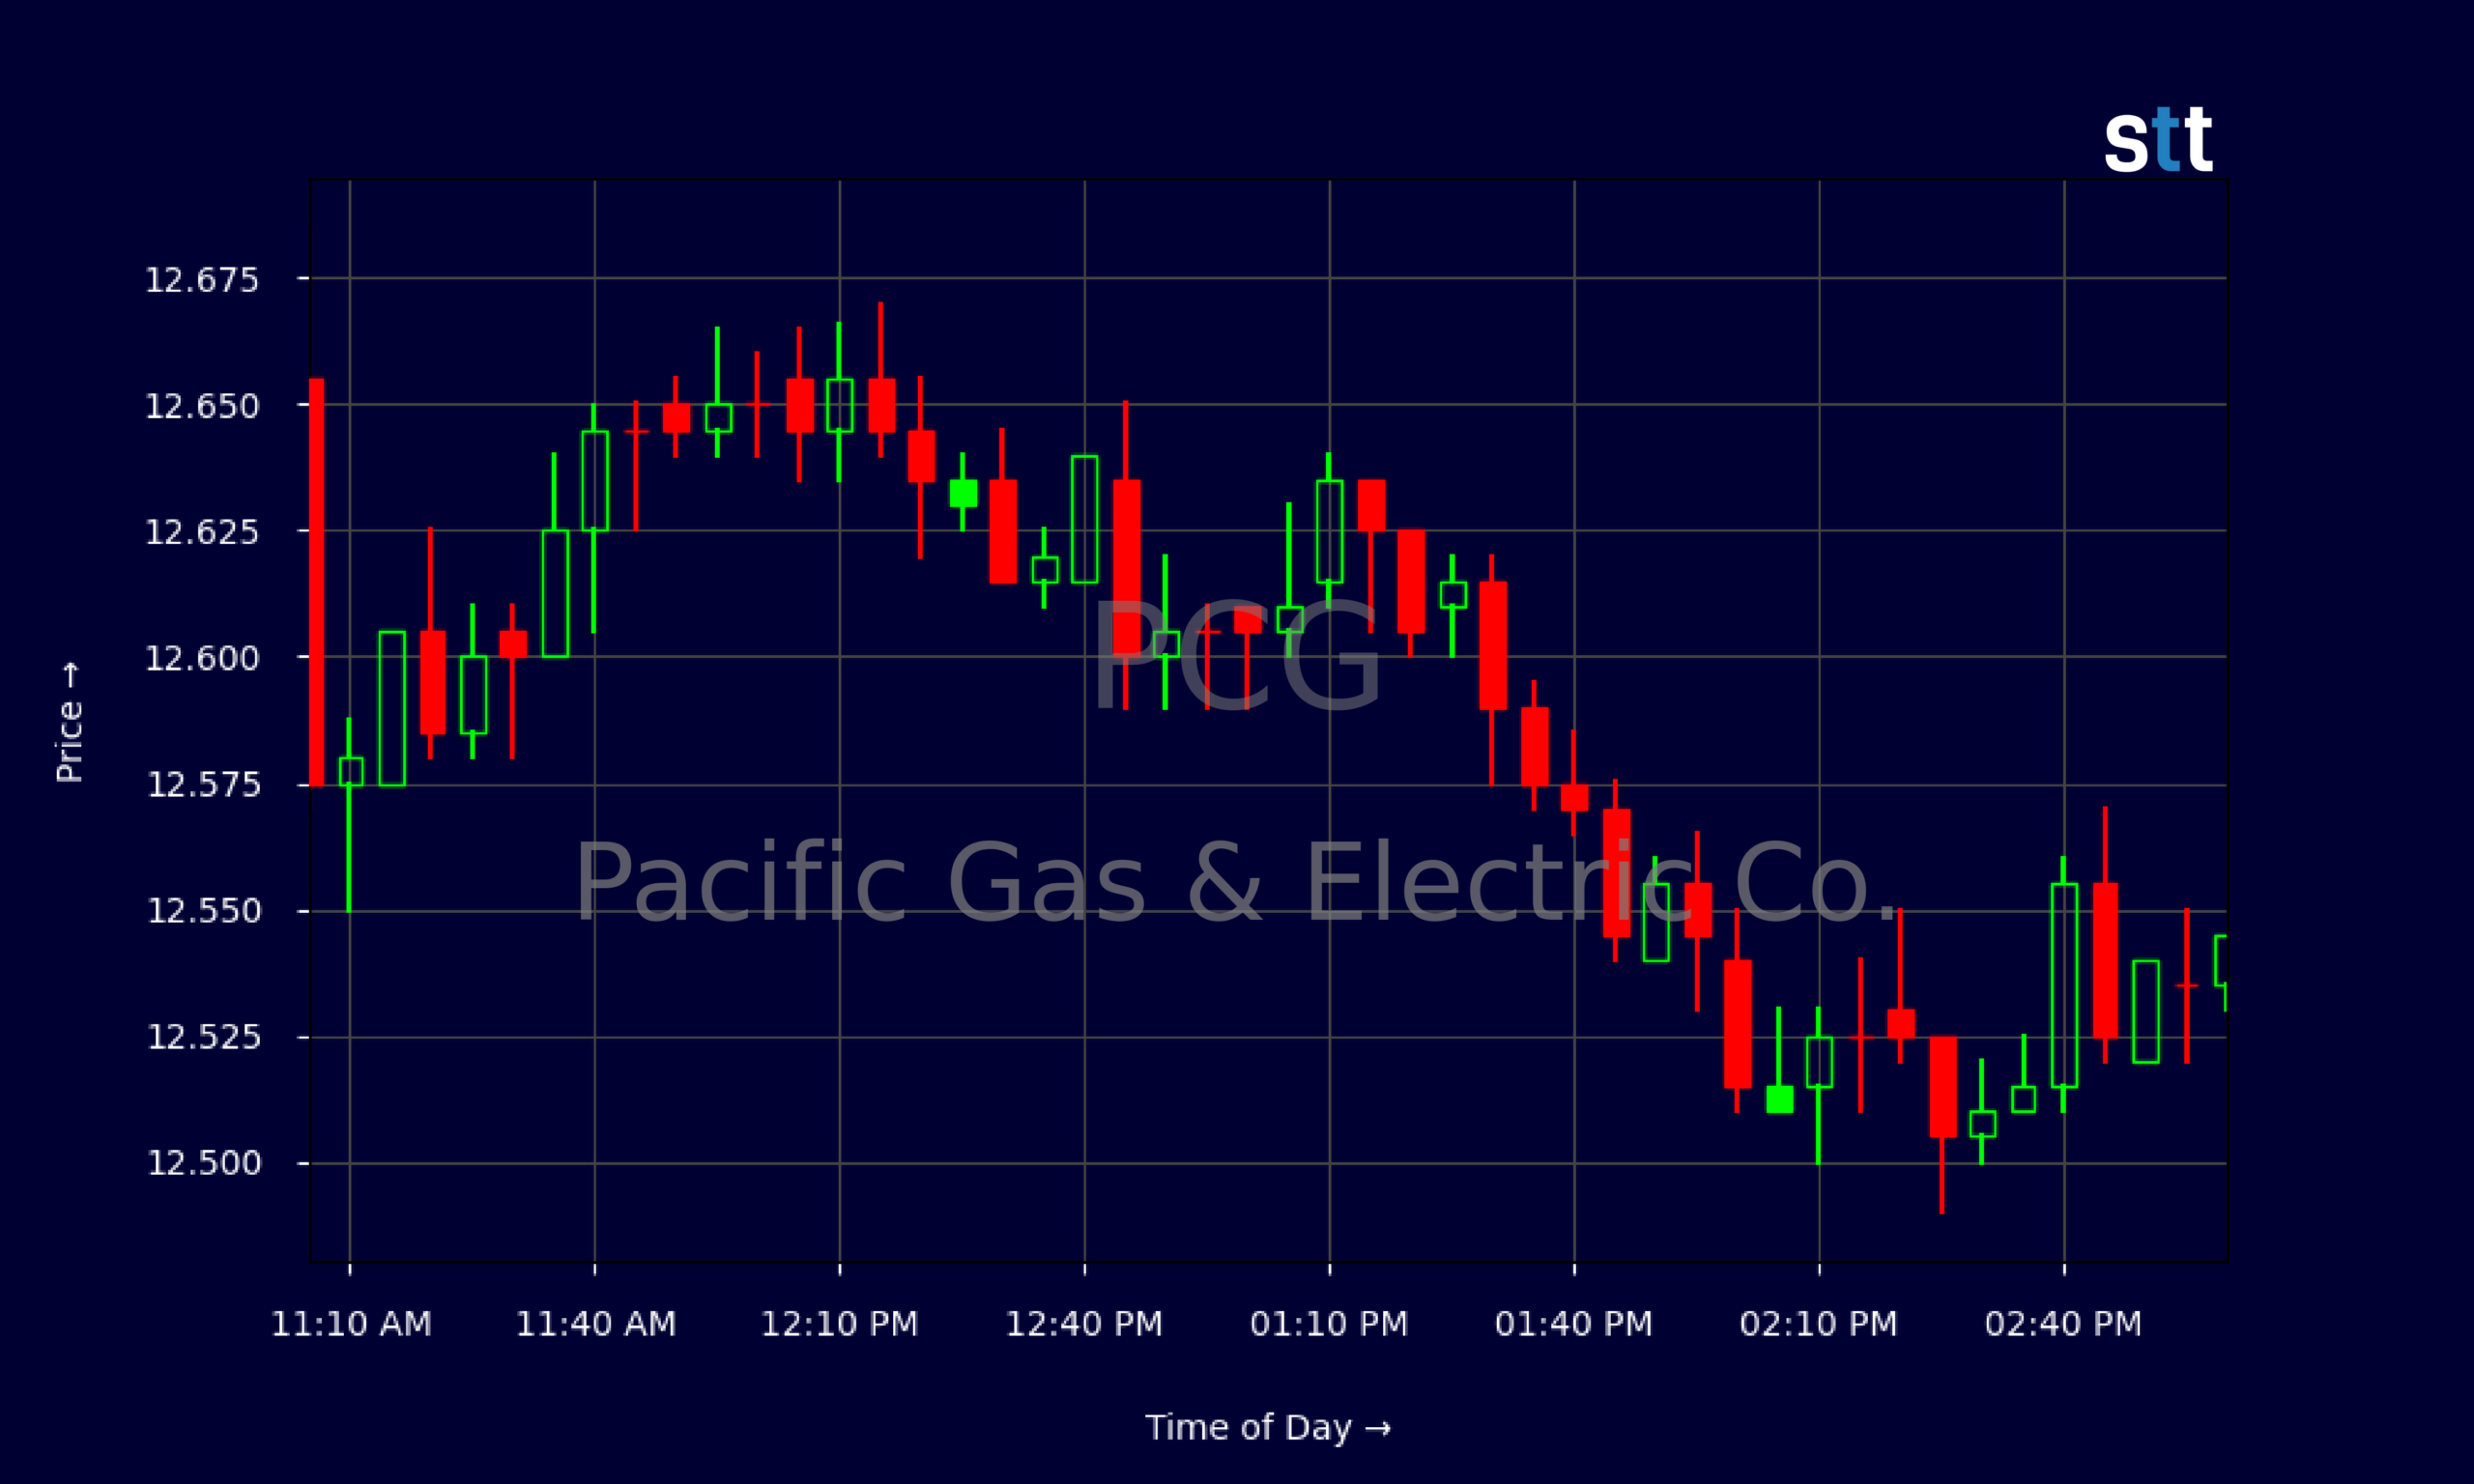
Live Update At 15:02:51 EDT: On Friday, October 23, 2026 Pacific Gas & Electric Co. stock [NYSE: PCG] is trending down by -3.43%! Discover the key drivers behind this movement as well as our expert analysis in the detailed breakdown below.
Quick Financial Overview
PCG is trading in a tight but clearly weakening range. Over the last couple of weeks, Pacific Gas & Electric Co. has faded from the mid-$13s to around $12.55, with the latest close at $12.545. That may sound like a small move, but for a slow, regulated utility, this kind of steady grind lower tells traders that sentiment has shifted.
The daily chart shows PCG failing multiple times near $13.30–$13.40 and then breaking down after the Q3 numbers. Intraday, the 5‑minute tape on 2026/10/23 is classic low‑volatility drift — PCG opened near $12.93 and bled lower most of the day, with very little bounce. That’s not what momentum longs want to see.
Fundamentally, PCG generated $6.188B in Q3 revenue and about $1.479B in EBIT, for an EBIT margin near 23%. Net income at $749M on 2.2B basic shares gives roughly $0.34 per share this quarter. Annualized, that makes the roughly $12–$13 share price work out to a price-to-earnings ratio near 9–10, which is not stretched for a utility.
More Breaking News
- MNDY Stock Pops As Harmony AI Launch Battles Barclays Downgrade
- CCI Stock Jumps As SpaceX Talks Ignite Growth Hopes
- Ondas Inc Stock Builds Momentum On Defense Orders And AI Push
- Infosys Stock Rises As Truist AI Deal Offsets Visa Headwinds
But debt is heavy. Total liabilities stand near $109.9B against $34.6B of equity, with long-term debt around $61.7B. Interest coverage at 1.9 times and a levered balance sheet mean PCG has very little room for error, especially when revenue growth disappoints.
Why Traders Are Watching PCG After The Selloff
The latest quarter for Pacific Gas & Electric Co. was a classic “meet earnings, miss revenue” setup — and the stock paid for it. PCG reported Q3 revenue of $6.19B, well below the $6.82B FactSet consensus. Adjusted earnings were in line, but Wall Street doesn’t reward a utility for hitting EPS when the top line underdelivers. That shortfall sparked a 2.7% drop as traders reassessed how much growth is really left in this story.
This slide didn’t come out of nowhere. In late 2026/09, UBS downgraded PCG from buy to neutral and chopped its price target from $19 to $14. The reaction was sharp: PCG sank 6.5% on one of those days, making it the worst-performing utilities name on the screen. That’s the kind of move momentum traders hunt — fast, clean re-pricing off a single catalyst.
UBS’s call also hit at a tricky time. On 2026/09/23, PCG dropped about 3.4% after the downgrade, even as energy prices were firm and the broader energy space was grinding higher. That divergence tells traders the issue is PCG-specific, not macro. In addition, utilities overall were soft, and yet the sheer size of the target cut — from $19 to $14 — made PCG stand out as a problem child.
For active traders, that combination matters. PCG now sits below the UBS target, weighed down by a revenue miss and heavy leverage, but supported by stable earnings and a roughly $0.20 annual dividend. That creates a tug-of-war: dip buyers eye a low P/E utility, while skeptics lean on every pop, betting the weak tape and cautious Wall Street tone will keep a lid on PCG rallies.
Conclusion
PCG is not trading like a sleepy utility right now. Pacific Gas & Electric Co. is dealing with a clear sentiment reset: a meaningful Q3 revenue miss, a 2.7% post-earnings pullback, and a major downgrade from UBS that knocked the stock down more than 6% in one session. Add in long-term debt north of $60B and interest coverage under 2 times, and traders have real reasons to demand a discount.
At the same time, PCG is still putting up solid profitability. An EBIT margin in the low‑20s, net income of $749M this quarter, and a P/E ratio around 9–10 give the bull side some ammo. The stock is hanging near book value, with price-to-book around 1.1, and PCG’s $0.05 quarterly dividend keeps yield-oriented traders at least somewhat engaged.
For short-term players, the key is simple: watch the levels. Recent resistance in the $13.20–$13.40 zone and support around $12.40–$12.50 frame the current battlefield for PCG. Breakouts or breakdowns from that range could attract fresh momentum.
Tim Sykes’s approach fits this tape well: “Cut losses quickly. Don’t fall in love with a thesis, fall in love with discipline.” As Tim Bohen, lead trainer with StocksToTrade says, “Success in trading is more about cutting losses quickly than finding winners.” For PCG, that means treating every bounce or flush as a trading setup, not a prediction of fair value. This article is for educational and research purposes only and is not investment advice.
This is stock news, not investment advice. StocksToTrade News delivers real-time stock market updates tailored to highlight the key catalysts driving short-term price movements. Our coverage is designed for active traders and investors who thrive in fast-moving markets, with a focus on volatile sectors like penny stocks, AI stocks, Robinhood stocks and other momentum plays. From earnings reports and FDA approvals to mergers, new contracts, and unusual trading volume, we break down the events that can spark significant price action.
Looking to level up your trading game? Explore StocksToTrade, the ultimate platform for traders. With powerful tools designed for swing and day trading, integrated news scanning, and even social media monitoring, StocksToTrade keeps you one step ahead.
Check out our quick startup guide for new traders!
- How to Read Stock Charts: A Guide for Beginners
- Trading Plan: 6 Steps to Create One
- How To Create a Stock Watchlist
Ready to build your watchlists? Check out these curated lists:
Once your watchlist is set, take the next step and trade with confidence using StocksToTrade’s robust platform. Don’t miss out — grab your 14-day trial for just $7 and experience the edge you need to thrive in today’s fast-paced markets.