
Opendoor Technologies Inc stocks have been trading down by -4.04 percent amid bearish sentiment over weakening housing market demand.
Click Here for a Millionaire's POV on Trading OPEN
SUBSCRIBE FOR ALERTSJOIN 50,000+ ACTIVE TRADERS
Key Takeaways
- Shares have slipped from above $2.50 to under $2.00, putting Opendoor Technologies Inc back near key support levels.
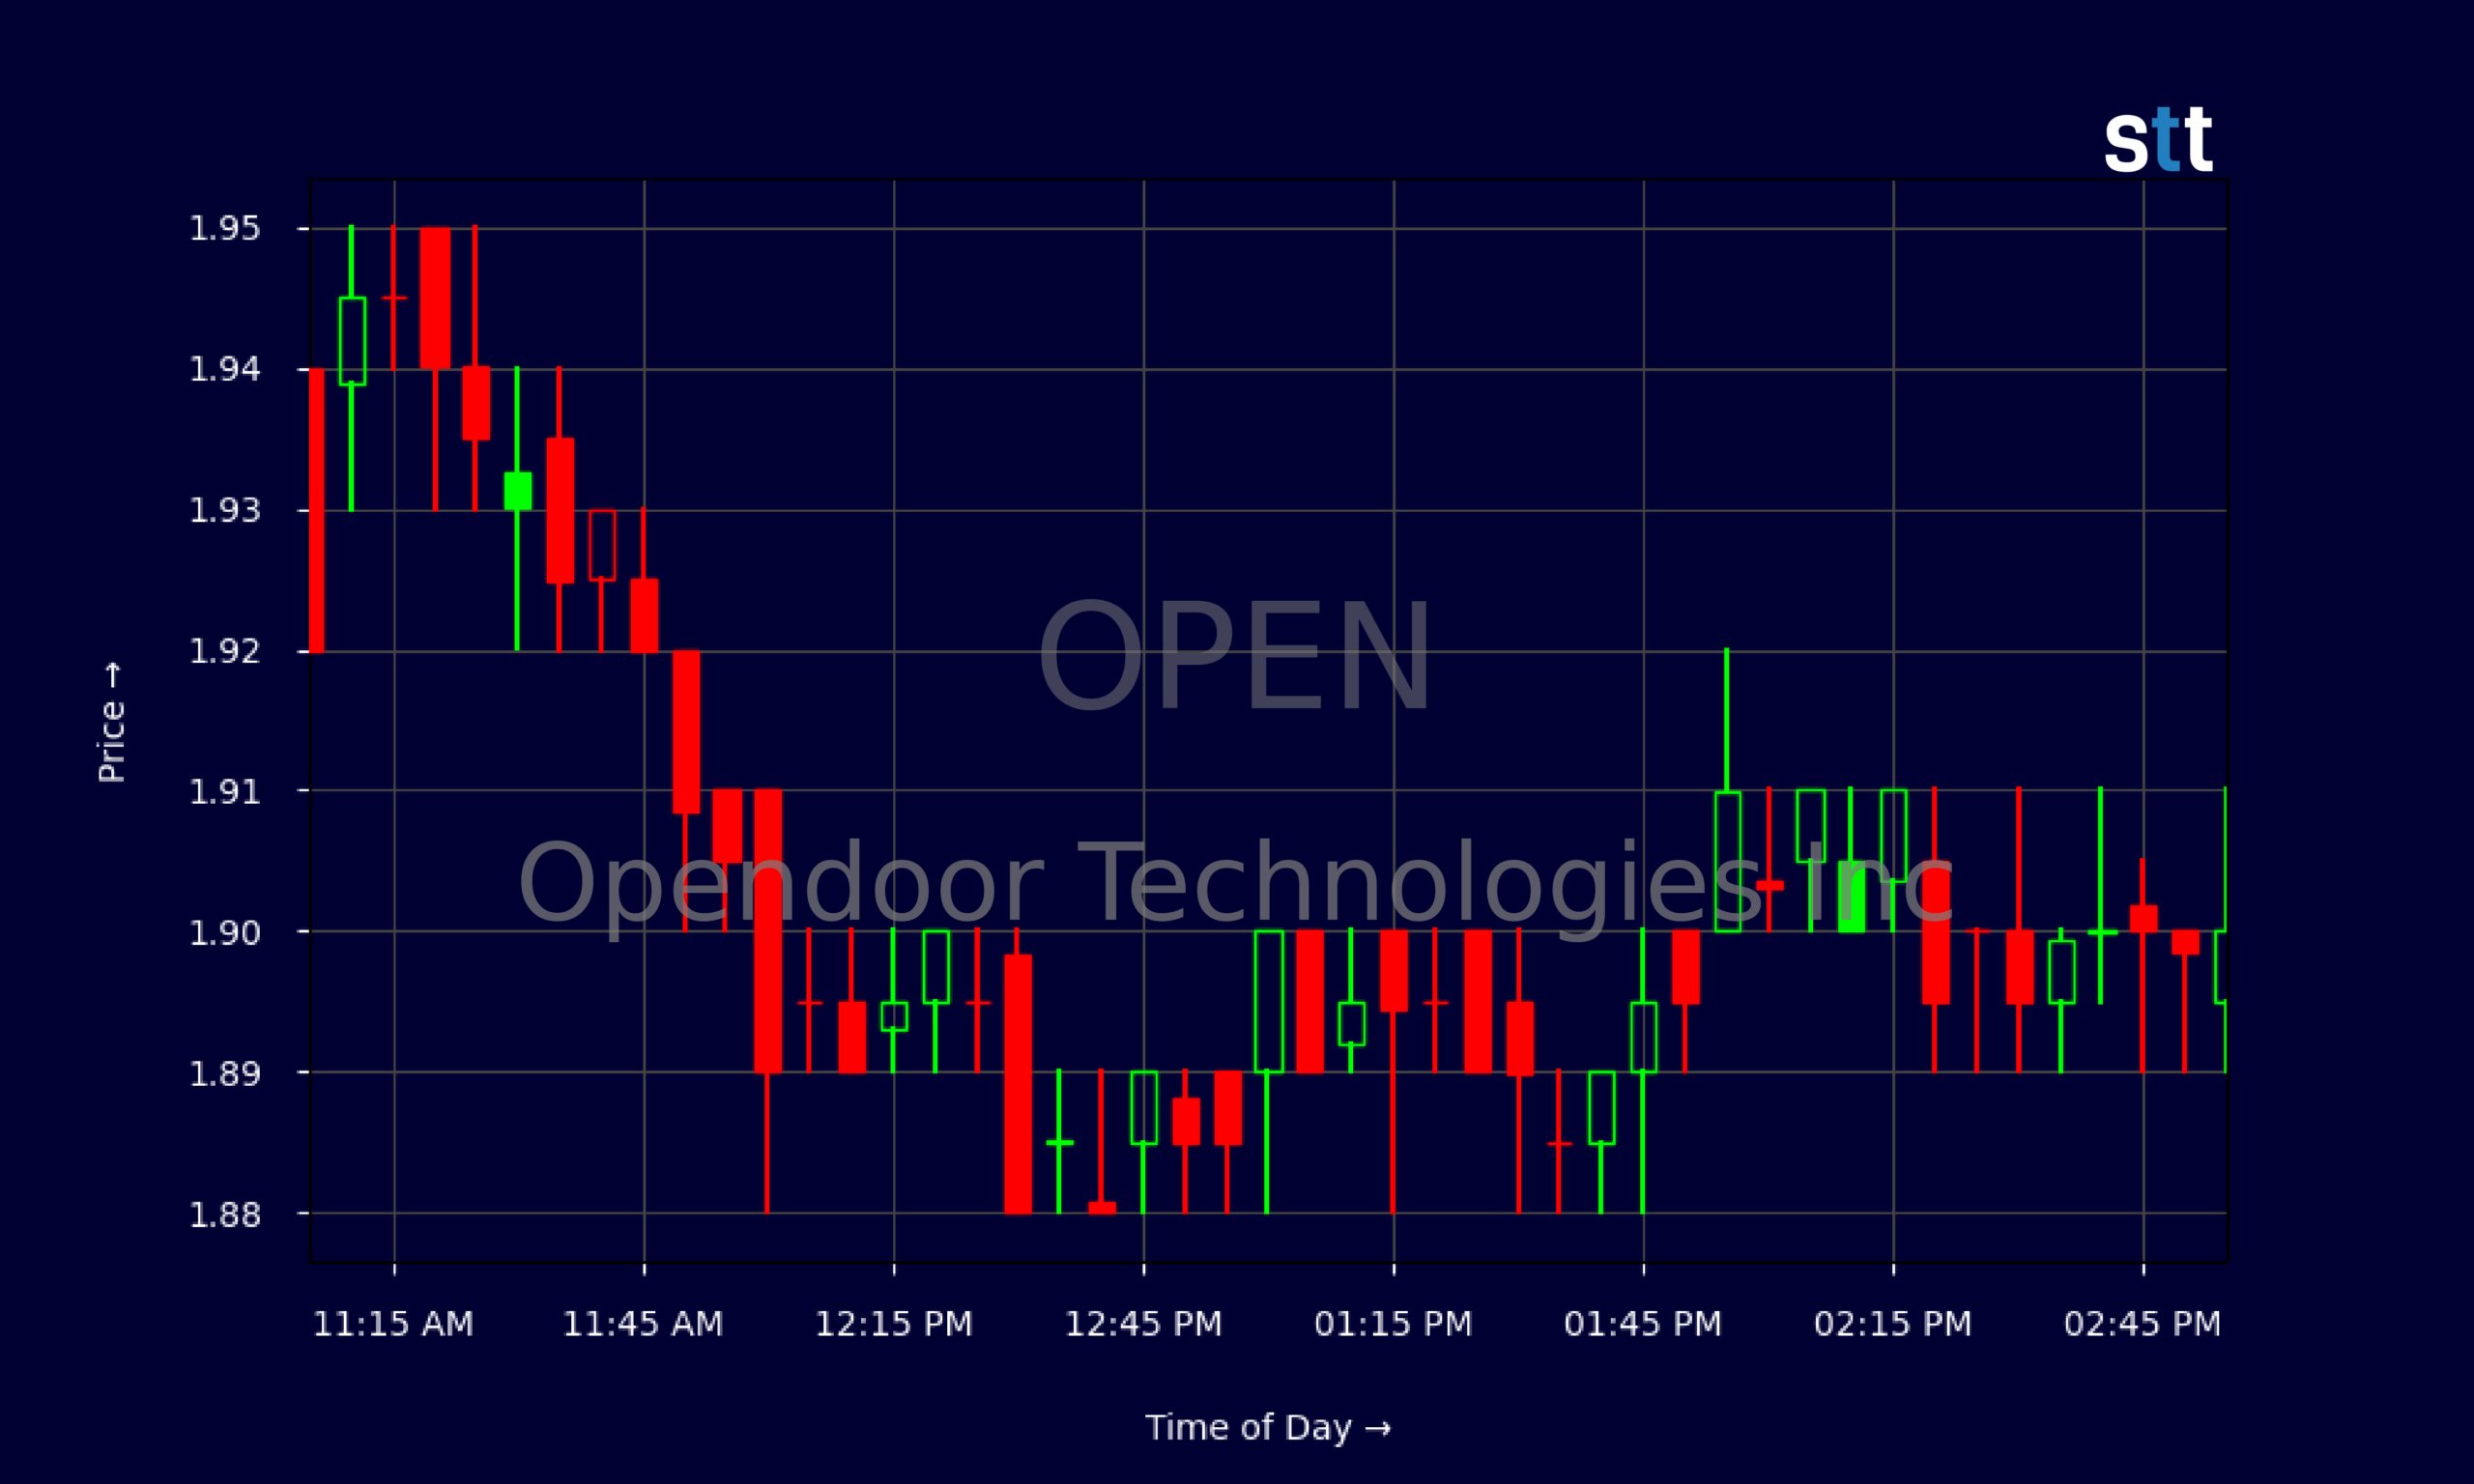
- Intraday action in OPEN shows tight consolidation around $1.90, signaling indecision and shrinking volatility.
- The latest quarter shows $4.37B in revenue but heavy losses and negative margins for OPEN.
- Opendoor Technologies Inc holds $896M in cash but carries over $1.9B in debt and lease obligations.
- Traders are tracking whether OPEN can stabilize and build a base after this multi-week drawdown.
Live Update At 15:02:16 EDT: On Monday, October 26, 2026 Opendoor Technologies Inc stock [NASDAQ: OPEN] is trending down by -4.04%! Discover the key drivers behind this movement as well as our expert analysis in the detailed breakdown below.
Quick Financial Overview
Opendoor Technologies Inc is a classic high-revenue, high-burn story. OPEN generated about $4.37B in revenue over the trailing year, yet the company still runs with thin gross margins around 8.6% and deep net losses near -47%. That tells traders one thing: scale has not yet translated into sustainable profitability.
In the latest reported quarter ending 2026/06/30, OPEN pulled in $883M in total revenue but still posted a net loss of $162M and an EBITDA loss of about $124M. Operating income was negative $141M, which lines up with the ugly EBIT margin of roughly -43%. For a low-priced stock, this combo of big revenue and big losses often fuels volatility.
More Breaking News
- AXTI Stock Jumps As Traders Pile In Ahead Of Earnings
- SPRC Stock Draws Traders As SciSparc Pushes Trials And AI Pivot
- HTZ Stock Wobbles As Morgan Stanley Slashes Price Target
- META Stock Draws Wave Of Price Target Hikes On AI Momentum
On the balance sheet, Opendoor Technologies Inc shows $2.85B in current assets, including $896M in cash and $1.85B in inventory. Current liabilities sit at $968M, giving OPEN solid working capital. But leverage is real: long‑term debt runs about $1.07B and total debt to equity is roughly 2.15. For traders, that means any slowdown in home turnover or pricing can hit both earnings and balance-sheet flexibility, and the market will react fast.
Why Traders Are Watching OPEN Price Action
Opendoor Technologies Inc has spent October in a steady downtrend. The daily chart shows OPEN fading from the $2.50 range at the start of the month to roughly $1.90 by 2026/10/26. That’s a pullback of about 25% in a few weeks. For active traders, these kinds of moves are where opportunity and risk live side by side.
Look closely at the recent candles. Early in the month, OPEN was still printing closes between $2.30 and $2.50, with decent intraday ranges. As selling pressure built, highs started to roll over: $2.44, then $2.31, then low $2.20s. By the last few days, OPEN is bouncing between $1.84 and $2.03, with closes under $2.00 and multiple red days stacked together. That’s a textbook momentum fade.
Now zoom into the intraday 5‑minute chart. Most of the day is spent chopping around $1.88–$1.92, with a morning dip under $1.85 and no real push back toward the open at $1.96. That kind of tight range and weak bounce tells traders that short‑term demand is cautious. There’s no aggressive bid stepping in yet.
At the same time, the risk‑reward is shifting. OPEN trades at about 0.66 times sales and roughly 2.36 times book value. Those numbers won’t rescue a broken chart on their own, but they do show how much pessimism is now baked into Opendoor Technologies Inc. If buyers finally defend this $1.80–$1.90 area, traders could get a clean bounce setup. If that zone fails, the trend down can accelerate fast, especially with OPEN’s negative returns on equity and assets hanging over the story.
Conclusion
For active traders, OPEN sits at a crossroads. The chart says downtrend, with lower highs from $2.53 to sub‑$2.00 and daily closes now camping near the lows. The intraday tape reinforces that message: Opendoor Technologies Inc spent most of the session grinding sideways around $1.90 with no decisive push. That’s classic late‑stage selling pressure and tired buyers.
The fundamentals back up the caution. OPEN is moving billions of dollars in homes but doing it with thin gross margins and steep net losses. Free cash flow was roughly -$723M in the latest quarter, and operating cash flow was sharply negative as well. To plug that hole, Opendoor Technologies Inc leaned on debt markets, issuing about $623M in new debt. That keeps the lights on, but it also raises the stakes if the housing market cools.
Still, this is exactly the kind of beaten‑down chart traders in the Tim Sykes community study daily. As Tim Sykes likes to remind traders, “Patterns repeat because human nature doesn’t change. Your job is to recognize the pattern and manage your risk.” As Tim Bohen, lead trainer with StocksToTrade says, “The best way to learn is by tracking trades, wins, losses, and lessons learned. Every trade has something to teach.”. With OPEN, that means mapping clear levels, tracking volume, and cutting losses quickly if support breaks.
If Opendoor Technologies Inc can hold this $1.80–$1.90 zone and start printing higher lows, short‑term bounce trades may set up. If not, traders should treat every failed bounce as a warning shot, not a surprise. This is education and research territory, not a blind gamble.
This is stock news, not investment advice. StocksToTrade News delivers real-time stock market updates tailored to highlight the key catalysts driving short-term price movements. Our coverage is designed for active traders and investors who thrive in fast-moving markets, with a focus on volatile sectors like penny stocks, AI stocks, Robinhood stocks and other momentum plays. From earnings reports and FDA approvals to mergers, new contracts, and unusual trading volume, we break down the events that can spark significant price action.
Looking to level up your trading game? Explore StocksToTrade, the ultimate platform for traders. With powerful tools designed for swing and day trading, integrated news scanning, and even social media monitoring, StocksToTrade keeps you one step ahead.
Check out our quick startup guide for new traders!
- How to Read Stock Charts: A Guide for Beginners
- Trading Plan: 6 Steps to Create One
- How To Create a Stock Watchlist
Ready to build your watchlists? Check out these curated lists:
Once your watchlist is set, take the next step and trade with confidence using StocksToTrade’s robust platform. Don’t miss out — grab your 14-day trial for just $7 and experience the edge you need to thrive in today’s fast-paced markets.