
Opendoor Technologies Inc faces pressure as negative real estate market headlines weigh on investor sentiment, with stocks trading down by -5.58 percent.
Click Here for a Millionaire's POV on Trading OPEN
SUBSCRIBE FOR ALERTSJOIN 50,000+ ACTIVE TRADERS
Key Takeaways
- Shares of OPEN have slipped from the $2.50 area to under $2.00, showing a clear short‑term downtrend on the daily chart.
- Intraday trading in OPEN is tight and choppy around $2.00, signaling consolidation after recent weakness and a battle between dip buyers and short sellers.
- Opendoor Technologies Inc is posting steep losses, with negative margins and heavy cash burn offset by a solid cash pile near $900M.
- High leverage, negative returns on equity, and ongoing operating losses keep OPEN squarely in turnaround territory, drawing in active momentum traders.
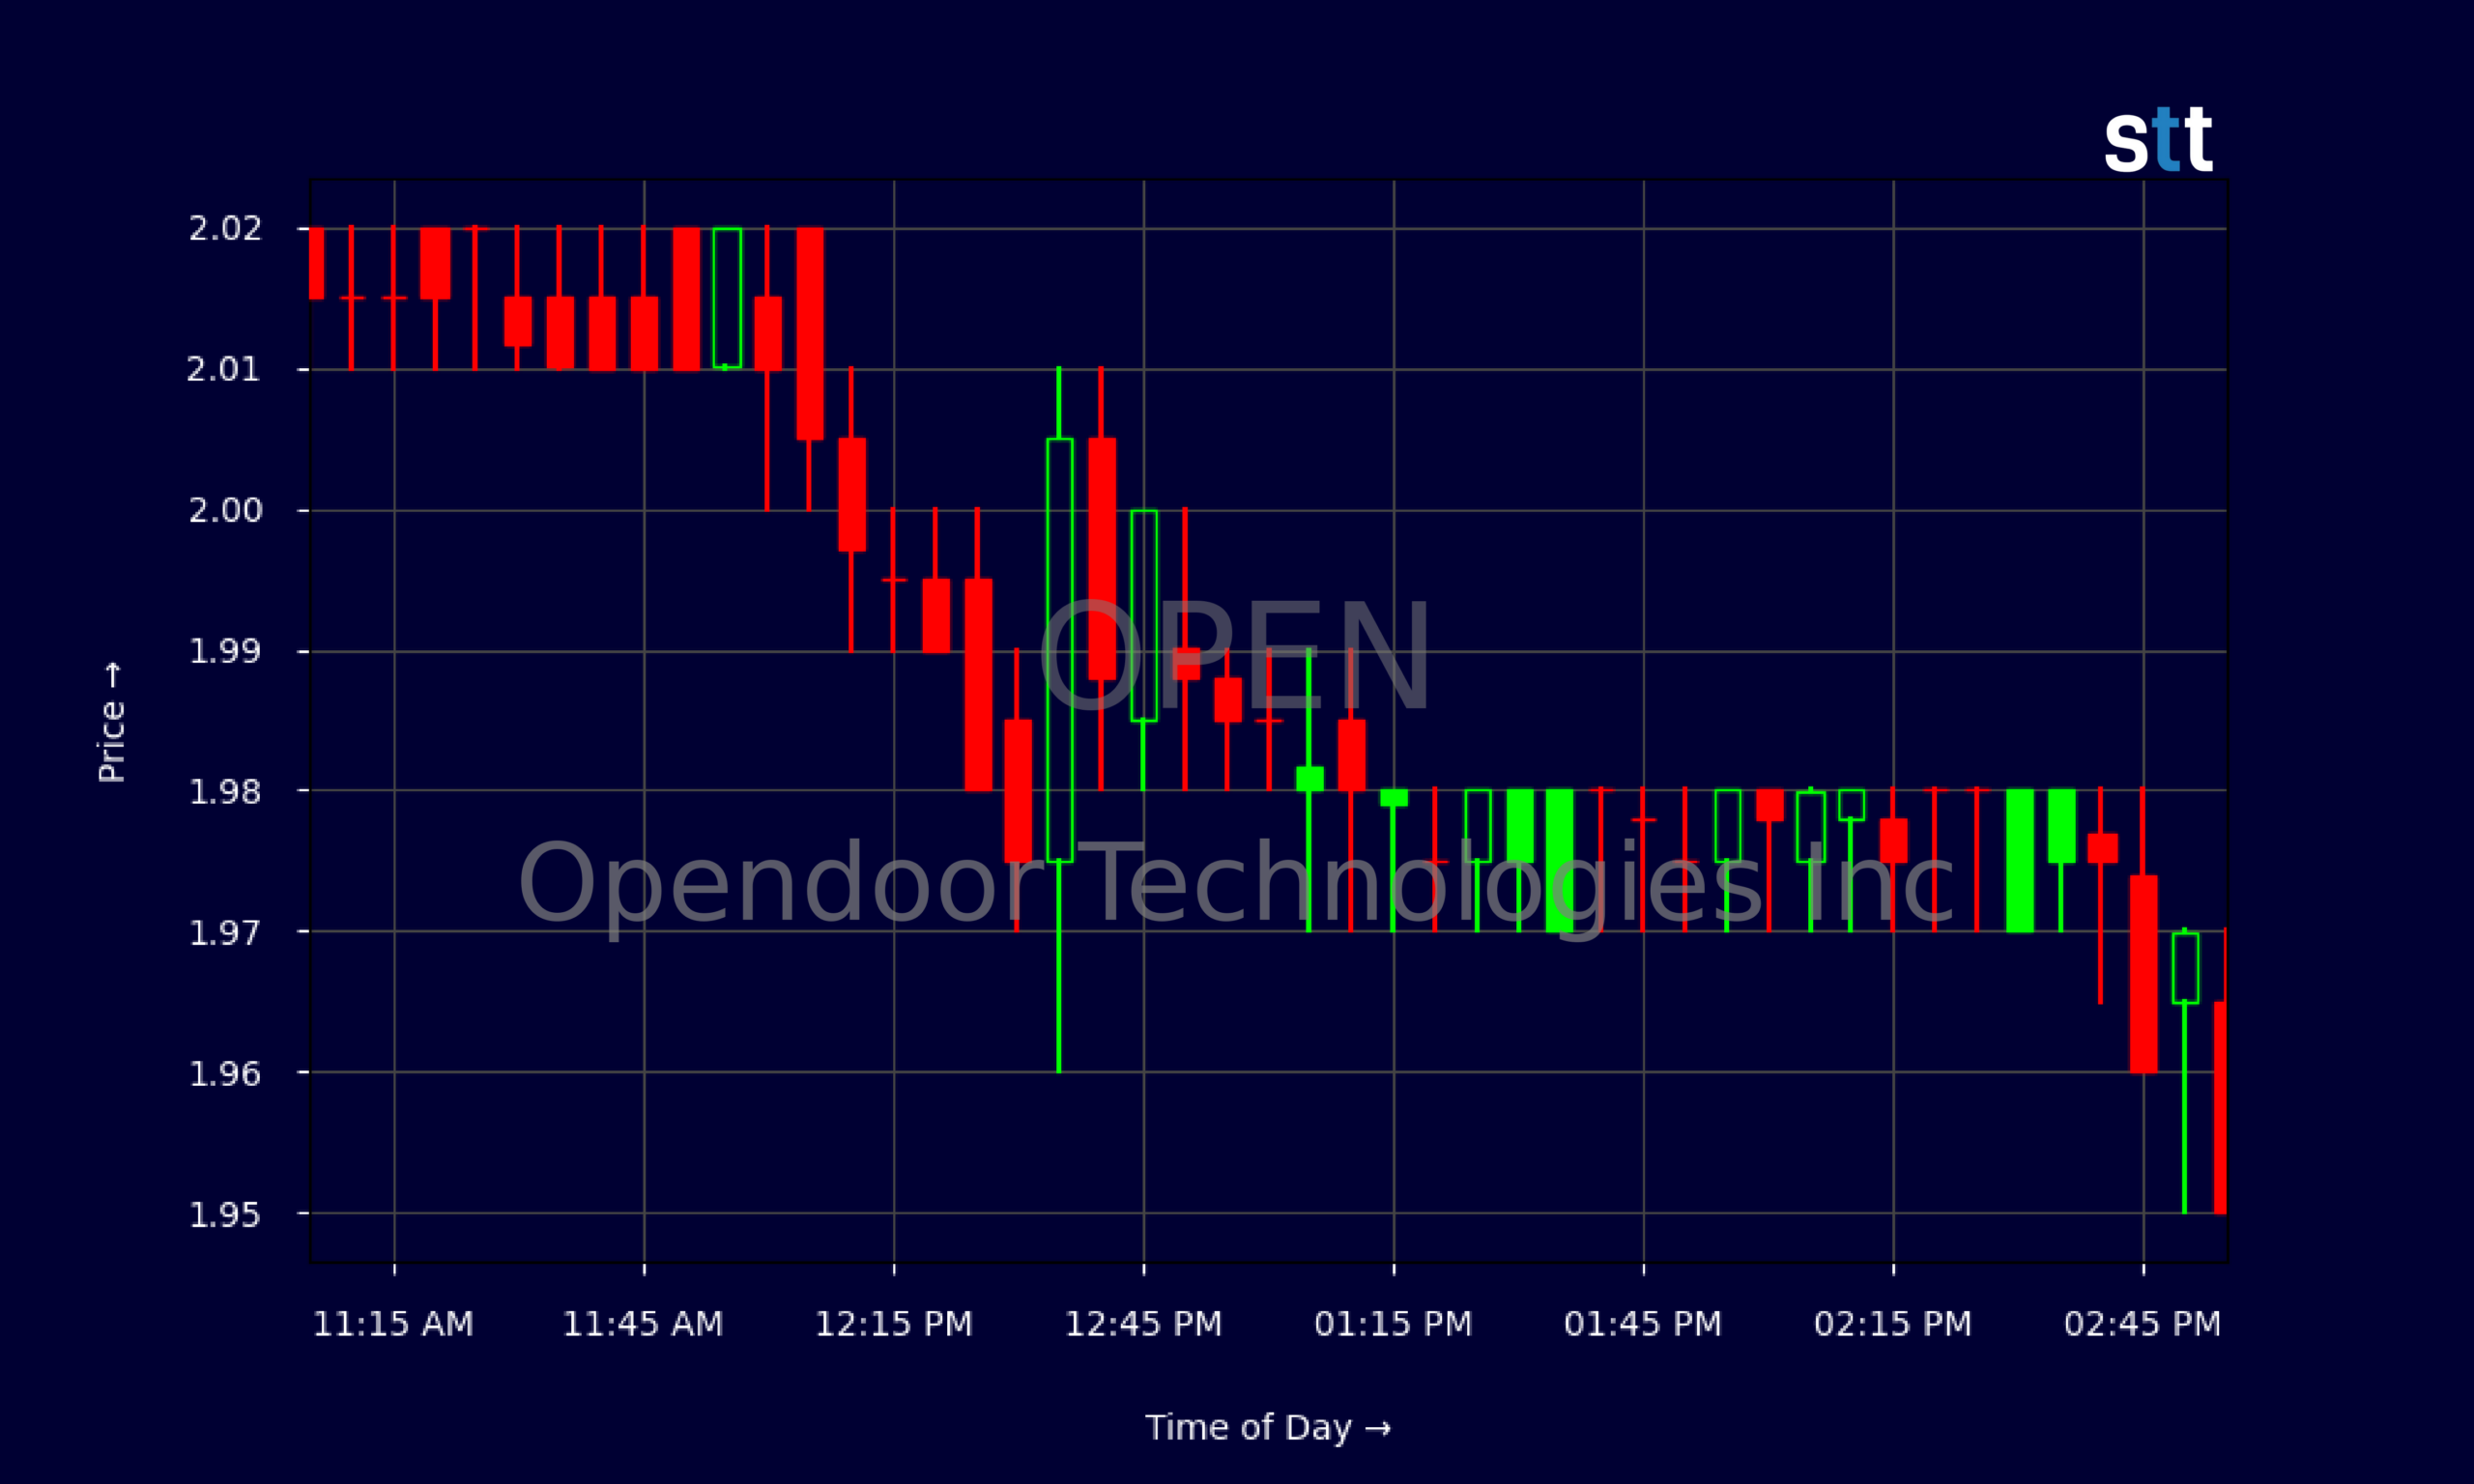
Live Update At 15:02:07 EDT: On Wednesday, October 21, 2026 Opendoor Technologies Inc stock [NASDAQ: OPEN] is trending down by -5.58%! Discover the key drivers behind this movement as well as our expert analysis in the detailed breakdown below.
Quick Financial Overview
Opendoor Technologies Inc is still a high‑risk story, and the numbers back that up. OPEN generated about $4.37B in revenue over the last year, which is huge for a sub‑$5 stock. But the company is bleeding on the bottom line. Profit margins are deeply negative, with an EBIT margin around -43% and overall profit margin near -47%. That means OPEN gives up a lot more than it keeps on every dollar of sales.
The latest quarterly report shows revenue of $883M but a net loss of $162M, or about -$0.17 per share. EBITDA is also negative. On the cash side, OPEN burned roughly $718M from operations in that quarter and free cash flow was about -$723M. That is a serious outflow.
More Breaking News
- SAIQ Stock Reverses Hard After 260% Speculative Spike
- AHT Stock Pops As Fee Waiver And Buyback Pledge Ease Dilution Fears
- TeraWulf Stock Draws Bold Targets As AI Power Deals Scale Up
- Nebius Group NBIS Stock Jumps As AI Cloud Momentum Builds
Yet Opendoor Technologies Inc still has a decent buffer. The balance sheet lists around $896M in cash and $1.84B in home inventory, plus a current ratio of roughly 2.9. Debt is heavy, with total debt‑to‑equity above 2, and returns on equity are sharply negative. For traders, OPEN is a classic “big revenue, big losses” name where sentiment can swing fast.
Why Traders Are Watching OPEN Price Action
For active traders, OPEN is all about the chart and the volatility around that $2.00 zone. On the daily timeframe, Opendoor Technologies Inc has been sliding from late‑September highs near $2.50 down to recent closes around $1.95. That drop of roughly 20% in a few weeks tells you sellers are in control. Each bounce has been getting sold, with lower highs stacking up across the last several sessions.
Zoom in to today’s intraday tape, and the story shifts from trend to compression. OPEN has spent hours pinned between roughly $1.94 and $2.02, with most 5‑minute candles showing tiny bodies and narrow wicks. That’s textbook consolidation after a pullback. Volume‑weighted action hugs $2.00, telling traders this is the current battleground level.
For short‑term momentum setups, this type of action in Opendoor Technologies Inc is exactly what many in the Tim Sykes community stalk. A clean break above the intraday range high can trap shorts and trigger a quick push toward prior resistance near $2.10–$2.15. A break below $1.94 opens the door for a flush toward recent lows.
At the same time, the fundamentals around OPEN make many traditional players cautious, which can amplify emotional trading on headlines or macro moves. Weak margins, high leverage, and big cash burn mean any hint of good or bad macro housing data can spark outsized moves. That cocktail of risk and liquidity is why traders keep OPEN on their screens.
Conclusion
Opendoor Technologies Inc sits at a crossroads where ugly fundamentals meet tradable volatility. The company brings in billions in revenue but continues to post large losses, negative returns, and heavy operating cash burn. OPEN offsets that with a sizable cash pile, strong working capital, and plenty of inventory, but the capital structure is stretched and the business still has a lot to prove.
On the chart, OPEN is stuck under recent highs and grinding lower, yet intraday ranges around $2.00 are getting tighter. That combo often comes before a stronger directional move. Short sellers see a structurally weak balance between debt and profitability. Dip buyers focus on the lean price‑to‑sales ratio and the chance of sharp squeezes once momentum flips.
For traders, the lesson from OPEN is discipline. Respect the trend, map the key levels, and remember what Tim Sykes loves to repeat: “The market doesn’t care about your opinion, only about your risk management.” Equally important is the mindset side of trading—accepting that not every move can be captured and that sitting on your hands is often a valid choice. As Tim Bohen, lead trainer with StocksToTrade says, “Time and experience have taught me that missed opportunities are part of the game. There’s always another setup around the corner.” Opendoor Technologies Inc will keep generating opportunities, but it rewards those who plan their trades, cut losses quickly, and never confuse a trading setup with long‑term safety. This analysis is for educational and research purposes only, not investment advice.
This is stock news, not investment advice. StocksToTrade News delivers real-time stock market updates tailored to highlight the key catalysts driving short-term price movements. Our coverage is designed for active traders and investors who thrive in fast-moving markets, with a focus on volatile sectors like penny stocks, AI stocks, Robinhood stocks and other momentum plays. From earnings reports and FDA approvals to mergers, new contracts, and unusual trading volume, we break down the events that can spark significant price action.
Looking to level up your trading game? Explore StocksToTrade, the ultimate platform for traders. With powerful tools designed for swing and day trading, integrated news scanning, and even social media monitoring, StocksToTrade keeps you one step ahead.
Check out our quick startup guide for new traders!
- How to Read Stock Charts: A Guide for Beginners
- Trading Plan: 6 Steps to Create One
- How To Create a Stock Watchlist
Ready to build your watchlists? Check out these curated lists:
Once your watchlist is set, take the next step and trade with confidence using StocksToTrade’s robust platform. Don’t miss out — grab your 14-day trial for just $7 and experience the edge you need to thrive in today’s fast-paced markets.