

Ondas Inc faces heightened pressure as critical drone-network contract setbacks emerge, with stocks have been trading down by -9.49 percent.
Key Takeaways
- ONDS has faded from recent highs near $7 and is now trading around the mid-$5s, showing a clear short-term pullback on the daily chart.
- Intraday action in ONDS shows tight consolidation between $5.25 and $5.75, signaling a battle between dip-buyers and profit-takers.
- Ondas Inc carries strong liquidity, with current and quick ratios near 10 and 8.5, giving traders confidence the company can weather ongoing cash burn.
- Revenue growth at Ondas Inc has surged triple digits over three and five years, but ONDS still posts sizable quarterly losses and negative free cash flow.
- With a high price-to-sales multiple and negative cash flow, traders in ONDS are paying for growth and potential momentum, not current earnings strength.
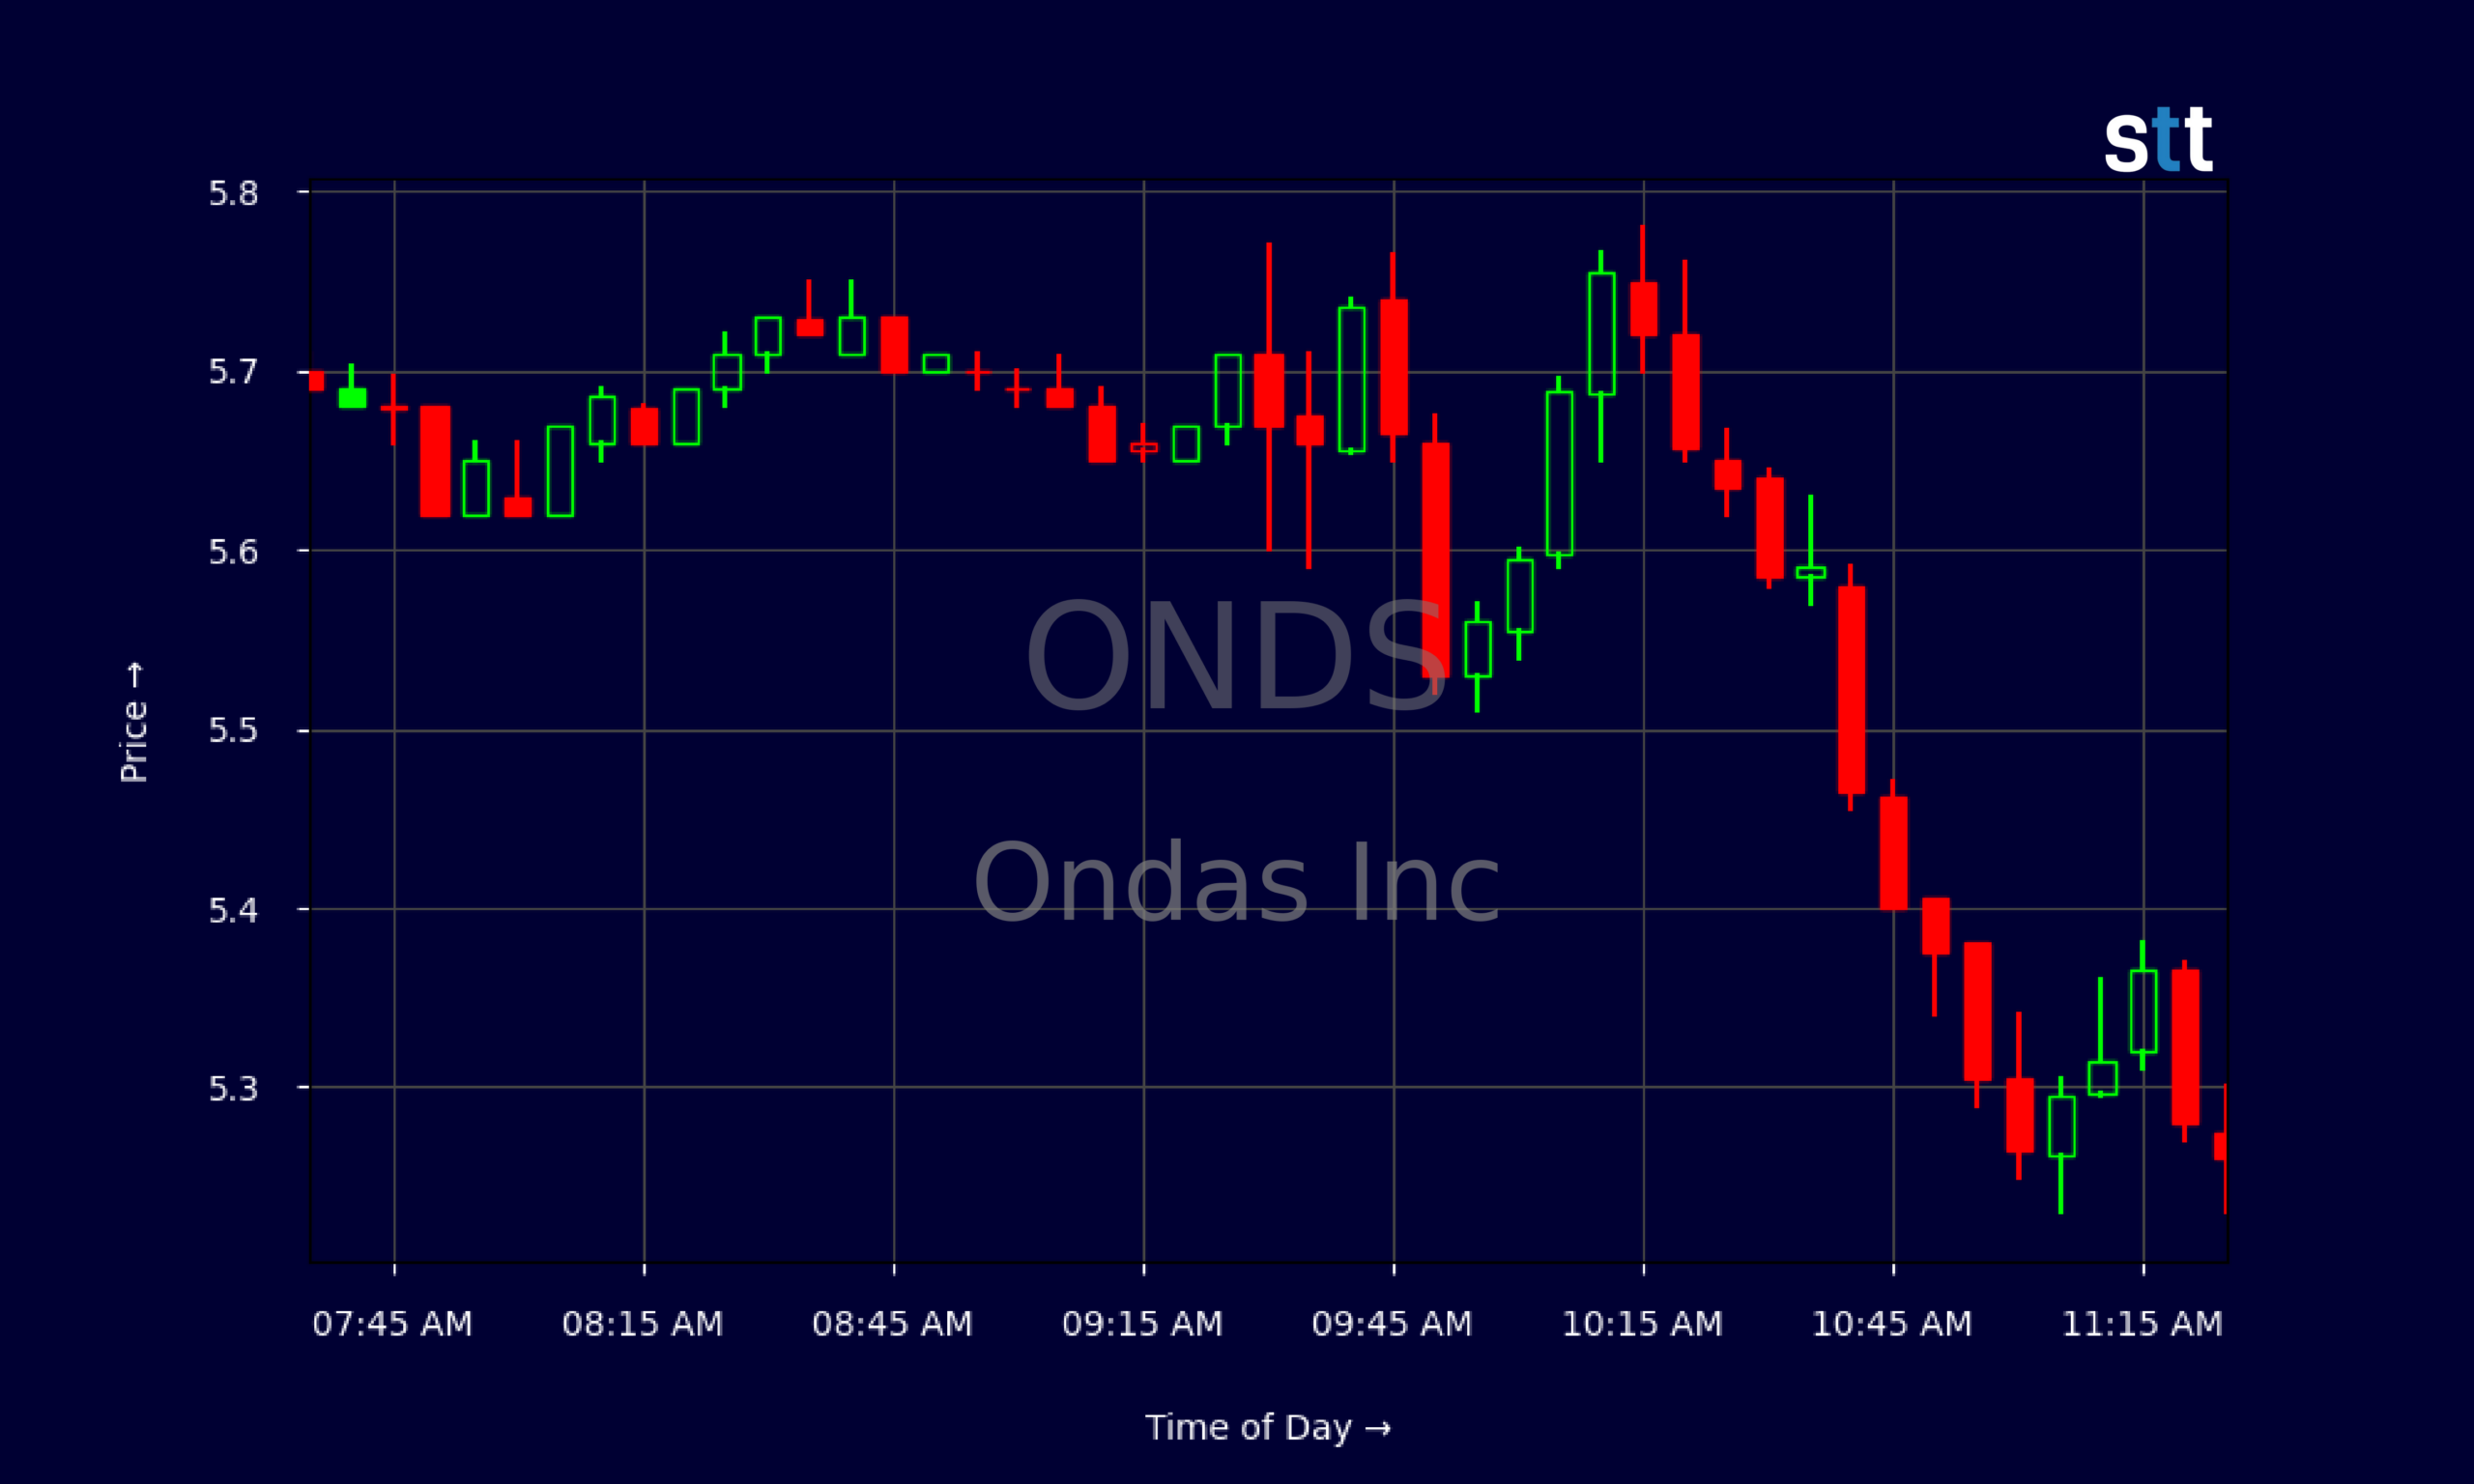
Live Update At 11:32:06 EST: On Wednesday, November 04, 2026 Ondas Inc stock [NASDAQ: ONDS] is trending down by -9.49%! Discover the key drivers behind this movement as well as our expert analysis in the detailed breakdown below.
Quick Financial Overview
Ondas Inc gives traders a classic high-growth, high-burn profile. ONDS posted roughly $50.7M in revenue, with revenue growth running over 120%–160% across three to five years. That kind of acceleration grabs attention. But the income statement shows the other side of the trade. ONDS delivered about $83.8M in quarterly revenue in its recent filing yet still booked a net loss near $88.6M and an operating loss over $140M.
For active traders, that mismatch between strong top-line growth and heavy losses is key. ONDS shows strong gross margins around 44%, meaning the core business can generate solid spread between sales and direct costs. The problem sits in operating expenses, especially selling, general and administrative costs and research and development.
On the balance sheet, Ondas Inc looks much healthier. ONDS holds about $1.38B in cash and short-term investments against minimal debt, with total debt-to-equity near zero and a current ratio close to 9.9. That tells traders the company has room to keep funding growth and losses without an immediate liquidity crunch.
More Breaking News
- Wetour Robotics Limited Falls 4% as Slide Continues
- Opendoor Stock Steadies As New Director And Q&A Event Draw Trader Focus
- SOFI Stock Slips As Analyst Warns Of $1B Headwind
- BitMine Immersion Technologies Falls 2% Today
Valuation-wise, ONDS trades at a rich price-to-sales ratio above 22 and price-to-book around 2.5, signaling the market is already pricing in aggressive future progress. For momentum traders, that can be fuel if price action heats up — or a warning if growth stalls.
Why Traders Are Watching ONDS Price Action
The chart on ONDS tells a story every active trader will recognize. In mid-recent sessions, Ondas Inc shares pushed above $7, printing highs around 7.08 before fading. From there, ONDS rolled over, with the most recent daily close near 5.30 after tagging a low around 5.23. That is a meaningful retrace from the top of the range and shows clear selling pressure.
Look at the daily candles. ONDS went from steady closes in the mid-to-high $6s — 6.67, 6.71, 6.88 — to a sequence of lower highs and lower lows down into the low-$5s. That is a textbook short-term downtrend. For traders, the question is simple: is ONDS just pulling back to reload, or is momentum fading for real?
Zoom into the intraday 5-minute chart, and the picture tightens. Pre-market, Ondas Inc held around 5.85–5.90, then the regular session opened just under 5.75 and walked down into the 5.20–5.30 zone. From 10:00 to 11:30, ONDS carved a tight band mostly between 5.25 and 5.40, with quick pops toward 5.60 stalling out. That kind of intraday consolidation after a drop often marks a decision zone.
Short-bias traders will view ONDS as a broken short-term chart until it reclaims prior support in the mid-$6s and holds there. Long-biased momentum traders will instead watch to see if ONDS can defend that 5.20–5.30 area and build a higher low. When a stock with strong revenue growth and a huge cash balance like Ondas Inc compresses in a tight intraday range, breakouts — up or down — can be fast and violent.
For those who like to trade levels, ONDS now has a clear resistance band around 5.70–5.80 from the morning fade, and a clear support band near 5.20–5.30 from multiple intraday bounces. Whichever side breaks with volume is likely to define the next move.
Conclusion
For active traders, ONDS sits at an important fork in the road. The fundamentals of Ondas Inc show a cash-rich balance sheet, minimal leverage, and big revenue growth, but also deep operating losses and heavy cash burn. That mix often creates big range in the stock price, because trading sentiment swings hard between “growth story” and “expense problem.”
On the chart, ONDS has stepped down from $7+ to the low-$5s, but it has not fully collapsed. Daily action shows a controlled pullback, and intraday action shows tight consolidation. That tells disciplined traders to prepare, not predict. ONDS can easily snap back toward $6–$7 if buyers rush in, or slide into new lows if that 5.20 area gives way.
The key is to treat Ondas Inc like any volatile momentum name — respect the levels and manage risk. As Tim Sykes loves to remind traders, “Cut losses quickly, because big losses always start out as small ones.” Equally important, as Tim Bohen, lead trainer with StocksToTrade says, “The best trades are the ones you can make without emotion. Plan it, then execute it as if it’s routine.” For anyone following ONDS, that rule matters more than any ratio, narrative, or headline. The setup is there. It is up to each trader to map a plan, size correctly, and let the price action do the talking.
This article is for educational and research purposes only and is not investment advice.
This is stock news, not investment advice. StocksToTrade News delivers real-time stock market updates tailored to highlight the key catalysts driving short-term price movements. Our coverage is designed for active traders and investors who thrive in fast-moving markets, with a focus on volatile sectors like penny stocks, AI stocks, Robinhood stocks and other momentum plays. From earnings reports and FDA approvals to mergers, new contracts, and unusual trading volume, we break down the events that can spark significant price action.
Looking to level up your trading game? Explore StocksToTrade, the ultimate platform for traders. With powerful tools designed for swing and day trading, integrated news scanning, and even social media monitoring, StocksToTrade keeps you one step ahead.
Check out our quick startup guide for new traders!
- How to Read Stock Charts: A Guide for Beginners
- Trading Plan: 6 Steps to Create One
- How To Create a Stock Watchlist
Ready to build your watchlists? Check out these curated lists:
Once your watchlist is set, take the next step and trade with confidence using StocksToTrade’s robust platform. Don’t miss out — grab your 14-day trial for just $7 and experience the edge you need to thrive in today’s fast-paced markets.