
Ondas Inc stocks have been trading down by -5.36 percent amid heightened concerns from the most bearish analyst downgrade.
Click Here for a Millionaire's POV on Trading ONDS
SUBSCRIBE FOR ALERTSJOIN 50,000+ ACTIVE TRADERS
Key Takeaways
- ONDS has pulled back from the $7s to the high $5s, with recent trading stuck in a tight range and fading momentum.
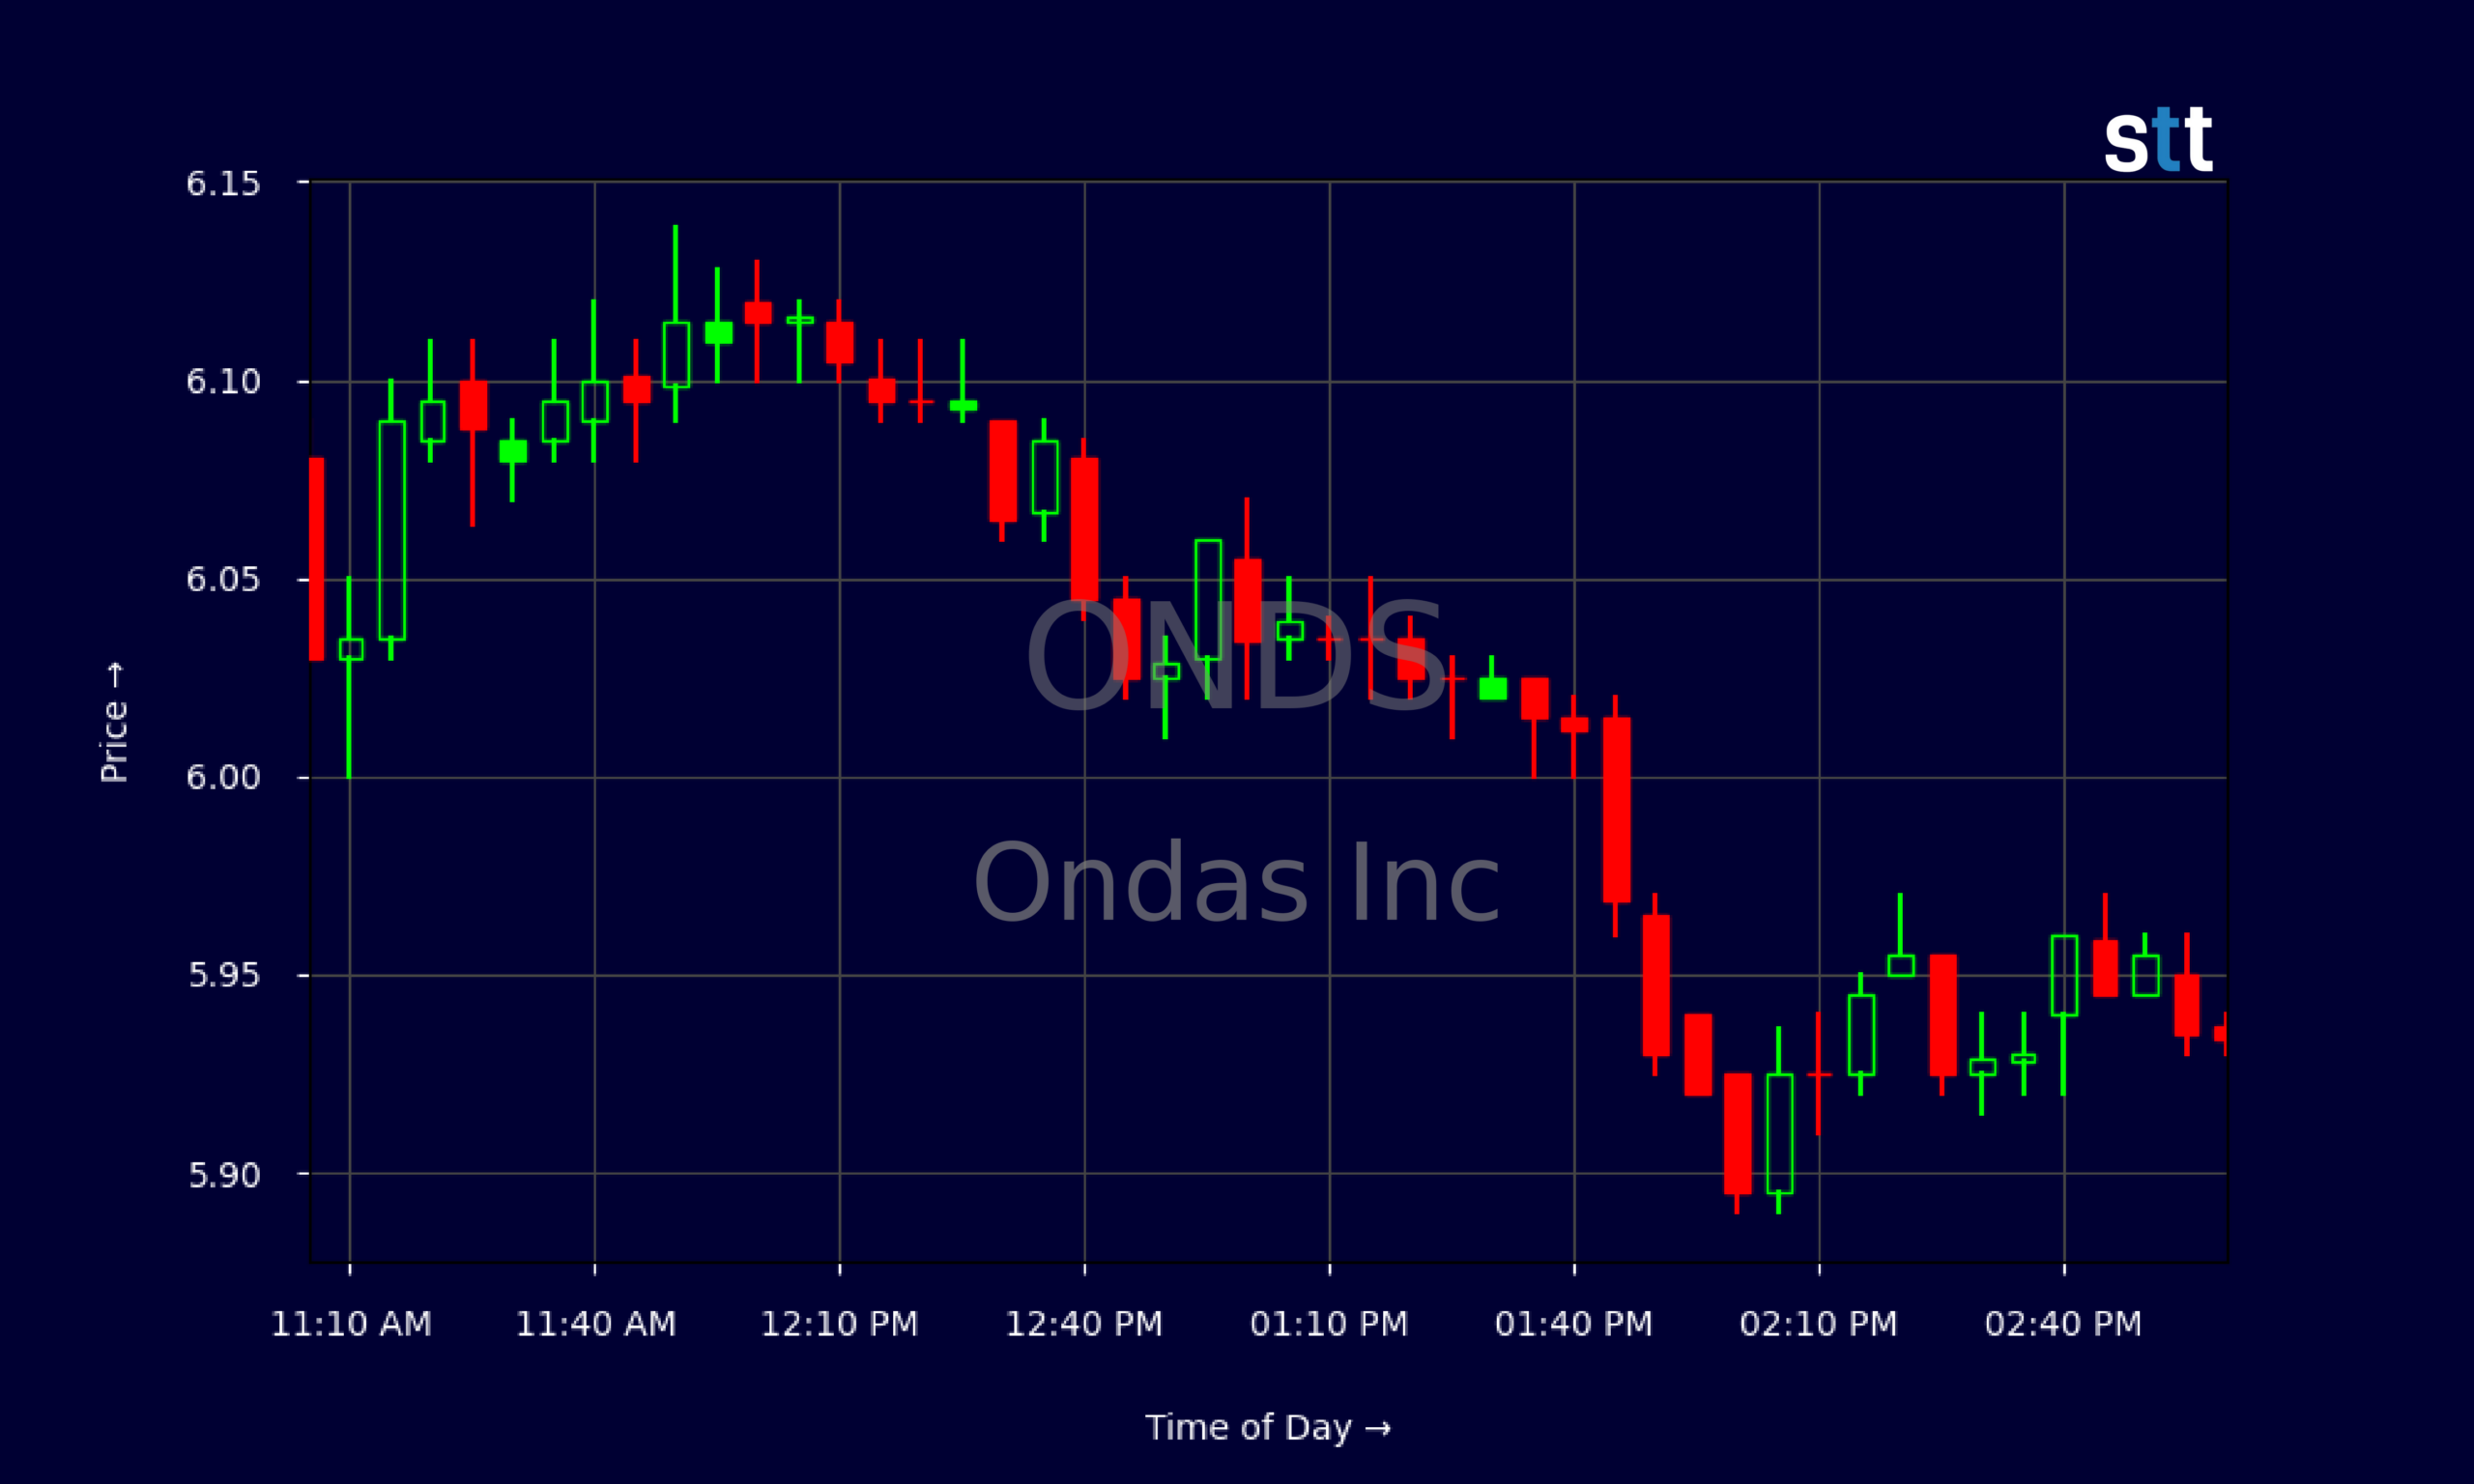
- The intraday ONDS chart shows steady selling pressure from the open, followed by low-volatility consolidation near the lows.
- Ondas Inc reports strong liquidity and minimal debt, giving the company room to operate despite heavy operating losses.
- ONDS financials show rapid revenue growth but large negative cash flow, a mix that often fuels volatility in small-cap trading.
Live Update At 15:02:47 EDT: On Thursday, October 22, 2026 Ondas Inc stock [NASDAQ: ONDS] is trending down by -5.36%! Discover the key drivers behind this movement as well as our expert analysis in the detailed breakdown below.
Quick Financial Overview
ONDS is trading like a stock that just ran too far, too fast and is now catching its breath. Over the past few weeks, Ondas Inc slid from closes around $7.40–$7.70 into the mid–$5s and low $6s. That’s a meaningful pullback in percentage terms, and traders are clearly re-pricing risk.
On the fundamental side, ONDS is a classic high-growth, high-burn story. The company posted about $50.7M in revenue over the last period, with revenue growth above 100% over three and five years. That kind of ramp gets momentum traders interested. But Ondas Inc is not cheap on standard metrics. With a price-to-sales ratio north of 22 and price-to-book around 2.5, traders are paying up for future potential, not present profits.
More Breaking News
- MARA Stock Draws Bullish Targets As Crypto Rules Tighten
- Nebius Group NBIS Slides As Wallstreetbets Momentum Cracks
- SNDG Leverage ETF Draws Traders As Volatility Spikes
- Spotify Stock Climbs As AI Remix Deal Fuels Momentum
Cash is the big cushion. ONDS shows roughly $657.9M in cash and $1.38B in cash plus short-term investments, against only about $4.1M in long-term debt. Liquidity ratios are strong, with a current ratio near 9.9. At the same time, operating cash flow is roughly -$86.1M for the quarter and free cash flow about -$93.8M. For active traders, that mix—big cash pile, big burn, rich valuation—often sets up sharp trend moves once sentiment shifts.
Why Traders Are Watching ONDS Price Action
Traders focus on ONDS because the chart and fundamentals tell the same story: this is a battleground between growth hopes and heavy spending. On the daily chart, Ondas Inc peaked near $7.90 at the end of last month and has steadily stepped lower. Highs have faded from the upper $7s into the low $6s, with recent closes hugging $5.93–$6.35. That’s a clear downtrend with lower highs and mildly lower lows, not a full-on crash but a controlled bleed.
Intraday, ONDS shows the same pressure. The latest session opened near $6.10, pushed briefly above $6.33 in the first 10 minutes, and then sellers took over. From there, the price faded almost all day, grinding lower into the $5.90s with tight five-minute candles and little bounce. For day traders who love volatility, that kind of controlled drift tells you one key thing: supply is in charge right now.
Under the hood, ONDS financials explain why traders are hesitant to chase. Ondas Inc delivered roughly $83.8M in quarterly revenue but reported a net loss near $88.6M and operating income around -$143.7M. EBITDA was deeply negative. Operating and investing cash flows were both large outflows, as Ondas Inc spent heavily on properties, short-term investments, and operations.
At the same time, the balance sheet is unusually strong for a company burning this much. Total assets are close to $2.99B, equity sits around $1.57B, and debt levels are tiny. Derivative product liabilities make the structure more complex, but the low leverage and big cash stack give ONDS runway. That tension—ample runway, steep burn—keeps traders coming back to the tape, watching for the moment when sentiment swings sharply either way.
Conclusion
For active traders, ONDS is a lesson in respecting both the chart and the cash flow statement. The daily trend on Ondas Inc is down from the high $7s, and the latest intraday session showed a textbook fade from the open with no real bounce. That tells short-term traders to treat ONDS as a “sell the pops” name until the pattern changes. Support appears to be forming close to the upper $5s, but it is not confirmed yet.
Fundamentally, ONDS combines rapid revenue growth with heavy losses and aggressive spending. Ondas Inc has strong liquidity, minimal traditional debt, and solid working capital, but it is also burning tens of millions of dollars in a single quarter. If the market stays risk-off for speculative names, traders will demand cleaner progress toward profitability before rewarding ONDS with higher prices.
For now, this is a stock to study, not blindly chase. ONDS offers clear technical levels, strong intraday trends, and a story that can move fast once sentiment flips. As Tim Sykes loves to say, “Rule number one is cut losses quickly—rule number two is don’t forget rule number one.” Equally important is having the patience to wait for your edge; as Tim Bohen, lead trainer with StocksToTrade says, “Time and experience have taught me that missed opportunities are part of the game. There’s always another setup around the corner.” Traders who approach ONDS with that mindset, tight risk, and a clear plan stand the best chance of surviving the volatility while they learn from the setup.
This is stock news, not investment advice. StocksToTrade News delivers real-time stock market updates tailored to highlight the key catalysts driving short-term price movements. Our coverage is designed for active traders and investors who thrive in fast-moving markets, with a focus on volatile sectors like penny stocks, AI stocks, Robinhood stocks and other momentum plays. From earnings reports and FDA approvals to mergers, new contracts, and unusual trading volume, we break down the events that can spark significant price action.
Looking to level up your trading game? Explore StocksToTrade, the ultimate platform for traders. With powerful tools designed for swing and day trading, integrated news scanning, and even social media monitoring, StocksToTrade keeps you one step ahead.
Check out our quick startup guide for new traders!
- How to Read Stock Charts: A Guide for Beginners
- Trading Plan: 6 Steps to Create One
- How To Create a Stock Watchlist
Ready to build your watchlists? Check out these curated lists:
Once your watchlist is set, take the next step and trade with confidence using StocksToTrade’s robust platform. Don’t miss out — grab your 14-day trial for just $7 and experience the edge you need to thrive in today’s fast-paced markets.