
Ondas Inc stocks have been trading down by -6.46 percent after negative sentiment around its latest financial performance and outlook.
Click Here for a Millionaire's POV on Trading ONDS
SUBSCRIBE FOR ALERTSJOIN 50,000+ ACTIVE TRADERS
Key Takeaways
- ONDS has slid from the $7.60 area to about $5.94 over recent sessions, showing a clear short‑term downtrend on the daily chart.
- Intraday action in ONDS is tight, with most trading clustered between $5.90 and $6.10, signaling consolidation after the pullback.
- The latest report shows Ondas Inc posting roughly $83.8M in quarterly revenue but booking a net loss near $88.6M.
- Ondas Inc holds about $657.9M in cash against minimal debt, giving ONDS strong liquidity but raising questions about how fast that cash is being burned.
- With a price‑to‑sales ratio above 22, traders in ONDS are paying a premium for growth while losses remain heavy.
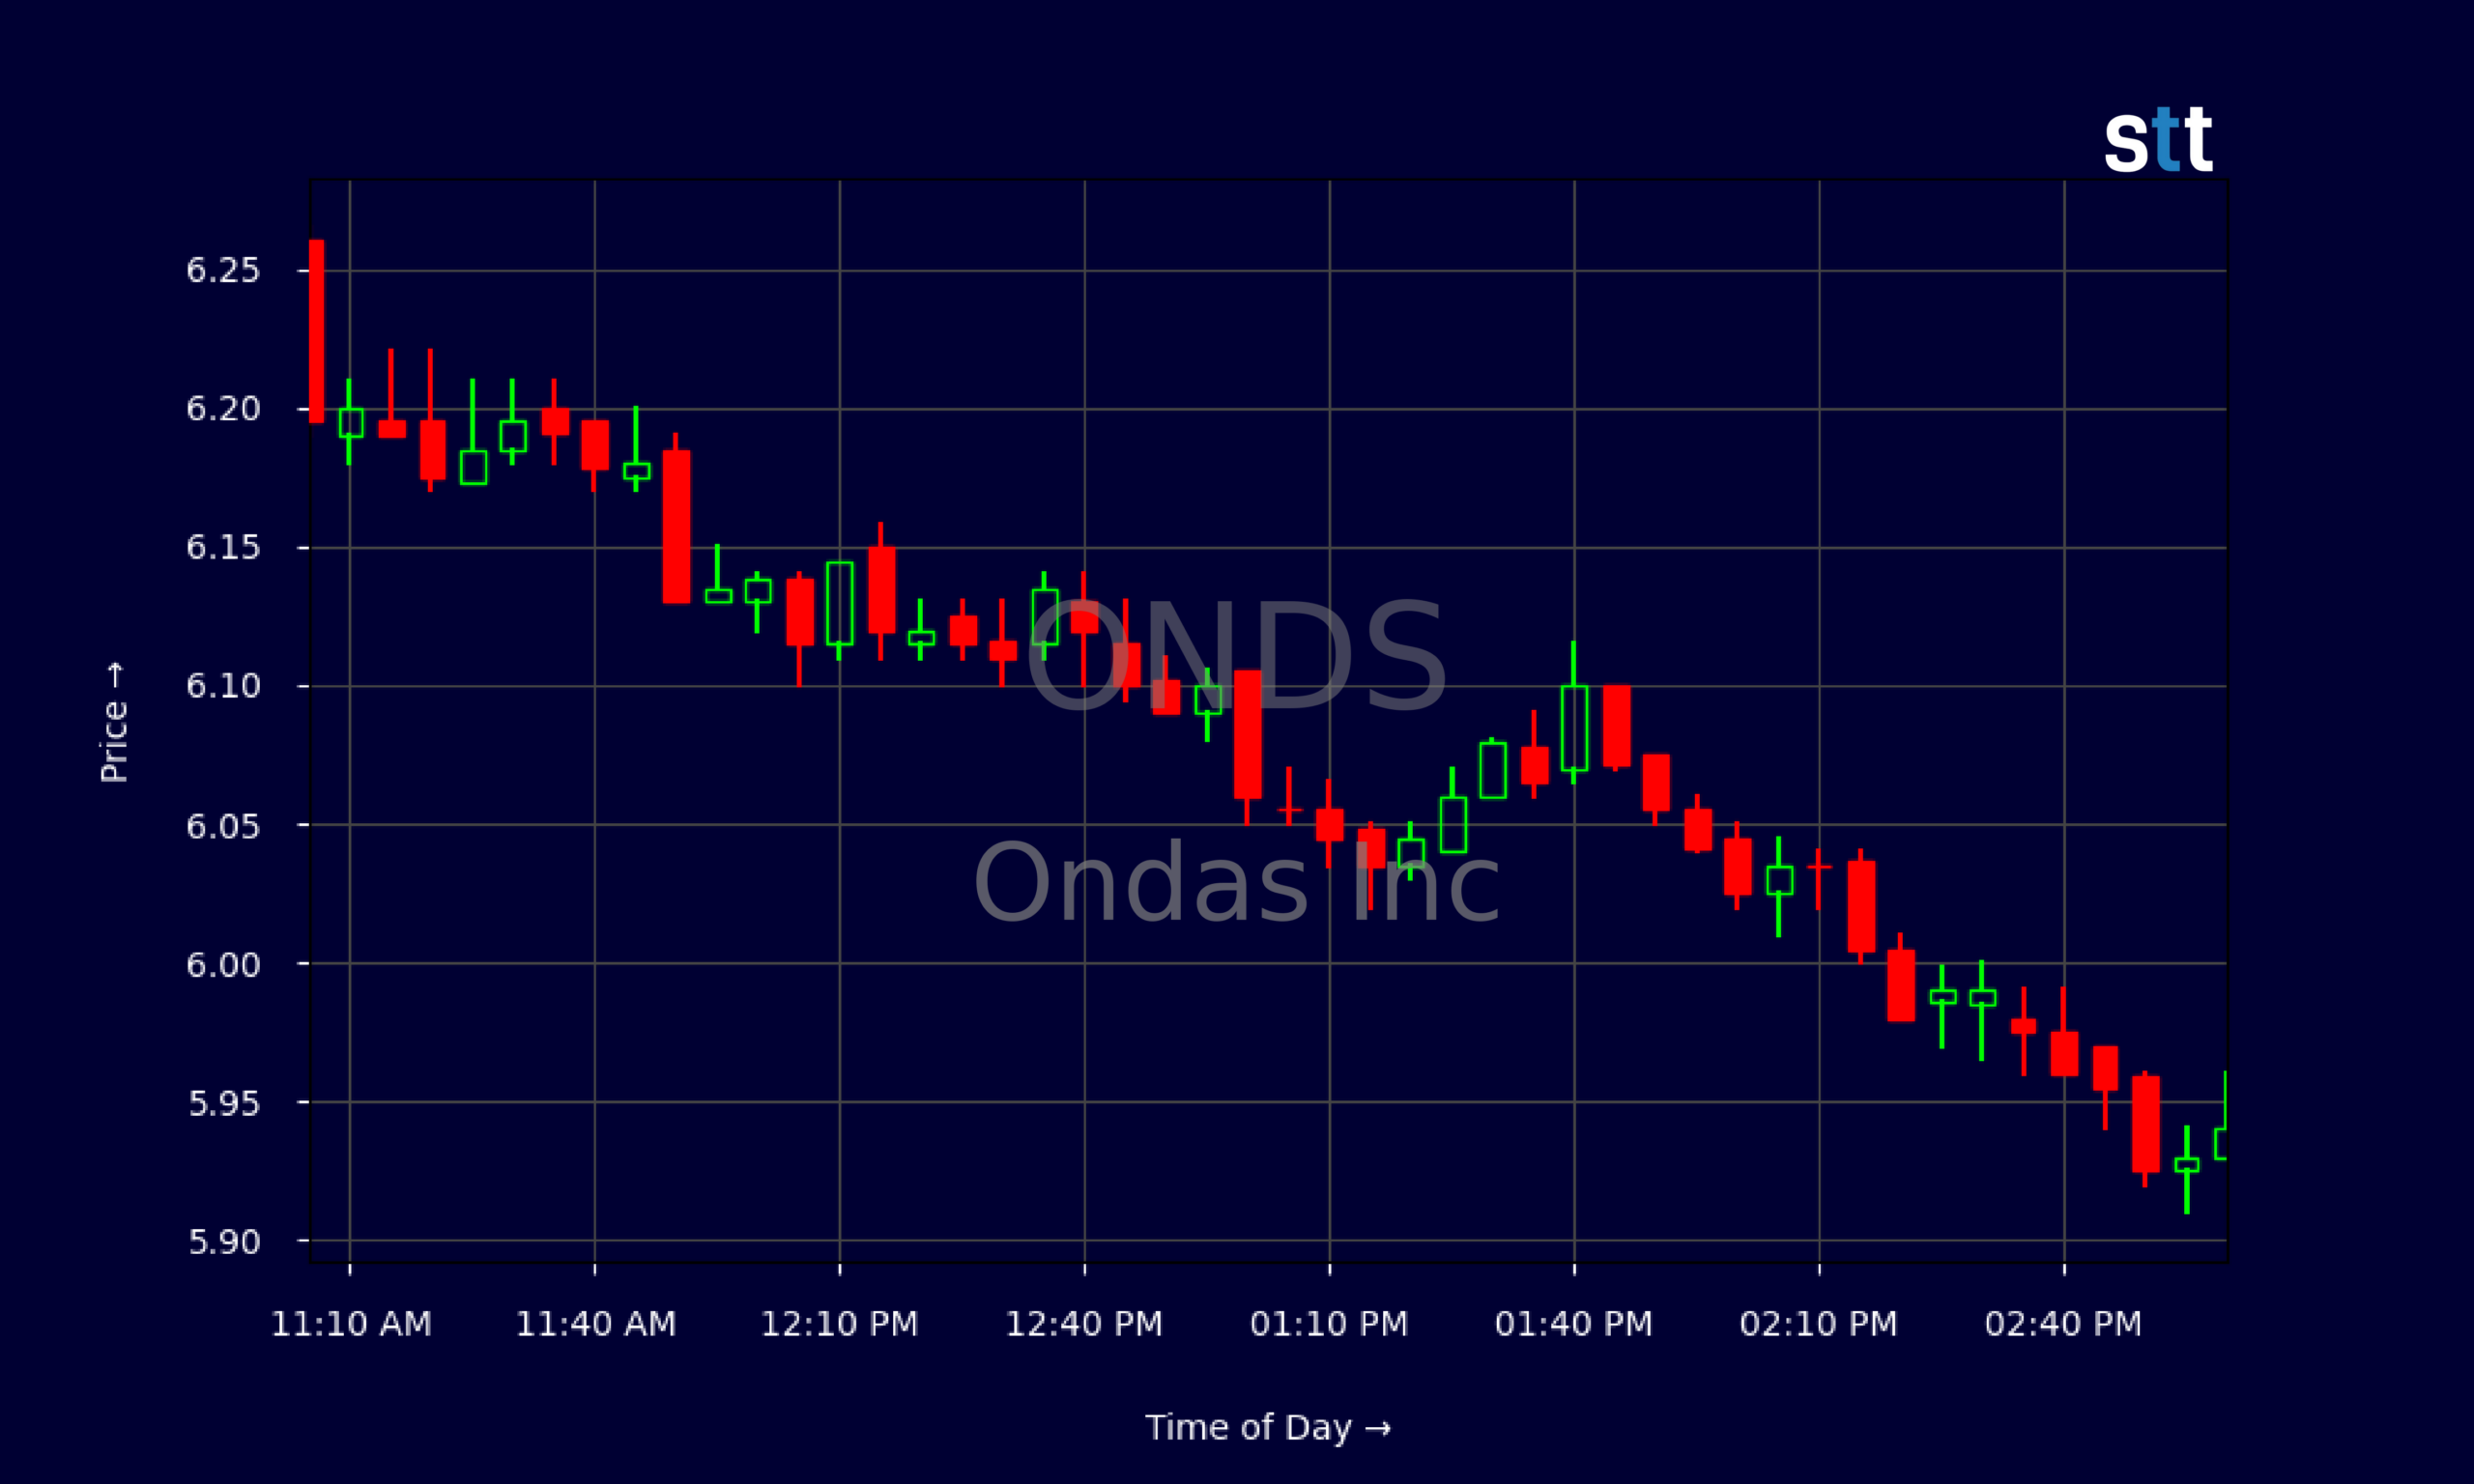
Live Update At 15:02:39 EDT: On Friday, October 16, 2026 Ondas Inc stock [NASDAQ: ONDS] is trending down by -6.46%! Discover the key drivers behind this movement as well as our expert analysis in the detailed breakdown below.
Quick Financial Overview
Ondas Inc gives traders a classic high‑growth, high‑burn setup. On paper, ONDS looks big, with total assets of about $2.99B and quarterly revenue near $83.8M. Revenue growth has been strong over the past three to five years, which helps explain why ONDS trades at a steep price‑to‑sales multiple around 22.5. The market is clearly paying up for future potential.
But the income statement shows the other side. Ondas Inc reported an operating loss of roughly $143.7M and a net loss of about $88.2M for the quarter. That translates into a diluted EPS of about -$0.19. For traders, that’s a signal that ONDS is far from profitability and still in heavy spending mode on research, development, and overhead.
More Breaking News
- TCRT Stock Explodes As Velaris Deal Redraws The Map
- EOG Resources Stock Draws Wave Of Bullish Price Target Hikes
- CoreWeave (CRWV) Stock Slammed As Default Fears Surge
- NOK Stock Slides As Persistent ADR Selling Pressures Telecom Name
The balance sheet is the safety net. ONDS lists about $657.9M in cash and $1.38B in cash plus short‑term investments, with very low traditional debt. Current and quick ratios around 10 and 8.5 show strong near‑term liquidity. Still, free cash flow of roughly -$93.8M in the quarter tells traders that Ondas Inc is burning cash fast, so runway length matters.
Why Traders Are Watching ONDS Price Action
On the chart, ONDS has shifted from a slow fade to an active pullback. Just a few weeks ago, Ondas Inc was closing around $7.60–$7.70. Since then, price has slipped, with the most recent daily close near $5.94. That’s roughly a 20–25% drawdown from the late‑September levels. For active traders, this is a clear change in short‑term momentum.
Look at the daily candles. ONDS printed several sessions in the $7.20–$7.70 zone, then started making lower highs and lower lows. Recent days show closes stepping down from $7.33 to $7.12, then into the $6.70–$6.30 band, and finally under $6.00. That is textbook trend deterioration. Ondas Inc is now trading well below those prior congestion zones, which can turn into overhead resistance on any bounce.
Intraday, ONDS is acting like a stock in consolidation mode after the drop. Most of the 5‑minute candles sit in a narrow band between about $5.90 and $6.10, with early morning strength toward $6.40–$6.45 fading through the day. Volume in that tight range usually signals a battle between dip buyers and short sellers, not a clean trend.
For momentum traders, that means ONDS is more of a range‑play than a breakout right now. For swing traders, the key questions around Ondas Inc become simple: does this consolidation build a base for a trend reversal, or is it just a pause before another leg down? The wide gap between strong revenue growth and heavy losses will drive that debate.
Conclusion
ONDS sits at a crossroads that experienced traders know well: strong top‑line growth, big losses, plenty of cash, and a chart that just cracked from recent highs. Ondas Inc has posted impressive revenue expansion and carries a large cash pile with minimal classic debt, which lowers bankruptcy risk in the near term. At the same time, a quarterly free‑cash‑flow burn near $93.8M and an operating loss over $140M remind traders that this is still a show‑me story.
Technically, ONDS is in a short‑term downtrend, trading below recent support in the mid‑$7s and chopping sideways around the high‑$5s. Until Ondas Inc can reclaim prior support zones and hold them, many short‑term traders will likely treat it as a bounce‑and‑fade candidate rather than a confirmed trend reversal. Tighter intraday ranges hint that a bigger move is coming; direction will depend on whether buyers or sellers take control around this current band.
For active day and swing traders studying ONDS, the playbook is the same one Tim Sykes pushes in his community: “Patterns repeat, but only traders who cut losses quickly survive long enough to see them.” As Tim Bohen, lead trainer with StocksToTrade says, “Success in trading is more about cutting losses quickly than finding winners.” With Ondas Inc, that means respecting the rich valuation, watching the cash burn, and letting the chart confirm the edge before sizing up any trade. This article is for educational and research purposes only and is not investment advice.
This is stock news, not investment advice. StocksToTrade News delivers real-time stock market updates tailored to highlight the key catalysts driving short-term price movements. Our coverage is designed for active traders and investors who thrive in fast-moving markets, with a focus on volatile sectors like penny stocks, AI stocks, Robinhood stocks and other momentum plays. From earnings reports and FDA approvals to mergers, new contracts, and unusual trading volume, we break down the events that can spark significant price action.
Looking to level up your trading game? Explore StocksToTrade, the ultimate platform for traders. With powerful tools designed for swing and day trading, integrated news scanning, and even social media monitoring, StocksToTrade keeps you one step ahead.
Check out our quick startup guide for new traders!
- How to Read Stock Charts: A Guide for Beginners
- Trading Plan: 6 Steps to Create One
- How To Create a Stock Watchlist
Ready to build your watchlists? Check out these curated lists:
Once your watchlist is set, take the next step and trade with confidence using StocksToTrade’s robust platform. Don’t miss out — grab your 14-day trial for just $7 and experience the edge you need to thrive in today’s fast-paced markets.