
Olenox Industries Inc. stocks have been trading up by 47.9 percent amid upbeat sentiment over breakthrough renewable energy contracts.
Click Here for a Millionaire's POV on Trading OLOX
SUBSCRIBE FOR ALERTSJOIN 50,000+ ACTIVE TRADERS
Key Takeaways
- Recent OLOX trading shows a fast drop from a $1.85 spike to sub-$0.75, signaling heavy profit-taking and momentum exhaustion.
- Intraday OLOX action highlights big swings between $0.74 and $1.21, a clear sign of elevated volatility that active traders track closely.
- Olenox Industries Inc. reports shrinking revenue and steep losses, but trades at a deep discount to book value.
- Balance sheet pressure at OLOX, including negative working capital and high leverage, keeps risk elevated despite low price-to-sales ratios.
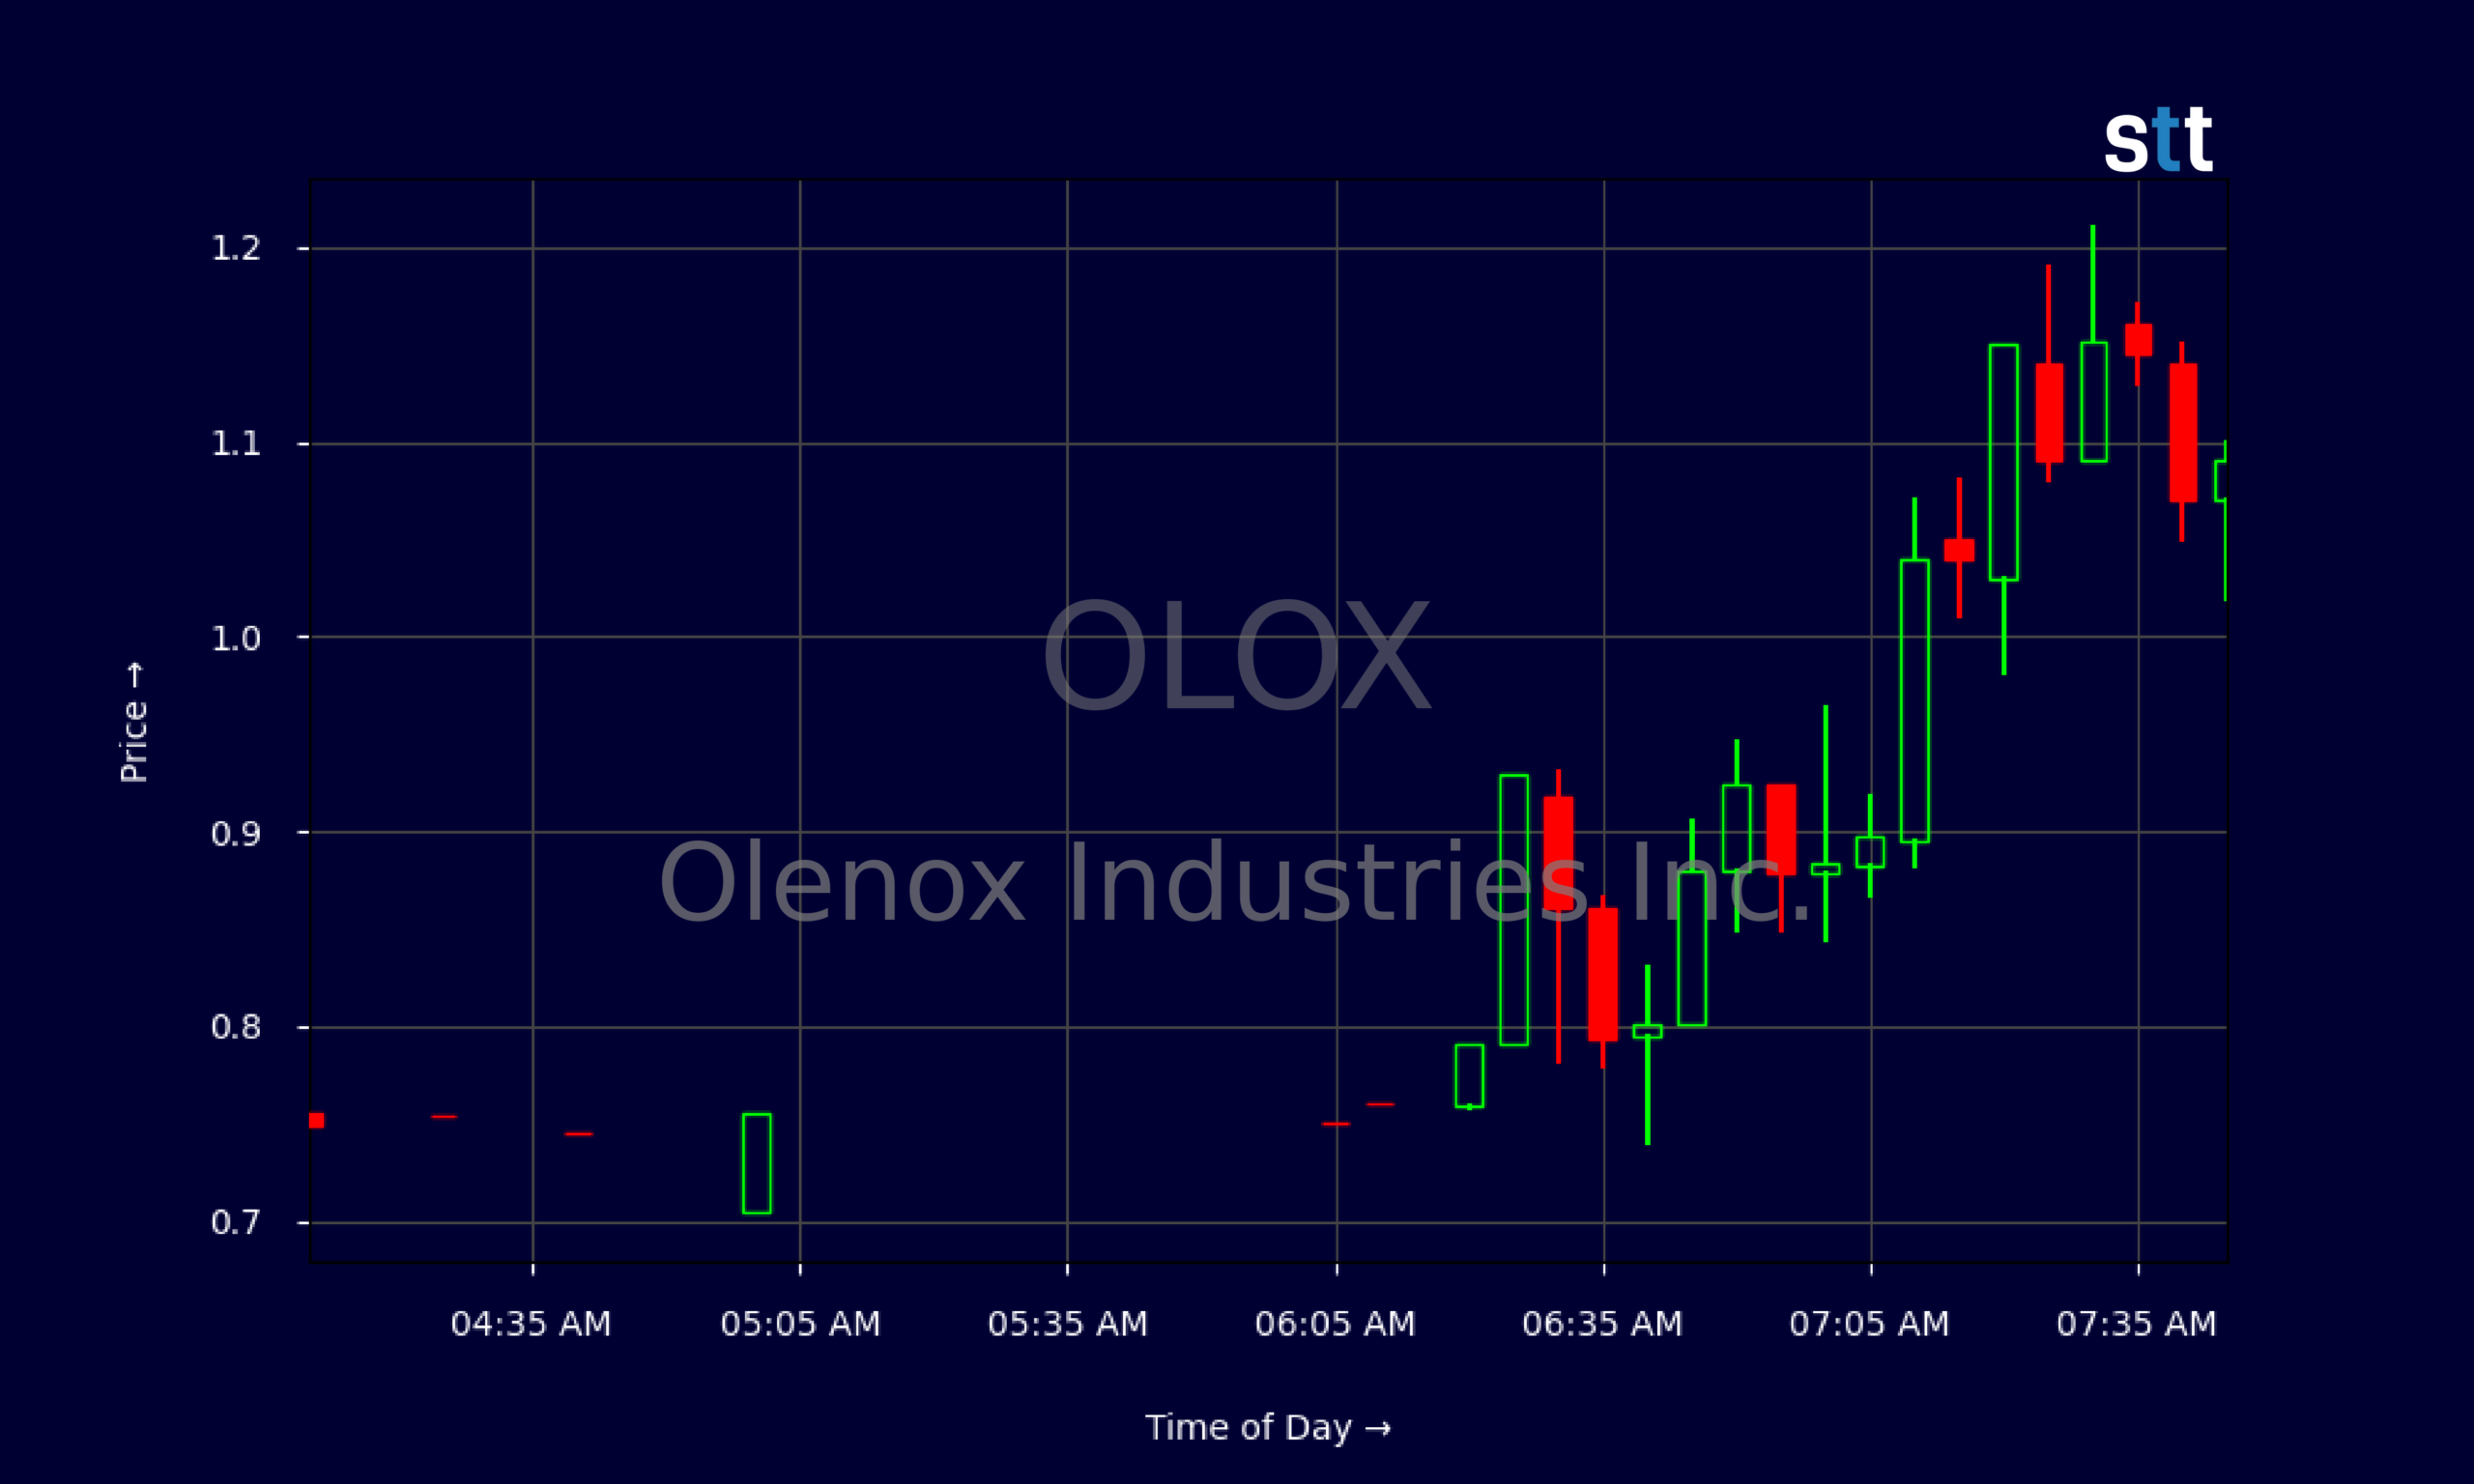
Live Update At 07:48:57 EDT: On Wednesday, October 21, 2026 Olenox Industries Inc. stock [NASDAQ: OLOX] is trending up by 47.9%! Discover the key drivers behind this movement as well as our expert analysis in the detailed breakdown below.
Quick Financial Overview
Olenox Industries Inc., trading under ticker OLOX, is the kind of broken fundamental story that still gets day traders’ attention because of the chart. On the business side, the numbers are rough. Revenue is about $2.9M annually, and management has watched sales decline sharply over the past three to five years. Profitability is deeply negative, with OLOX showing an EBIT margin below -300% and profit margins even worse. This is not a slow bleed; it is a full-on struggle to reach scale.
At the same time, OLOX looks optically cheap on some valuation metrics. Price-to-sales sits near 0.37 and price-to-book around 0.08, suggesting the market values Olenox Industries Inc. far below its stated asset base. But that discount comes with heavy baggage. Return on equity is deeply negative and the company’s leverage ratio is high, around 3.3, with total debt-to-equity at 1.36.
More Breaking News
- XLAB Stock Whipsaws As Traders Target High-Volatility Setup
- SSPC Leverage Shares 2X Short SPCX Daily Shows Volatile Turn
- Intel Stock Climbs As AI Bets And Terafab Jitters Collide
- BMNR Stock Tracks Massive Ethereum Bet As Staking Revenue Grows
Liquidity is another red flag. OLOX has a current ratio of roughly 0.1, meaning short-term obligations vastly outweigh near-term assets. Cash flow, while positive this quarter, is driven largely by working capital shifts and payables, not healthy ongoing profits. For traders, the takeaway is simple: the fundamentals are weak, but the stock can still move fast.
Why Traders Are Watching OLOX Price Swings
OLOX has become a classic trader’s ticker: ugly fundamentals but explosive charts. On the daily timeframe, Olenox Industries Inc. spiked from the $0.80s to as high as about $1.86 in early October, then collapsed back toward $0.70 over the next two weeks. That kind of round trip screams speculative flow. The reversal from $1.25 down into the $0.60–$0.70 range shows that late buyers chasing the top likely got trapped while early shorts and disciplined longs locked in big gains.
Intraday, OLOX still trades like a rollercoaster. The 5-minute data shows price whipping from around $0.74 at the open of premarket to over $1.21, then fading and bouncing again. Moves of 20%–40% within a single extended session give active traders clear chances to scalp, but also plenty of room to blow up if they size wrong. That’s why experienced traders watching Olenox Industries Inc. focus on key intraday levels — support near the mid-$0.70s and resistance around $1.10–$1.20 — instead of dreaming about long-term stories.
On the fundamental side, OLOX reports quarterly revenue of about $2.1M and a net loss of roughly $3.2M, with operating income deeply negative. Yet cash flow from operations is modestly positive, helped by increased payables and non-cash charges like depreciation and stock-based compensation. Traders know that type of cash flow is fragile. If suppliers tighten terms or expenses tick up, Olenox Industries Inc. can swing back to burning cash quickly.
This mix — brutal earnings, stressed balance sheet, but a low float with strong day-to-day range — keeps OLOX squarely in the momentum-trader playbook. The ticker won’t appeal to long-term fundamental types, but for short-term pattern traders, the volatility is the main story.
Conclusion
OLOX sits in that dangerous but tradable zone where the business looks fragile, yet the stock still attracts heavy speculative action. Olenox Industries Inc. is losing money, carrying meaningful debt, and operating with very tight liquidity. Book value appears high on paper, but negative returns on assets and equity tell traders that management has not yet turned those assets into real earnings power. This is why the market prices OLOX at a steep discount.
For momentum and small-cap traders, though, the focus is the tape, not the story. Recent daily candles show big wicks and wide ranges, telling you that both buyers and sellers are battling hard. Intraday charts show the same thing: OLOX can rip from the $0.80s to above $1.10 in minutes, then slam back down just as fast. That demands strict discipline. As Tim Bohen, lead trainer with StocksToTrade says, “Preparation is half the trade. By the time the bell rings, my decisions are nearly made.” That mindset applies directly to a ticker like OLOX, where having a pre-planned watchlist, key levels, and exit criteria can make the difference between a controlled trade and an emotional gamble.
The educational lesson from OLOX is straightforward. Respect the volatility, trade the levels, and never marry the stock. As Tim Sykes often says, “The market doesn’t care about your opinion, only your discipline.” Olenox Industries Inc. is a textbook example: a weak company that can still produce powerful trading setups. Traders studying OLOX should focus on risk management, clean chart patterns, and quick decision-making. This content is produced solely for educational and research purposes and is not advice for buying or selling any security.
This is stock news, not investment advice. StocksToTrade News delivers real-time stock market updates tailored to highlight the key catalysts driving short-term price movements. Our coverage is designed for active traders and investors who thrive in fast-moving markets, with a focus on volatile sectors like penny stocks, AI stocks, Robinhood stocks and other momentum plays. From earnings reports and FDA approvals to mergers, new contracts, and unusual trading volume, we break down the events that can spark significant price action.
Looking to level up your trading game? Explore StocksToTrade, the ultimate platform for traders. With powerful tools designed for swing and day trading, integrated news scanning, and even social media monitoring, StocksToTrade keeps you one step ahead.
Check out our quick startup guide for new traders!
- How to Read Stock Charts: A Guide for Beginners
- Trading Plan: 6 Steps to Create One
- How To Create a Stock Watchlist
Ready to build your watchlists? Check out these curated lists:
Once your watchlist is set, take the next step and trade with confidence using StocksToTrade’s robust platform. Don’t miss out — grab your 14-day trial for just $7 and experience the edge you need to thrive in today’s fast-paced markets.