
Olenox Industries Inc. stocks have been trading up by 54.64 percent following optimistic coverage of its breakthrough product launch.
Click Here for a Millionaire's POV on Trading OLOX
SUBSCRIBE FOR ALERTSJOIN 50,000+ ACTIVE TRADERS
Key Takeaways
- OLOX has pulled back sharply from early-month highs near $1.85 to the $0.70s, signaling heavy volatility and profit-taking pressure.
- Intraday OLOX trading shows wide 5‑minute swings from $0.76 to above $1.15, reinforcing its profile as a high-risk, high-reward momentum name.
- Olenox Industries Inc. reports roughly $2.1M in quarterly revenue but deep net losses around $3.2M, with margins heavily in the red.
- OLOX carries significant leverage, weak liquidity, and negative cash flow metrics, yet trades at a steep discount to book value.
- Technical traders are watching whether OLOX can base above recent lows and build a new trend, or if selling pressure resumes.
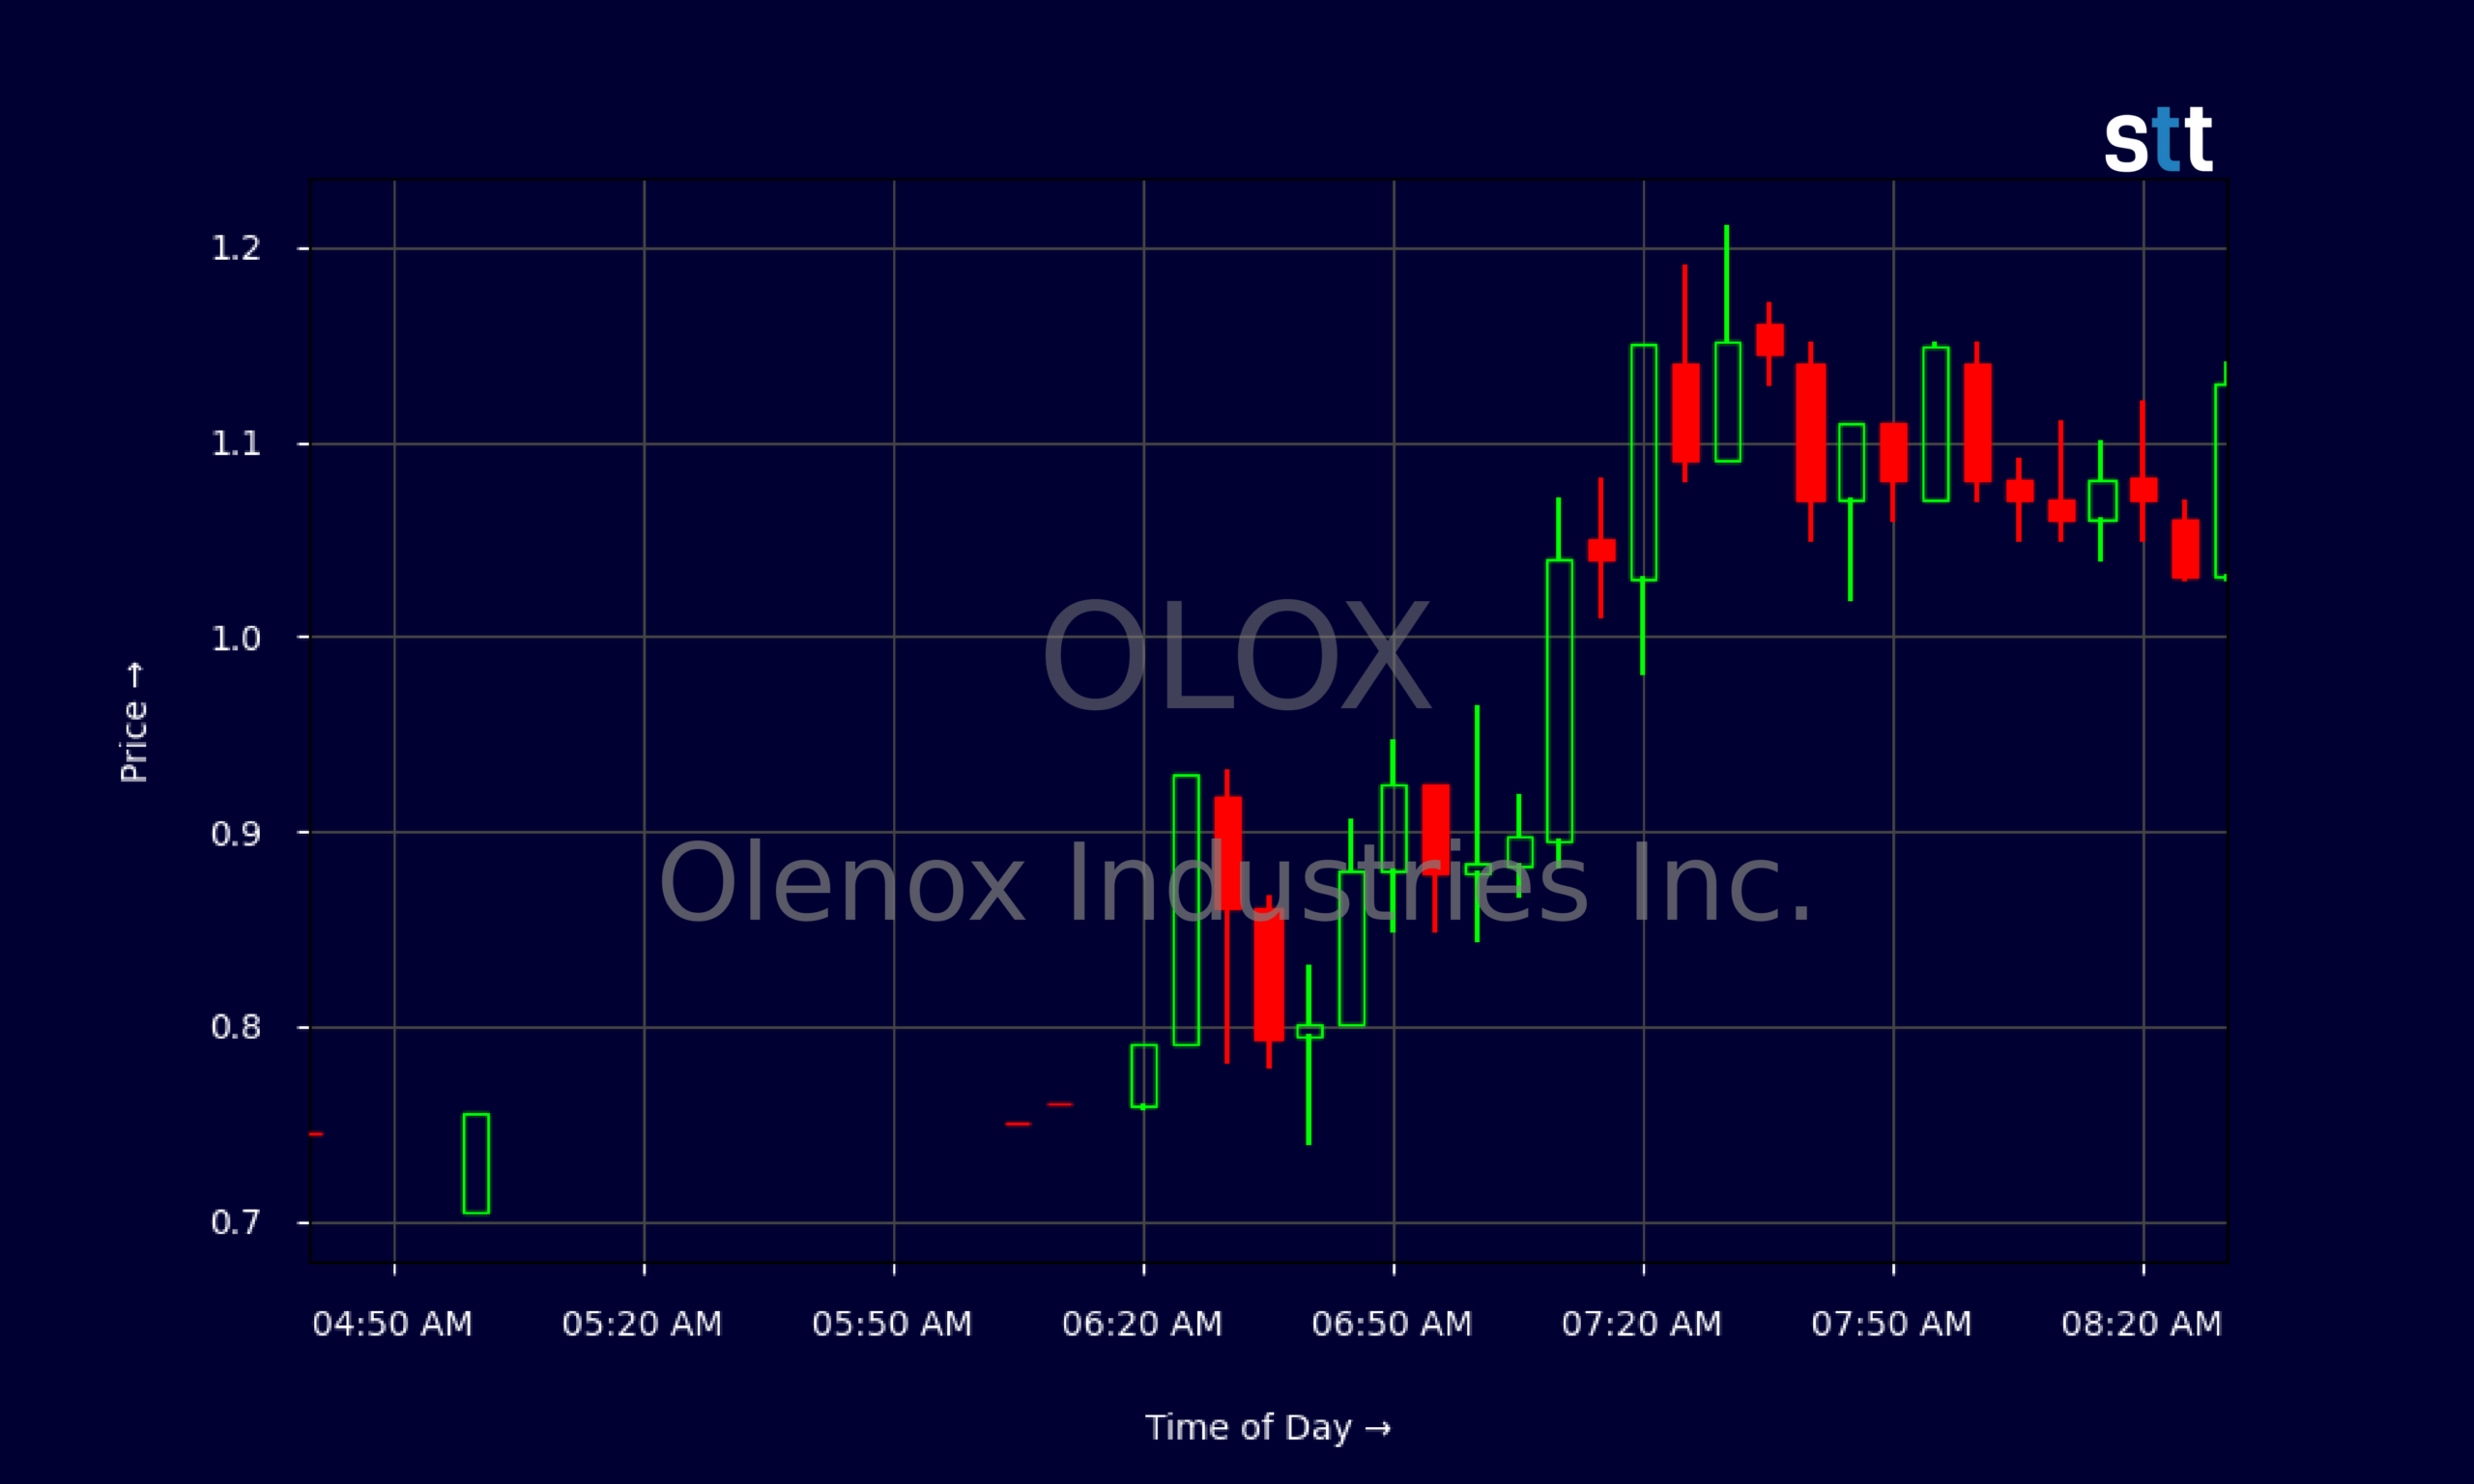
Live Update At 08:33:48 EDT: On Wednesday, October 21, 2026 Olenox Industries Inc. stock [NASDAQ: OLOX] is trending up by 54.64%! Discover the key drivers behind this movement as well as our expert analysis in the detailed breakdown below.
Quick Financial Overview
Olenox Industries Inc., trading under ticker OLOX, is a classic distressed spec name wrapped in a small-cap shell. The latest quarterly report shows total revenue of about $2.1M, but that top line does not translate into profits. OLOX booked a net loss of roughly $3.24M, with operating income also deeply negative. Those numbers push profit margins far below zero and keep the income statement firmly in the red.
On the balance sheet, OLOX lists total assets of about $64.2M and equity near $19.4M, but it also carries roughly $26.3M in current liabilities and around $16.7M in long-term debt. Working capital is heavily negative, and the current ratio near 0.1 signals tight liquidity. For traders, that means funding risk is real.
More Breaking News
- Hasbro Stock Draws Bullish Targets As Q3 Catalyst Nears
- INVE Stock Grinds Higher As Cash Hoard Draws Trader Focus
- CoreWeave CRWV Stock Rebounds As Wall Street Bites On AI Growth
- Nebius Group NBIS Stock Jumps As AI Cloud Momentum Builds
At the same time, valuation metrics show OLOX trading around just 0.08 times book value and roughly 0.37 times sales. The market is clearly discounting Olenox Industries Inc.’s weak profitability and heavy leverage, but those low multiples can attract speculative trading when volume spikes or sentiment shifts.
Why Traders Are Watching OLOX Price Action
The chart is where OLOX really stands out. Earlier in the month, Olenox Industries Inc. spiked to an intraday high near $1.86 before fading hard. Since that blow‑off move, the daily closes have slid into the $0.70–$0.80 range. That kind of round trip shows classic pump‑and‑dump style volatility, which is exactly what short-term traders hunt.
Looking at the recent daily candles, OLOX opened one session at $1.445 and closed at $1.25, then spent the next several days bleeding lower with lower highs and lower lows. By the latest print, OLOX is closing around $0.74 after briefly dipping near $0.60. That’s a brutal drawdown from the highs, but it also sets up potential bounce zones for disciplined traders who map support and resistance.
Zoom in to the 5‑minute intraday chart and the story gets even more intense. OLOX has swung from roughly $0.75 in premarket to above $1.15 within a couple of hours. Several candles show $0.10–$0.20 ranges in minutes, which is huge on a sub‑$1 name. For scalpers and momentum traders, Olenox Industries Inc. offers plenty of range, but also plenty of trap potential if risk is not controlled.
Combine that price action with the fundamentals and the picture is clear. OLOX is not a steady compounder; it’s a speculative vehicle where dilution, financing needs, and poor margins hang over the story. That backdrop often fuels sharp spikes on any hint of optimism, followed by equally sharp dumps when reality reasserts itself. Traders who specialize in volatility keep OLOX on screen because the chart pays those who plan entries and exits, not those who marry the stock.
Conclusion
For active traders studying OLOX, the key is to separate the story from the trade. Olenox Industries Inc. shows heavy losses, negative returns on equity, and thin liquidity. The company is running with a leveraged balance sheet, working capital deep in the red, and profitability ratios that point to ongoing cash burn. None of that screams long-term safety.
But the same weak fundamentals that pressure OLOX also help create massive volatility. The stock can double intraday on volume, then give it all back as traders lock in gains and shorts lean in. With OLOX trading at a steep discount to book value and on a tiny float, every surge in attention can turn into a momentum spike.
For many in the Tim Sykes trading community, a setup like OLOX is never about believing in the business. It’s about reading the chart, understanding the risk, and treating it like a trade, not a dream. As Tim Sykes likes to remind traders, “You’re not a trader if you can’t cut losses quickly.” As Tim Bohen, lead trainer with StocksToTrade says, “For me, trading is more about managing risk than finding the next big mover.”. With Olenox Industries Inc., that rule matters even more. The smarter approach is to study the pattern, respect the volatility, and let risk management—not hope—drive every trading decision in OLOX.
This is stock news, not investment advice. StocksToTrade News delivers real-time stock market updates tailored to highlight the key catalysts driving short-term price movements. Our coverage is designed for active traders and investors who thrive in fast-moving markets, with a focus on volatile sectors like penny stocks, AI stocks, Robinhood stocks and other momentum plays. From earnings reports and FDA approvals to mergers, new contracts, and unusual trading volume, we break down the events that can spark significant price action.
Looking to level up your trading game? Explore StocksToTrade, the ultimate platform for traders. With powerful tools designed for swing and day trading, integrated news scanning, and even social media monitoring, StocksToTrade keeps you one step ahead.
Check out our quick startup guide for new traders!
- How to Read Stock Charts: A Guide for Beginners
- Trading Plan: 6 Steps to Create One
- How To Create a Stock Watchlist
Ready to build your watchlists? Check out these curated lists:
Once your watchlist is set, take the next step and trade with confidence using StocksToTrade’s robust platform. Don’t miss out — grab your 14-day trial for just $7 and experience the edge you need to thrive in today’s fast-paced markets.