
Nu Holdings Ltd. faces heightened pressure as regulatory scrutiny intensifies while its stocks have been trading down by -26.45 percent.
Click Here for a Millionaire's POV on Trading NU
SUBSCRIBE FOR ALERTSJOIN 50,000+ ACTIVE TRADERS
Key Takeaways For NU Traders
- NU has been grinding higher on the daily chart, with a series of higher lows and recent closes clustering around the mid-$15s.
- Intraday NU trading shows a wide early spike from $13.12 to the low-$12s, followed by a tight consolidation band around $11.70–$11.90.
- Nu Holdings Ltd. reports revenue of about $10.16B and a price-to-sales ratio near 7.7, signaling traders are paying a premium for growth.
- Balance sheet data show NU sitting on roughly $16.14B in cash against $63.57B in total liabilities, giving the bank solid liquidity but meaningful leverage.
- Active traders are watching NU’s tightening range for a breakout, using recent support and resistance as clear risk levels.
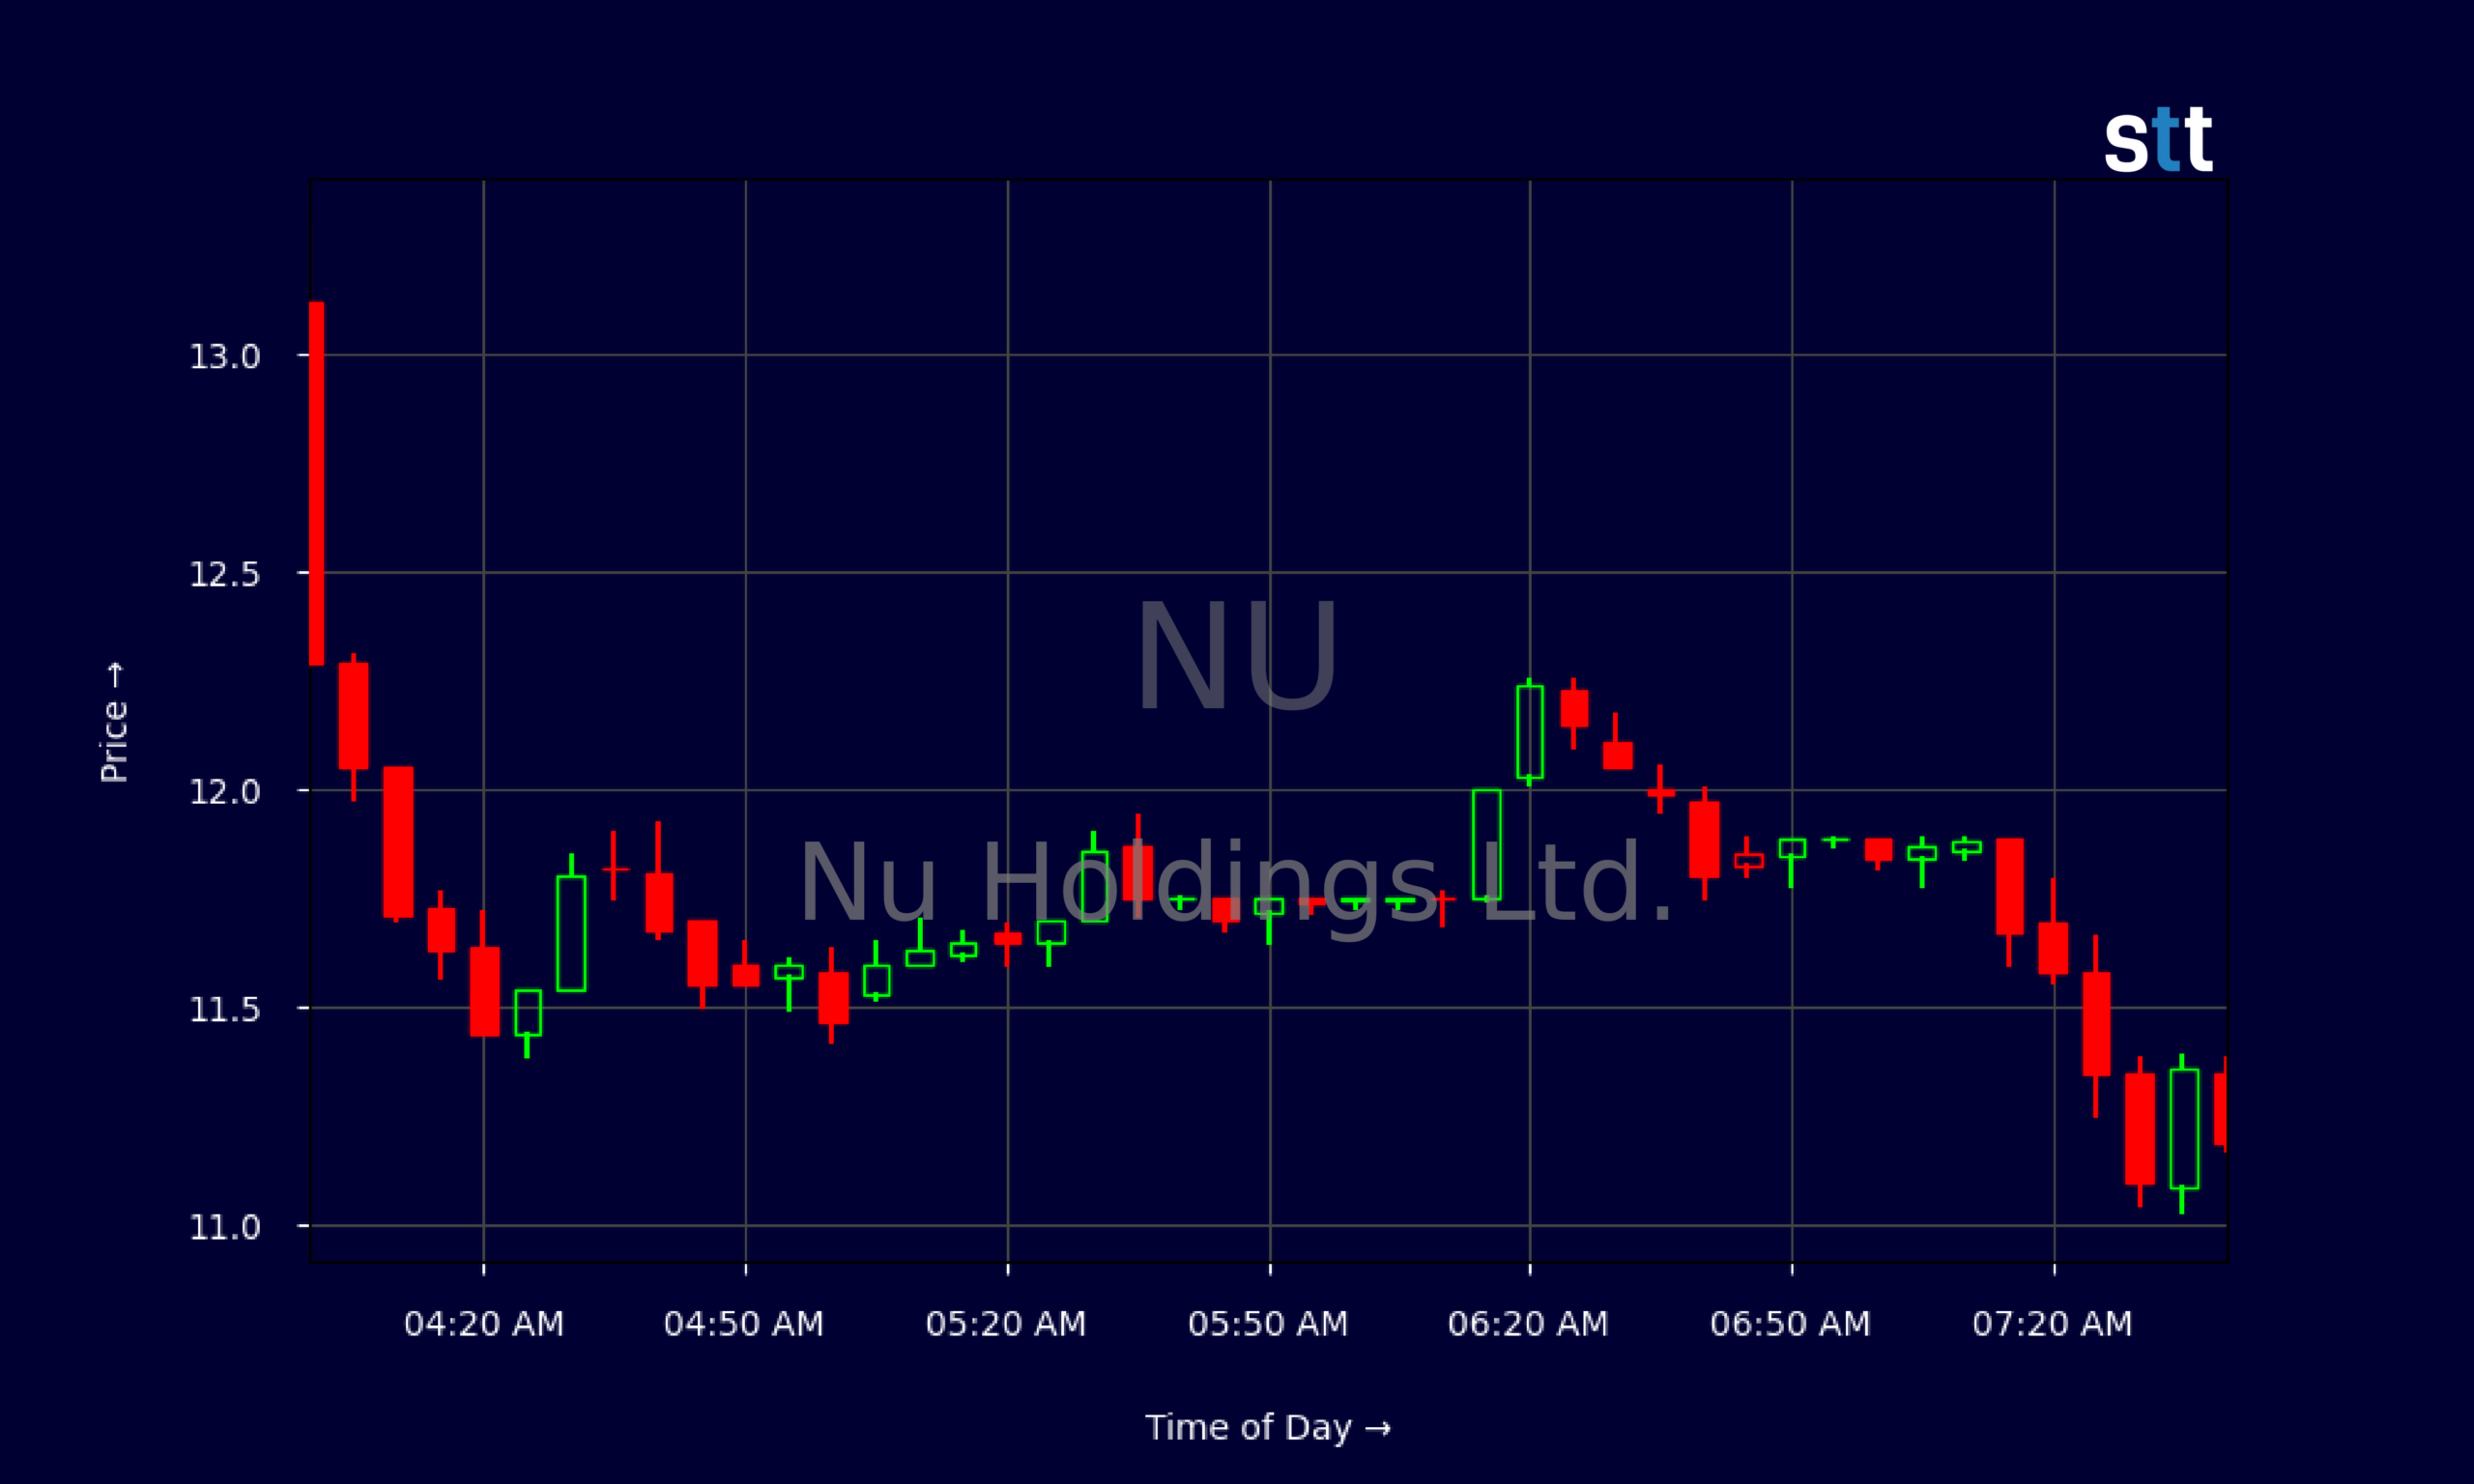
Live Update At 07:46:49 EDT: On Monday, October 26, 2026 Nu Holdings Ltd. stock [NYSE: NU] is trending down by -26.45%! Discover the key drivers behind this movement as well as our expert analysis in the detailed breakdown below.
Quick Financial Overview
NU has grown into a heavyweight in Latin American digital banking, and the numbers back that up. Nu Holdings Ltd. booked about $10.16B in revenue, with revenue per share around $2.65. That is real scale for a relatively young fintech, and traders know scale matters when markets get choppy.
On valuation, NU trades at roughly 7.7 times sales and about 6.9 times book value. For a traditional bank, that would be nosebleed territory. For a high-growth digital bank, it signals traders are still willing to pay up for future earnings power. The flip side is clear: if growth slows, NU can re-rate lower fast.
Profitability is still developing. NU’s pre-tax profit margin sits around -5.6%, and returns on equity and assets are slightly negative. Nu Holdings Ltd. is close to breakeven but not quite there yet, which is exactly the kind of profile momentum traders target before a major inflection.
More Breaking News
- FLG Stock Slips As BofA Slashes Q3 Earnings View
- ClearOne (CLRO) Stock Whipsaws As Traders Target Volatile Bounce
- TSLA Stock Rallies As FSD, Robotaxis And Energy Storage Ramp
- CTVA Stock Plunges As Vylor Spin-Off Triggers Massive Repricing
On the balance sheet, NU shows about $74.89B in total assets, $11.29B in equity, and leverage around 6.6 times. That level of leverage is typical for a bank model, but it demands tight risk control when markets turn.
Why Traders Are Watching NU’s Price Action
NU’s chart is doing what experienced traders like to see when a story matures: it is grinding higher, then starting to coil. On the daily chart, Nu Holdings Ltd. pushed from the low-$13s on 2026/10/01–02 up into the mid-$16s by 2026/10/12. Since then, NU has pulled back only modestly, holding the $14.50–$15.50 zone while still posting higher lows.
That kind of climb, followed by a sideways base, often sets up the next big move. NU closed at $15.16 on 2026/10/23, not far below the recent $16.19 high from 2026/10/12. The pullback has been controlled, with buyers repeatedly showing up near $14.50–$14.60. For Nu Holdings Ltd. bulls, that’s the line to defend. For short-biased traders, that’s the line to fade if it cracks.
Zoom in to the intraday action and you see the psychology in real time. NU opened at $13.12 on the session, spiked to $13.29, then sold down sharply into the low-$12s within the first hour. That early flush often shakes out weak hands. From there, intraday NU trading found its footing around $11.70–$11.90, bouncing but staying inside a tight band for several hours.
This type of intraday compression after a hard move is classic consolidation. Traders in NU are watching for a clean break of that band. A push back through the $12.20–$12.30 zone with volume would signal control shifting back to buyers. A fade under $11.50 would tell a very different story and open the door to a retest of prior daily support.
When you combine that intraday coil with the broader daily uptrend, NU becomes a textbook watch-list name for breakout and breakdown traders who respect risk.
Conclusion
NU sits at an interesting crossroads where growth, valuation, and price action are all colliding. Nu Holdings Ltd. is already generating more than $10B in annual revenue, with a big cash pile of roughly $16.14B and deep roots in one of the fastest-growing banking markets in the world. At the same time, NU is still running slightly negative on margins and returns, which keeps it squarely in “story stock” territory for active traders.
On the chart, NU has proven demand on dips, with the $14.50–$14.60 area acting as an important demand zone. The recent high in the low-$16s is the obvious upside trigger. Many NU traders will frame their plans between those levels: risk defined near support, potential reward toward or beyond that prior high. If Nu Holdings Ltd. breaks out with range expansion and heavy volume, momentum players will swarm. If it loses support with authority, short-biased traders will look for a fast unwind.
For newer market players watching NU, the lesson is bigger than one ticker. As Tim Sykes often says, “The market rewards prepared traders, not hopeful gamblers.” That lines up closely with another core trading principle: As Tim Bohen, lead trainer with StocksToTrade says, “I focus on what a stock is doing, not what I want it to do. Let the stock prove itself before you make a move.” NU is offering a clean real-time case study in that idea. Study the daily trend, dial into the intraday coils, define your risk, and remember this is educational and research-focused analysis only — not a signal to buy or sell Nu Holdings Ltd. or any other stock.
This is stock news, not investment advice. StocksToTrade News delivers real-time stock market updates tailored to highlight the key catalysts driving short-term price movements. Our coverage is designed for active traders and investors who thrive in fast-moving markets, with a focus on volatile sectors like penny stocks, AI stocks, Robinhood stocks and other momentum plays. From earnings reports and FDA approvals to mergers, new contracts, and unusual trading volume, we break down the events that can spark significant price action.
Looking to level up your trading game? Explore StocksToTrade, the ultimate platform for traders. With powerful tools designed for swing and day trading, integrated news scanning, and even social media monitoring, StocksToTrade keeps you one step ahead.
Check out our quick startup guide for new traders!
- How to Read Stock Charts: A Guide for Beginners
- Trading Plan: 6 Steps to Create One
- How To Create a Stock Watchlist
Ready to build your watchlists? Check out these curated lists:
Once your watchlist is set, take the next step and trade with confidence using StocksToTrade’s robust platform. Don’t miss out — grab your 14-day trial for just $7 and experience the edge you need to thrive in today’s fast-paced markets.