Nokia Corporation Sponsored stocks have been trading down by -11.95 percent amid bearish sentiment over weakening telecom equipment demand.
Click Here for a Millionaire's POV on Trading NOK
SUBSCRIBE FOR ALERTSJOIN 50,000+ ACTIVE TRADERS
Key Takeaways For NOK Traders
- Telecom equipment names, including Nokia (NOK) and Ericsson, dropped sharply on 2026/10/12, with NOK down roughly 3% among notable European ADR decliners.
- NOK ADRs fell about 3.2% on 2026/10/08, while the broader European ADR index slipped just 0.3%, flagging clear stock‑specific weakness.
- On 2026/10/15, NOK again declined as a subset of European ADRs sold off during an otherwise strong U.S. session for European stocks.
- Late September saw repeated NOK underperformance, with declines of roughly 1.1%–2.4% versus only slightly negative ADR benchmarks.
- Multiple late‑September and October reports show NOK frequently grouped with weak European telecom and tech ADRs in sharp down moves.
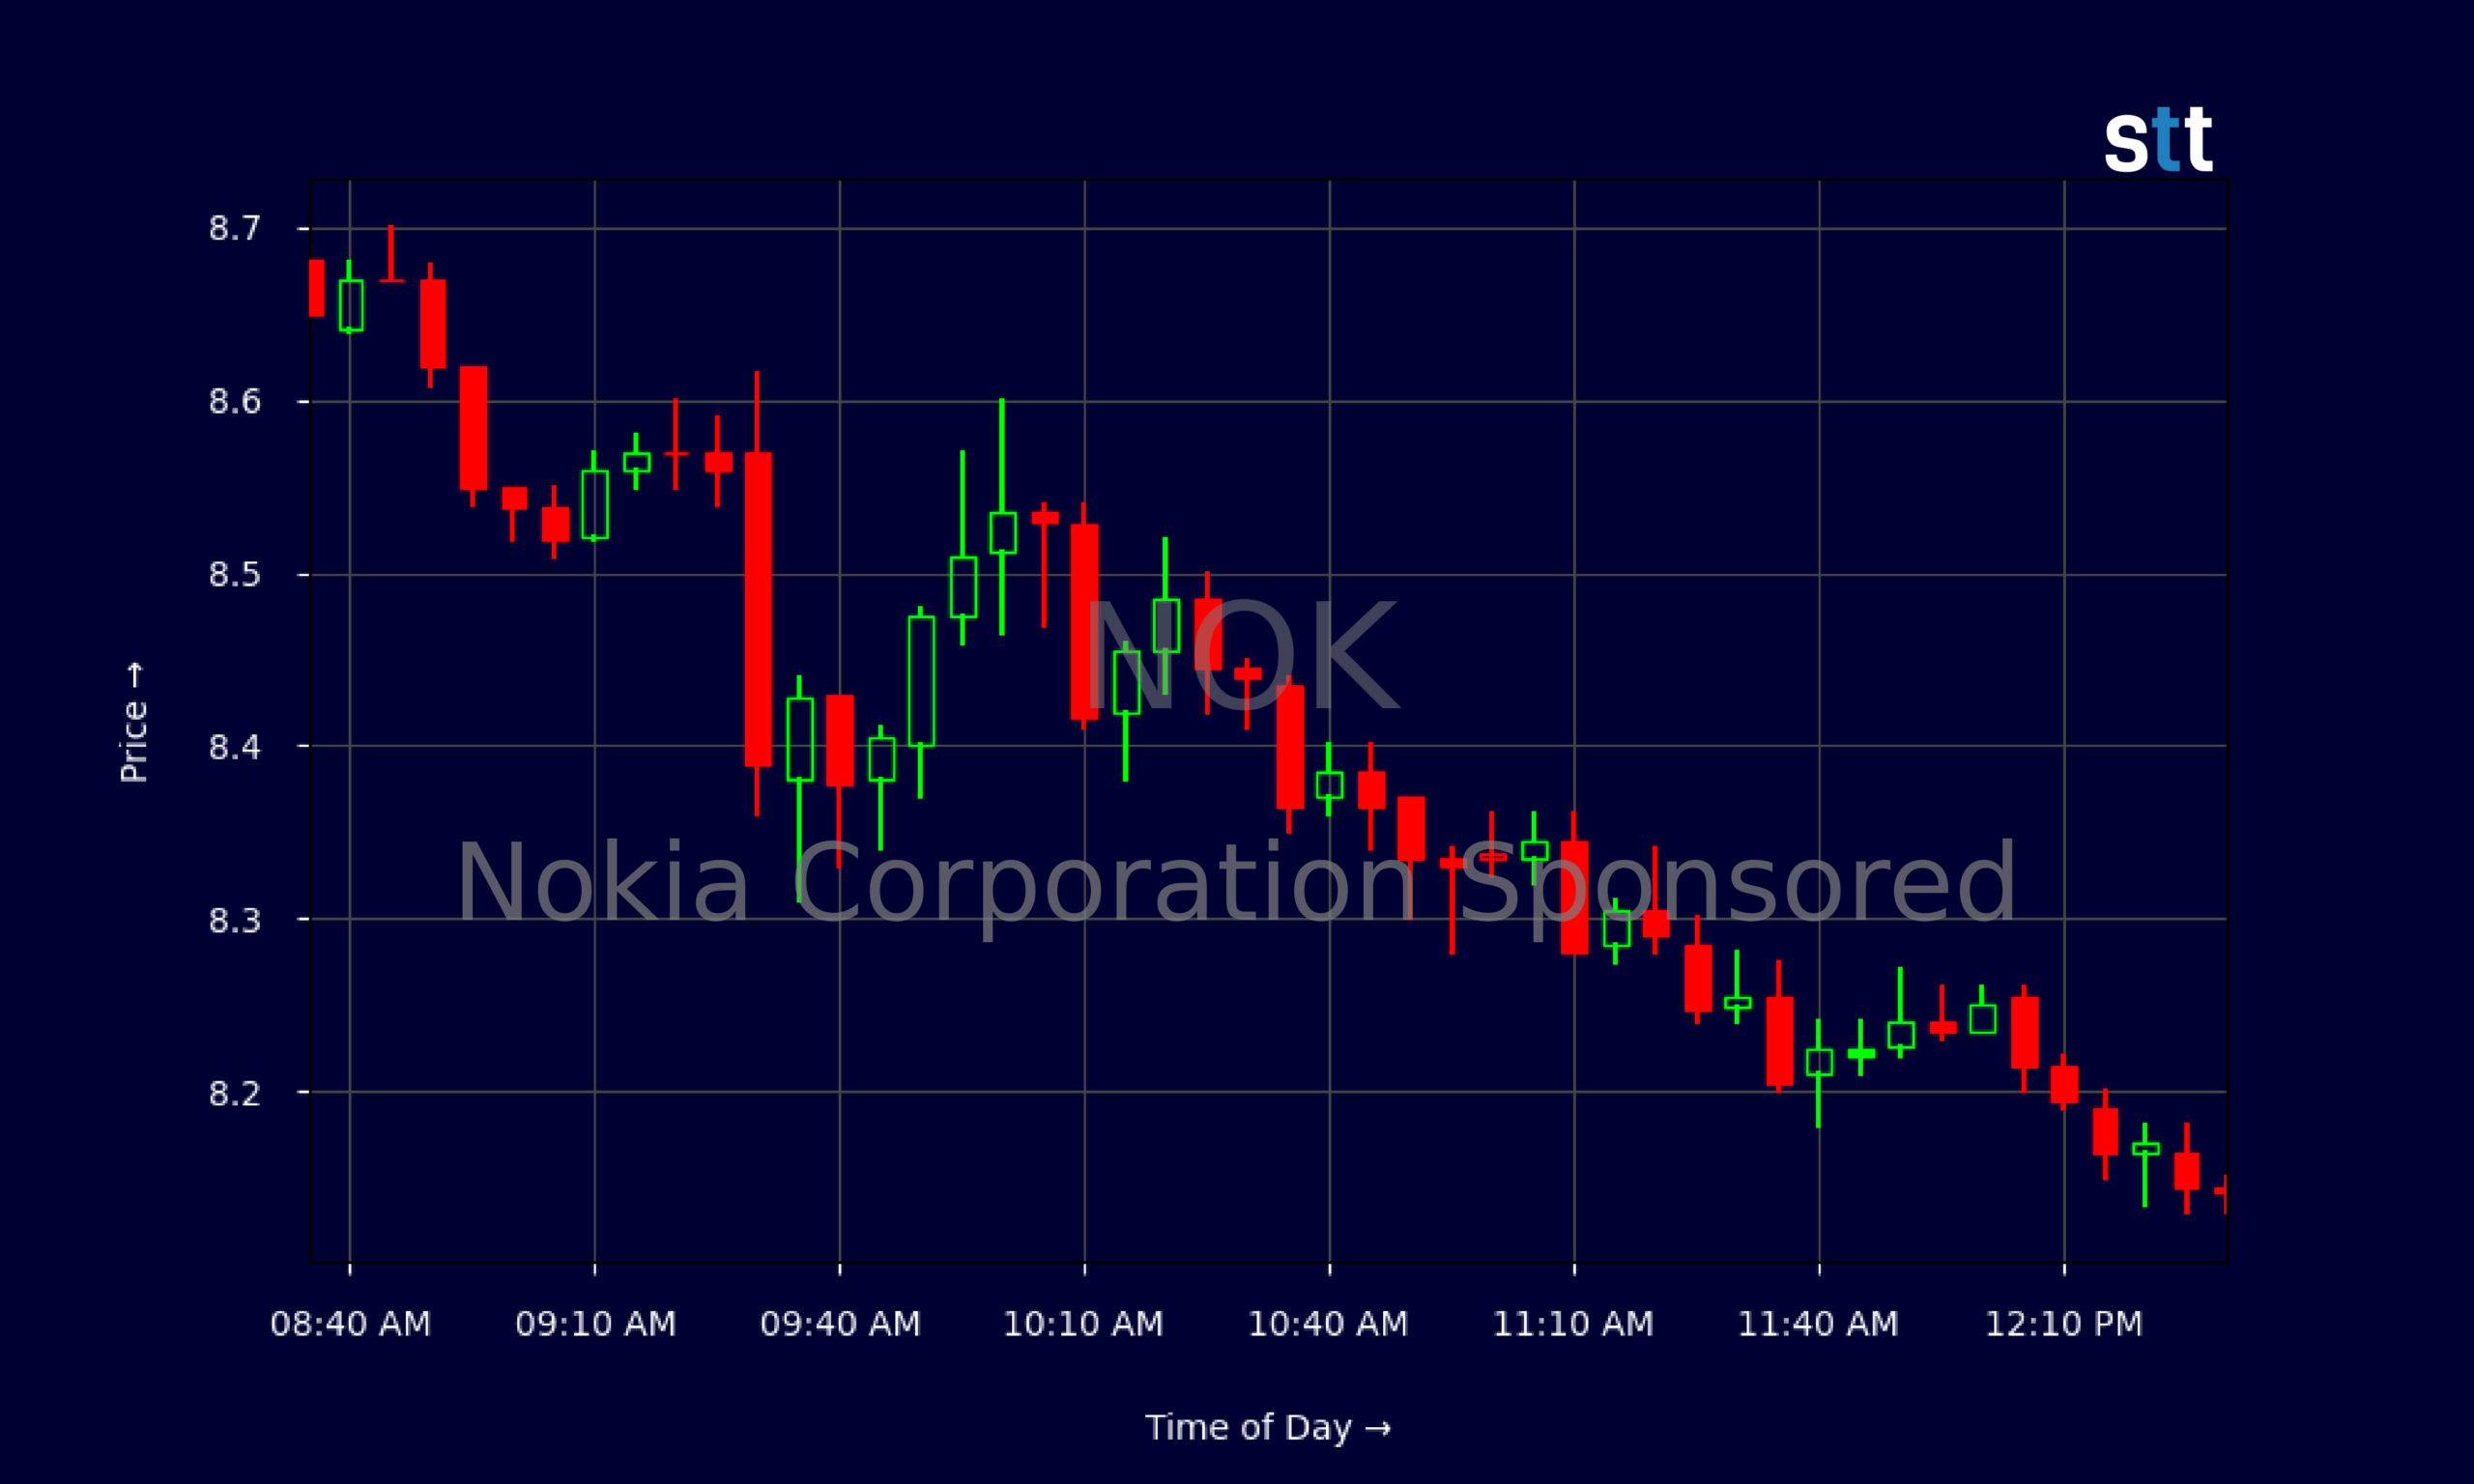
Live Update At 12:33:48 EDT: On Thursday, October 22, 2026 Nokia Corporation Sponsored stock [NYSE: NOK] is trending down by -11.95%! Discover the key drivers behind this movement as well as our expert analysis in the detailed breakdown below.
Quick Financial Overview
Nokia (NOK) is trading like a stock that lost its short‑term support. The daily chart shows NOK sliding from the $10.90 area on 2026/10/06 to about $8.14 by 2026/10/22. That’s roughly a 25% pullback in just over two weeks, a clear downtrend with lower highs and lower lows dominating the tape.
Intraday, the 5‑minute chart confirms the pressure. NOK opened near $8.57 and quickly washed into the low $8.30s, then drifted sideways between about $8.13 and $8.25. That’s classic bear‑flag action: early flush, weak bounces, no real bid stepping in.
More Breaking News
- OPEN Stock Drifts Lower As Traders Weigh Weak Margins
- TAL Stock Slides As Momentum Traders Watch Key Support
- WULF Stock Draws Bold Targets As Massive AI Power Deals Land
- RIG Stock Rises As Backlog And Valaris Deal Transform Outlook
Fundamentally, Nokia posted about $19.22B in revenue with a price‑to‑sales ratio near 2.58 and enterprise value around $58.51B. But the P/E around 74.4 tells traders the market is paying a rich multiple for relatively modest profitability, with pretax margin at 6.8% and return on equity near 5.82%. The balance sheet has around $5.46B in cash and $2.33B in long‑term debt, supported by equity of roughly $20.97B and a leverageratio of 1.8, so solvency is not the story here. For active traders, NOK is trading more on sentiment and sector momentum than on hard distress.
Why Traders Are Watching NOK’s Persistent Underperformance
NOK has not just pulled back with Europe; it has repeatedly stood out on the downside. On 2026/10/12, telecom equipment providers Nokia and Ericsson were called out among the notable continental European ADR decliners, with NOK dropping roughly 3%. When the market singles out the same names over and over, momentum traders pay attention.
Just a few days earlier, on 2026/10/08, Nokia ADRs sank about 3.2% while the broader European ADR index slipped only 0.3%. That is not a macro drift. That is targeted selling. For short‑bias traders, those are the days that confirm the trend. For long‑biased swing traders, they’re warning shots to stay cautious or tighten risk.
The pattern stretches back into late September. On 2026/09/28, NOK, along with Opera, SAP, and Materialise, declined between roughly 1.1% and 2.4%, underperforming a slightly negative S&P Europe Select ADR Index. A few days before, on 2026/09/24, Nokia appeared again in a group of European and UK/Irish ADRs that fell sharply while the overall ADR index was only marginally lower.
Even on 2026/10/15, when European stocks traded strongly in the U.S. session, a subset of ADRs, including Nokia, moved modestly to sharply lower. Add in the 2026/09/22 note that European telecom and tech ADRs — “particularly Ericsson and Nokia” — were underperforming, and a clear storyline emerges. NOK is consistently on the wrong side of sector flows.
For active trading, that consistency matters. NOK has become a go‑to name for momentum shorts and a name that longs need to treat like a broken chart until price action proves otherwise.
Conclusion
For traders analyzing NOK today, the message from both the news tape and the chart is the same: relative weakness rules. Nokia has been tagged repeatedly in October and late September as a laggard among European ADRs, often dropping much more than the broader indices on both red and green days. When a stock sells off hard in down markets and still can’t catch a bid in strong sessions, that’s character, not noise.
At the same time, Nokia’s financial base is not falling apart. NOK still shows billions in cash, manageable long‑term debt, and a sizable equity cushion. The issue for traders is not survival; it’s whether the current rich valuation and soft returns justify fresh buying when price momentum is clearly down.
Short‑term, NOK is a momentum and relative‑strength story, not a value story. Day traders can stalk clean intraday trends and weak bounces into prior support turned resistance. Swing traders can frame clear risk levels using recent highs near $9.50–$10 as lines in the sand, always respecting the downtrend until real accumulation shows up. As Tim Bohen, lead trainer with StocksToTrade says, “Success in trading is more about cutting losses quickly than finding winners.” That mindset is critical when dealing with a name like NOK that continues to show sustained weakness on the chart.
As Tim Sykes likes to remind traders, “The market doesn’t care about your opinion, only your discipline.” For Nokia (NOK), that means respecting the persistent selling, cutting losses fast, and letting the chart — not hope — dictate your next move.
This is stock news, not investment advice. StocksToTrade News delivers real-time stock market updates tailored to highlight the key catalysts driving short-term price movements. Our coverage is designed for active traders and investors who thrive in fast-moving markets, with a focus on volatile sectors like penny stocks, AI stocks, Robinhood stocks and other momentum plays. From earnings reports and FDA approvals to mergers, new contracts, and unusual trading volume, we break down the events that can spark significant price action.
Looking to level up your trading game? Explore StocksToTrade, the ultimate platform for traders. With powerful tools designed for swing and day trading, integrated news scanning, and even social media monitoring, StocksToTrade keeps you one step ahead.
Check out our quick startup guide for new traders!
- How to Read Stock Charts: A Guide for Beginners
- Trading Plan: 6 Steps to Create One
- How To Create a Stock Watchlist
Ready to build your watchlists? Check out these curated lists:
Once your watchlist is set, take the next step and trade with confidence using StocksToTrade’s robust platform. Don’t miss out — grab your 14-day trial for just $7 and experience the edge you need to thrive in today’s fast-paced markets.