
Netcapital Inc. stocks have been trading up by 32.48 percent amid heightened investor optimism from the most impactful news.
Click Here for a Millionaire's POV on Trading NCPL
SUBSCRIBE FOR ALERTSJOIN 50,000+ ACTIVE TRADERS
Key Takeaways
- NCPL has pulled back from recent highs near $2.66, closing at $1.57 after several choppy sessions and wide intraday ranges.
- Recent NCPL financials show tiny revenue of about $94,000 for the quarter against heavy operating costs, leading to sizeable losses.
- Netcapital Inc. reports negative free cash flow and a weak current ratio, signaling tight liquidity that active traders must respect.
- Despite deep losses, NCPL shows low debt and a price-to-book ratio under 1, drawing speculative small-cap trading interest.
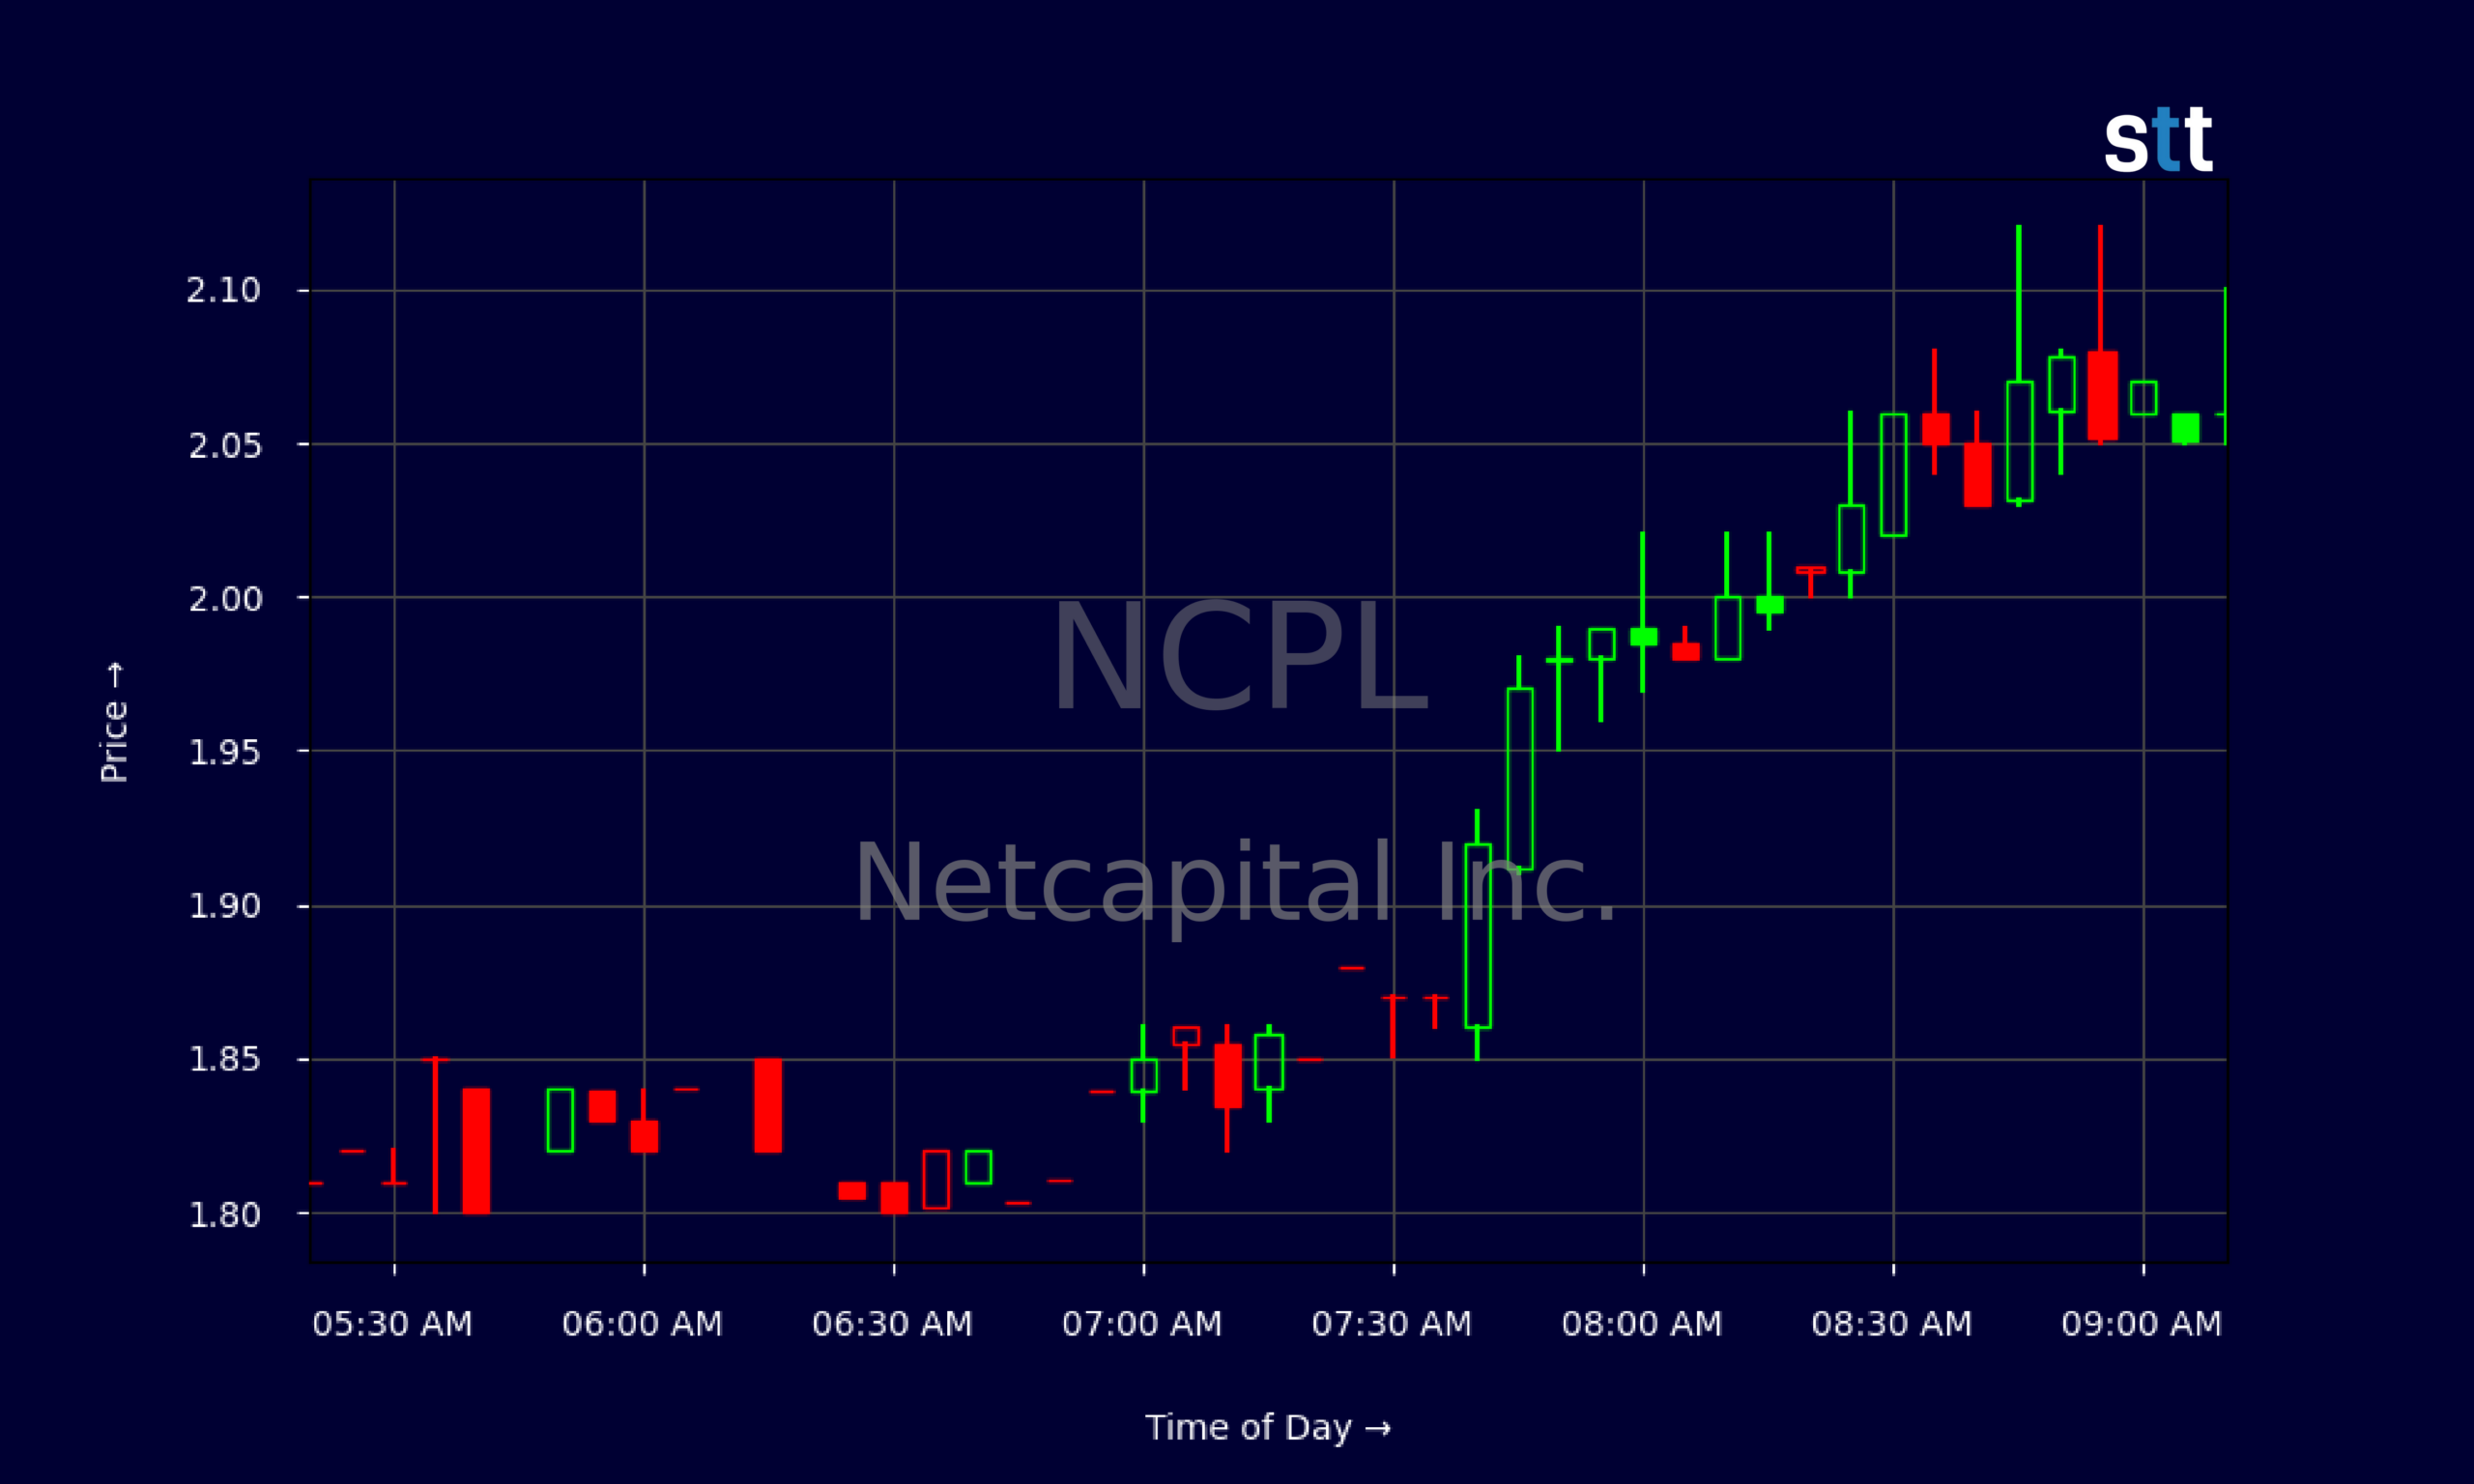
Live Update At 09:20:13 EDT: On Thursday, October 22, 2026 Netcapital Inc. stock [NASDAQ: NCPL] is trending up by 32.48%! Discover the key drivers behind this movement as well as our expert analysis in the detailed breakdown below.
Quick Financial Overview
NCPL is trading like a textbook high-risk, high-volatility small cap. Over the past few weeks, Netcapital Inc. ran from the low $1s to a spike high around $2.66, then faded back to a $1.57 close. That kind of range tells traders this is a pure trading vehicle, not a sleepy value play.
On the fundamentals, NCPL is lean on revenue and heavy on expenses. The latest quarter shows about $94,000 in total revenue while total expenses top $2.32M, driving a net loss near $1.81M and an EBITDA loss above $1.73M. Profit margins are massively negative, even though reported gross margin sits above 98% due to minimal direct costs.
More Breaking News
- POMDOCTOR LIMITED Rockets On Momentum As Traders Pile In
- CIFR Stock Slides As Massive Convertible Deal Fuels High-Stakes HPC Expansion
- Charles River Labs Stock Jumps As Street Hikes Targets
- SPCX Stock Eyes Mobile Breakout As AI Spending Soars
Cash flow for Netcapital Inc. paints a tough picture. Operating cash flow comes in roughly -$0.87M with free cash flow around -$0.97M. The balance sheet shows about $715,000 in cash against current liabilities of roughly $4.0M, leaving working capital deep in the red. With a current ratio near 0.3 and quick ratio near 0.2, NCPL has little cushion. That’s why price swings matter so much — the stock trades on sentiment and momentum, not steady earnings.
Why Traders Are Watching NCPL’s Volatility
Traders love a wild chart, and NCPL has delivered one. On the daily chart, Netcapital Inc. ran from roughly $1.08 on 2026/09/28 up to a sharp intraday high of $2.66 on 2026/10/12. That’s more than a 100% move in two weeks. Since then, the stock has been giving those gains back, closing most recently at $1.57 after a heavy red day that saw a high of about $2.34 and a low near $1.53.
This pattern — big spike, then grind lower — is classic in low-priced names with weak fundamentals. Early shorts and late longs battle it out while the chart builds lower highs. For NCPL, recent closes at $2.17, $1.98, $1.59, $1.54, and finally $1.57 show that price is struggling to reclaim the $2 area with any conviction.
Intraday, the 5‑minute data shows Netcapital Inc. steadily fading from premarket around $1.85–$1.90, then grinding up to about $2.12 before settling near $2.06–$2.07. The tape looks like a tug‑of‑war between dip‑buyers and unloaders into strength. For momentum traders, NCPL’s liquidity plus this intraday range can be attractive, but only with strict risk management.
Fundamentals add another layer. NCPL’s price-to-sales ratio above 12 and negative cash flow highlight how sensitive the stock is to any shift in sentiment. At the same time, a price-to-book ratio around 0.4 and low debt load give Netcapital Inc. just enough intrigue that some traders look for oversold bounces. This blend of weak earnings, tight cash, and explosive charts is why NCPL stays on many day trading watchlists.
Conclusion
NCPL sits at the intersection of pressure and opportunity. The company’s financials show a business that is far from break-even, with quarterly revenue below $0.1M, operating losses above $2.2M, and negative free cash flow. Liquidity is tight, as Netcapital Inc. carries a current ratio well under 1 and working capital firmly negative. Those numbers explain why the stock trades like a rollercoaster rather than a steady compounder.
On the chart, NCPL’s big move from near $1 to a $2.66 spike and back down toward the mid‑$1s tells traders exactly what this name is: a momentum vehicle. Netcapital Inc. can reward disciplined traders who nail entries and exits, but it can punish anyone who overstays a move or averages down blindly.
For newer traders, NCPL is a live case study in how price action often leads the story when fundamentals are weak. You plan the trade, set your risk, and respect your stops. As Tim Sykes loves to repeat, “Cut losses quickly — always.” As Tim Bohen, lead trainer with StocksToTrade says, “The best way to learn is by tracking trades, wins, losses, and lessons learned. Every trade has something to teach.”. With a stock like NCPL, that rule is not a suggestion; it’s survival. This article is for educational and research purposes only, and every trader must do independent work before making any trading decisions in Netcapital Inc.
This is stock news, not investment advice. StocksToTrade News delivers real-time stock market updates tailored to highlight the key catalysts driving short-term price movements. Our coverage is designed for active traders and investors who thrive in fast-moving markets, with a focus on volatile sectors like penny stocks, AI stocks, Robinhood stocks and other momentum plays. From earnings reports and FDA approvals to mergers, new contracts, and unusual trading volume, we break down the events that can spark significant price action.
Looking to level up your trading game? Explore StocksToTrade, the ultimate platform for traders. With powerful tools designed for swing and day trading, integrated news scanning, and even social media monitoring, StocksToTrade keeps you one step ahead.
Check out our quick startup guide for new traders!
- How to Read Stock Charts: A Guide for Beginners
- Trading Plan: 6 Steps to Create One
- How To Create a Stock Watchlist
Ready to build your watchlists? Check out these curated lists:
Once your watchlist is set, take the next step and trade with confidence using StocksToTrade’s robust platform. Don’t miss out — grab your 14-day trial for just $7 and experience the edge you need to thrive in today’s fast-paced markets.