
Nebius Group N.V. stocks have been trading down by -3.39 percent after reports of slowing cloud demand dampened growth expectations.
Click Here for a Millionaire's POV on Trading NBIS
SUBSCRIBE FOR ALERTSJOIN 50,000+ ACTIVE TRADERS
Key Takeaways
- Nebius Group is down about 4% premarket, giving back gains from the prior session amid a general retreat in Wallstreetbets favorites.
- Shares are down 2.1% premarket after nearly a 5% decline on Monday, highlighting continued weakness among WSB-discussed names.
- The stock is falling again pre-bell after a double-digit slide in the prior session, with no specific new catalyst mentioned.
- NBIS is down 1.7% premarket after a 1.5% loss in the prior session, signaling persistent selling pressure and deteriorating sentiment.
- Burry has replaced his short in Nebius with June put options, signaling a leveraged bearish stance on an AI-related name he views as overvalued.
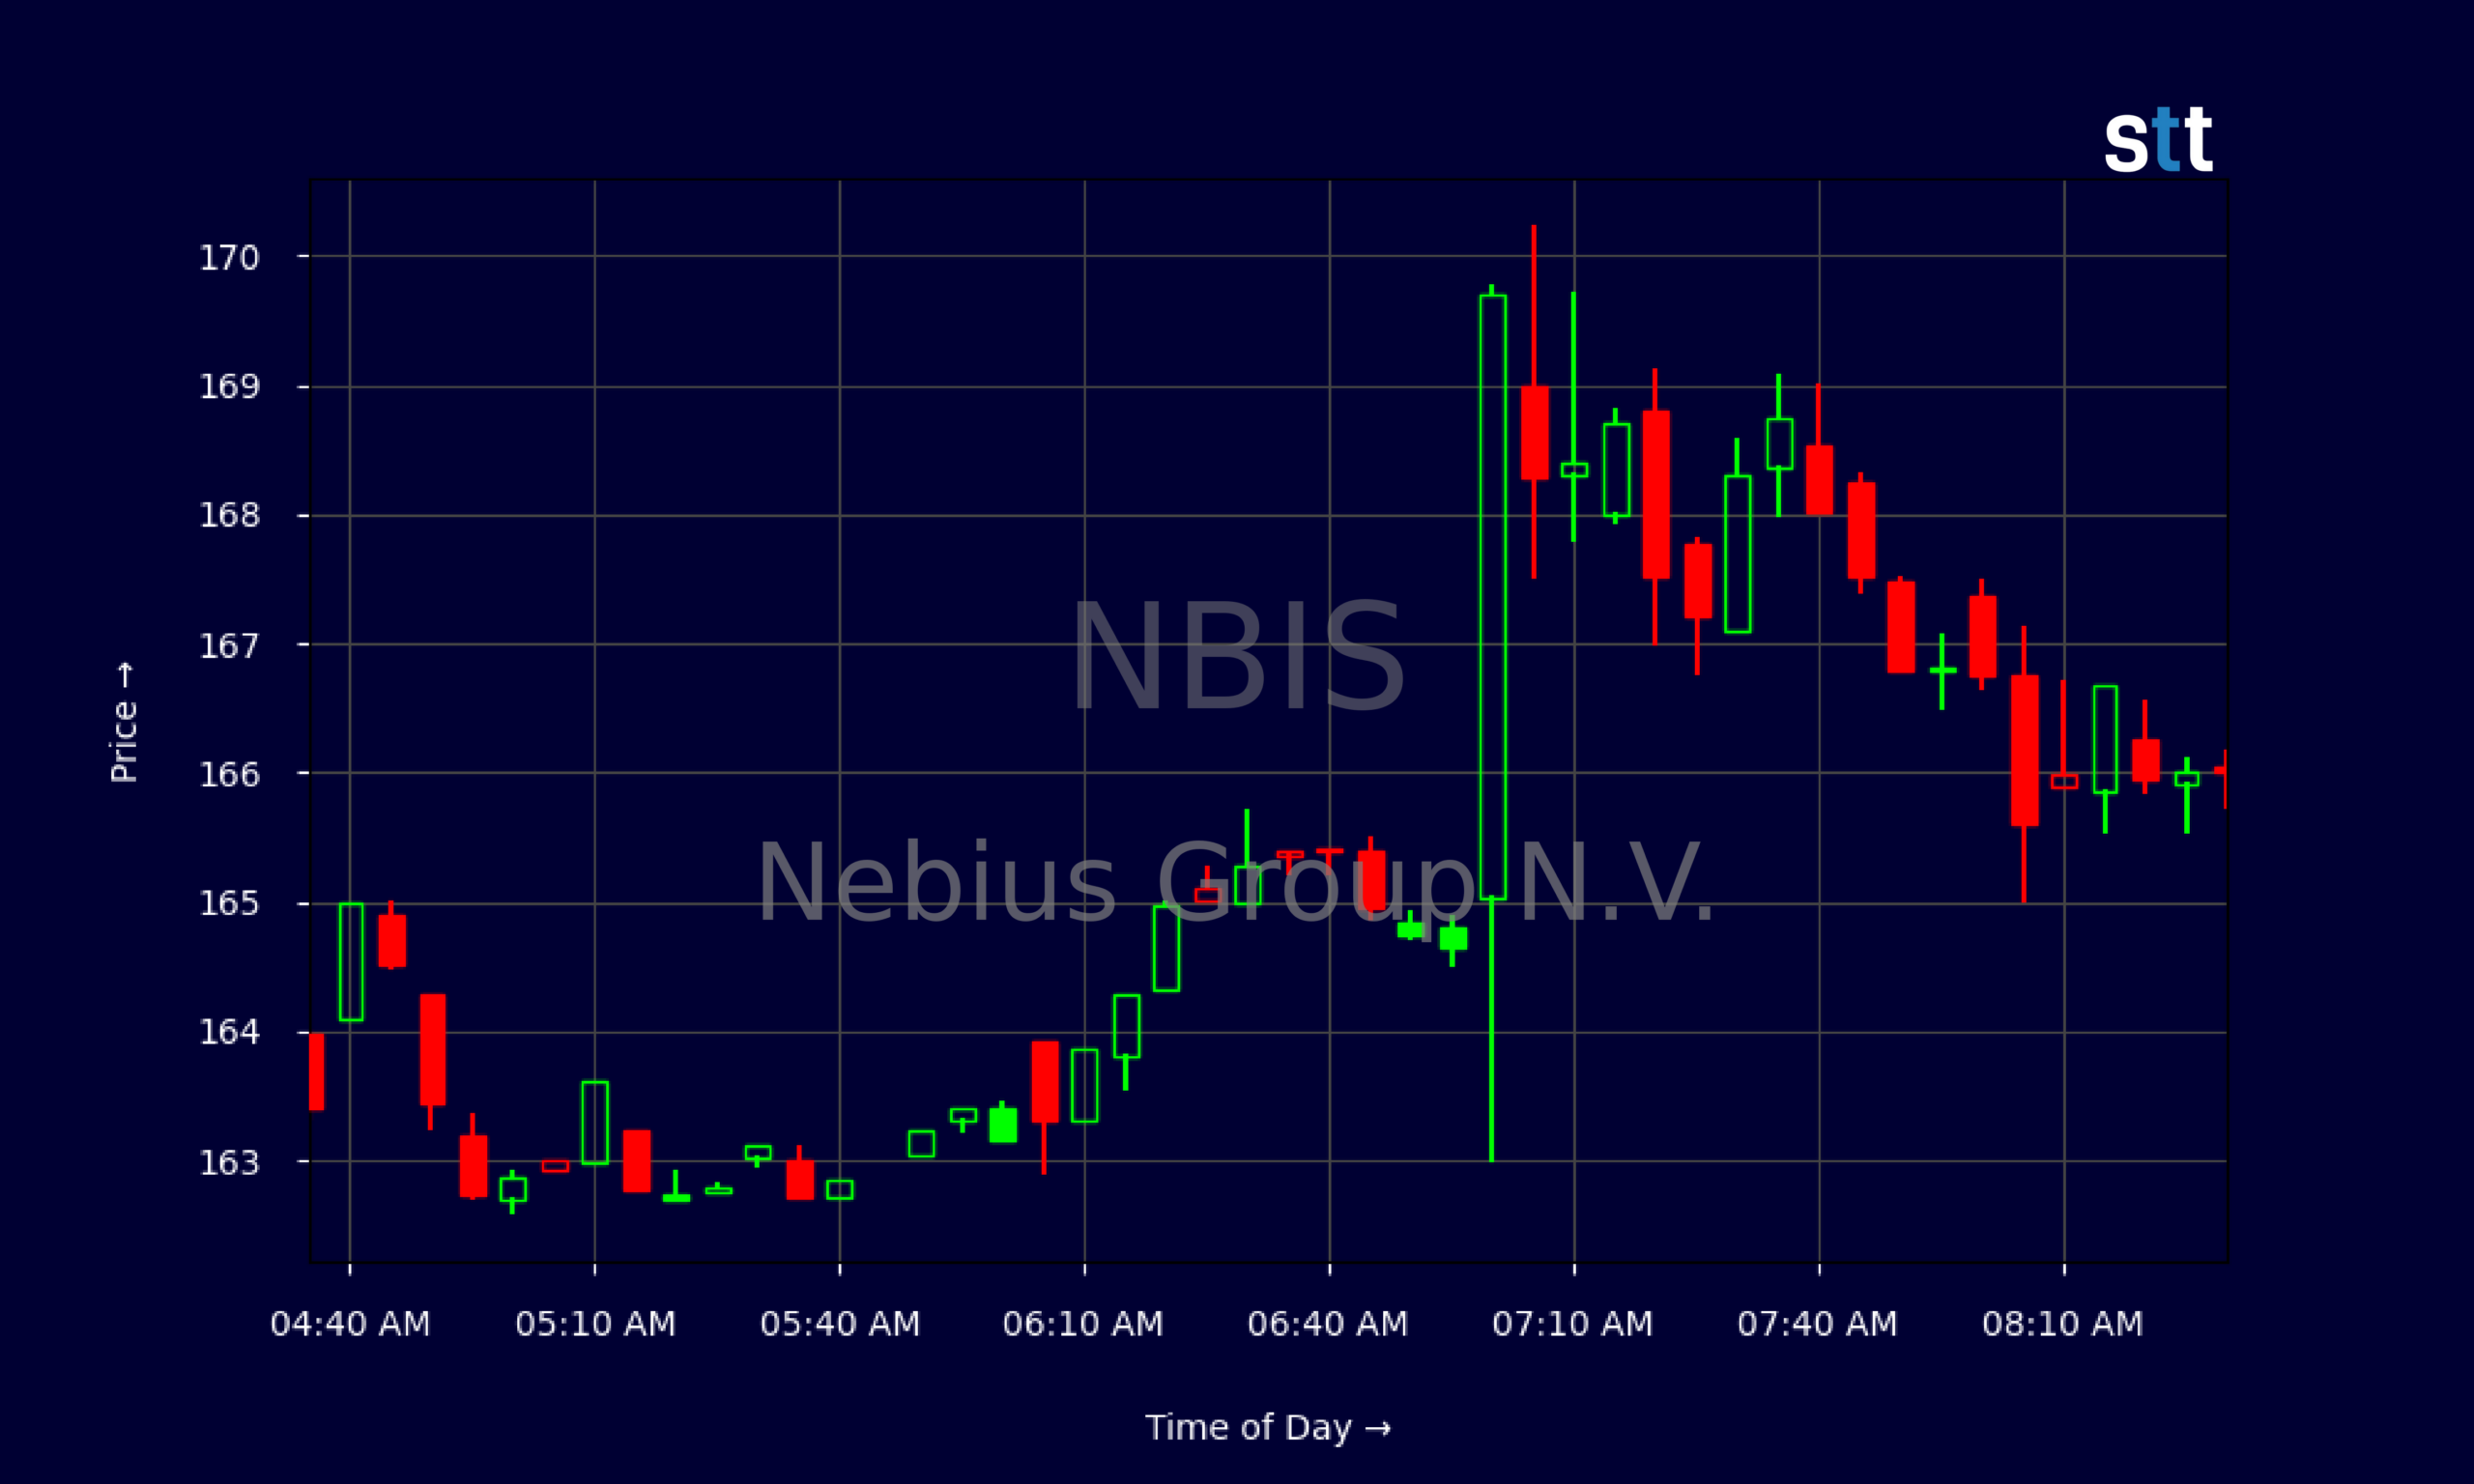
Live Update At 08:32:40 EDT: On Thursday, October 22, 2026 Nebius Group N.V. stock [NASDAQ: NBIS] is trending down by -3.39%! Discover the key drivers behind this movement as well as our expert analysis in the detailed breakdown below.
Quick Financial Overview
Nebius Group N.V. (NBIS) trades like a high‑expectation AI story stock sitting on a shaky foundation. Recent daily data shows NBIS sliding from the low $240s to the low $170s over the last several weeks, a steep drawdown that tells traders money is rotating out fast. The most recent close around $171 sits well below prior highs near $250, putting NBIS deep in a short‑term downtrend.
Intraday, the 5‑minute tape shows NBIS chopping between roughly $162 and $170 with tight ranges, suggesting heavy indecision after the bigger selloff. This is classic “cool‑down after the flush” action. For active traders, that often means fading bounces or waiting for a clean trend break rather than forcing trades in the middle of the range.
More Breaking News
- SKHY Stock Slides As China DRAM Fears Clash With AI Demand
- SSPC Leverage Shares 2X Short SPCX Daily Shows Volatile Turn
- Charles River Labs Stock Jumps As Street Hikes Targets
- SPCH Leverage Shares 2X Long SPCX Daily Draws Active Traders
On fundamentals, the numbers back up why NBIS trades like a speculation vehicle. Revenue sits around $529.8M, but the price‑to‑sales ratio is an extreme 9,546.51, and price‑to‑book is above 1,100. Those are nose‑bleed levels. Returns on assets and equity are negative, and the pretax margin is slightly below zero. NBIS has real assets and cash, but the market price assumes a huge future AI payoff that has not yet shown up in the income statement.
Why Traders Are Watching NBIS Volatility
NBIS is on every momentum trader’s radar right now because the stock is acting like a textbook Wallstreetbets favorite losing altitude. Over several recent premarket sessions, Nebius Group has posted steady hits: down 1.7% after a 1.5% drop the previous day, then another pre‑bell decline following a double‑digit slide, and a separate 2.1% premarket loss after nearly 5% down on Monday. That is not just noise. It is a pattern of controlled bleeding.
For NBIS traders, that pattern matters more than any single red candle. It signals that dip buyers are getting exhausted, while shorts grow more confident. Even when Nebius Group managed a modest 1%–4% rebound alongside other Wallstreetbets names on 2026/10/19, the move looks more like a dead‑cat bounce or short covering than a healthy trend change. The very next reading has Nebius Group down about 4% premarket again, giving back those gains almost immediately.
Layer on top the Burry development. When a high‑profile bear replaces a straight short with June put options on NBIS at double‑digit strikes, he is not backing off. He is pressing. That sends a strong message to the market that he sees Nebius Group as overvalued and overly tied to unproven AI revenue streams. For many short‑term traders, that kind of headline becomes a catalyst in itself.
At the same time, NBIS remains tightly linked to broader Wallstreetbets flows. When the WSB basket sells off, NBIS tends to slide with it; when the basket bounces, NBIS can spike quickly. That cohort correlation means traders in Nebius Group must watch not just the NBIS chart, but also sentiment across names like AMD, Micron, and Nvidia that move in the same speculative crowd.
Conclusion
Putting it all together, NBIS sits at the crossroads of hype and harsh reality. The chart shows a clear downtrend from the $230–$250 area into the $160–$170 zone, with repeated premarket gaps lower and only brief, shaky rebounds. Fundamentally, Nebius Group carries ultra‑rich valuation ratios despite thin profitability and negative returns on equity and assets. Those two forces—technical weakness and aggressive pricing—are now colliding in real time.
For active traders, NBIS becomes a case study in momentum trading discipline. This is not the stage to fall in love with a story. It is the stage to respect risk. As Tim Bohen, lead trainer with StocksToTrade says, “A good trade setup checks all the boxes—volume, trend, catalyst. Don’t trade if you’re missing pieces of the puzzle.” Choppy 5‑minute action around $165–$170 after heavy selling tells you big money is still debating where Nebius Group should settle. Until NBIS proves it can hold higher lows and reclaim key resistance levels, every bounce deserves skepticism.
Wallstreetbets chatter will keep dragging NBIS into the spotlight, and any sharp move—up or down—will tempt traders to size up. Remember the core rule Tim Sykes and the community hammer home: “Cut losses quickly, because big losses start out as small ones.” Use the NBIS tape, valuation, and sentiment—especially the Burry put stance—as educational signals. Treat Nebius Group N.V. as a live classroom on how momentum builds, breaks, and punishes traders who ignore risk management. This content is for educational and research purposes only, and every NBIS trade should be made with a clear plan and strict stop.
This is stock news, not investment advice. StocksToTrade News delivers real-time stock market updates tailored to highlight the key catalysts driving short-term price movements. Our coverage is designed for active traders and investors who thrive in fast-moving markets, with a focus on volatile sectors like penny stocks, AI stocks, Robinhood stocks and other momentum plays. From earnings reports and FDA approvals to mergers, new contracts, and unusual trading volume, we break down the events that can spark significant price action.
Looking to level up your trading game? Explore StocksToTrade, the ultimate platform for traders. With powerful tools designed for swing and day trading, integrated news scanning, and even social media monitoring, StocksToTrade keeps you one step ahead.
Check out our quick startup guide for new traders!
- How to Read Stock Charts: A Guide for Beginners
- Trading Plan: 6 Steps to Create One
- How To Create a Stock Watchlist
Ready to build your watchlists? Check out these curated lists:
Once your watchlist is set, take the next step and trade with confidence using StocksToTrade’s robust platform. Don’t miss out — grab your 14-day trial for just $7 and experience the edge you need to thrive in today’s fast-paced markets.