

Navan Inc. faces mounting investor concern as regulatory scrutiny intensifies, and its stocks have been trading down by -11.62 percent.
Market Insights For Active Traders
- Weekly chart shows NAVN sliding from a $25 spike back toward $20, flagging fading momentum after a sharp bounce.
- Intraday action with a drop from $21 to below $19 signals aggressive selling and fragile short-term support.
- Heavy quarterly revenue near $220.2M contrasts with a net loss, underscoring a profitability problem for Navan Inc.
- Strong cash and working capital give NAVN runway, but negative free cash flow keeps risk elevated for traders.
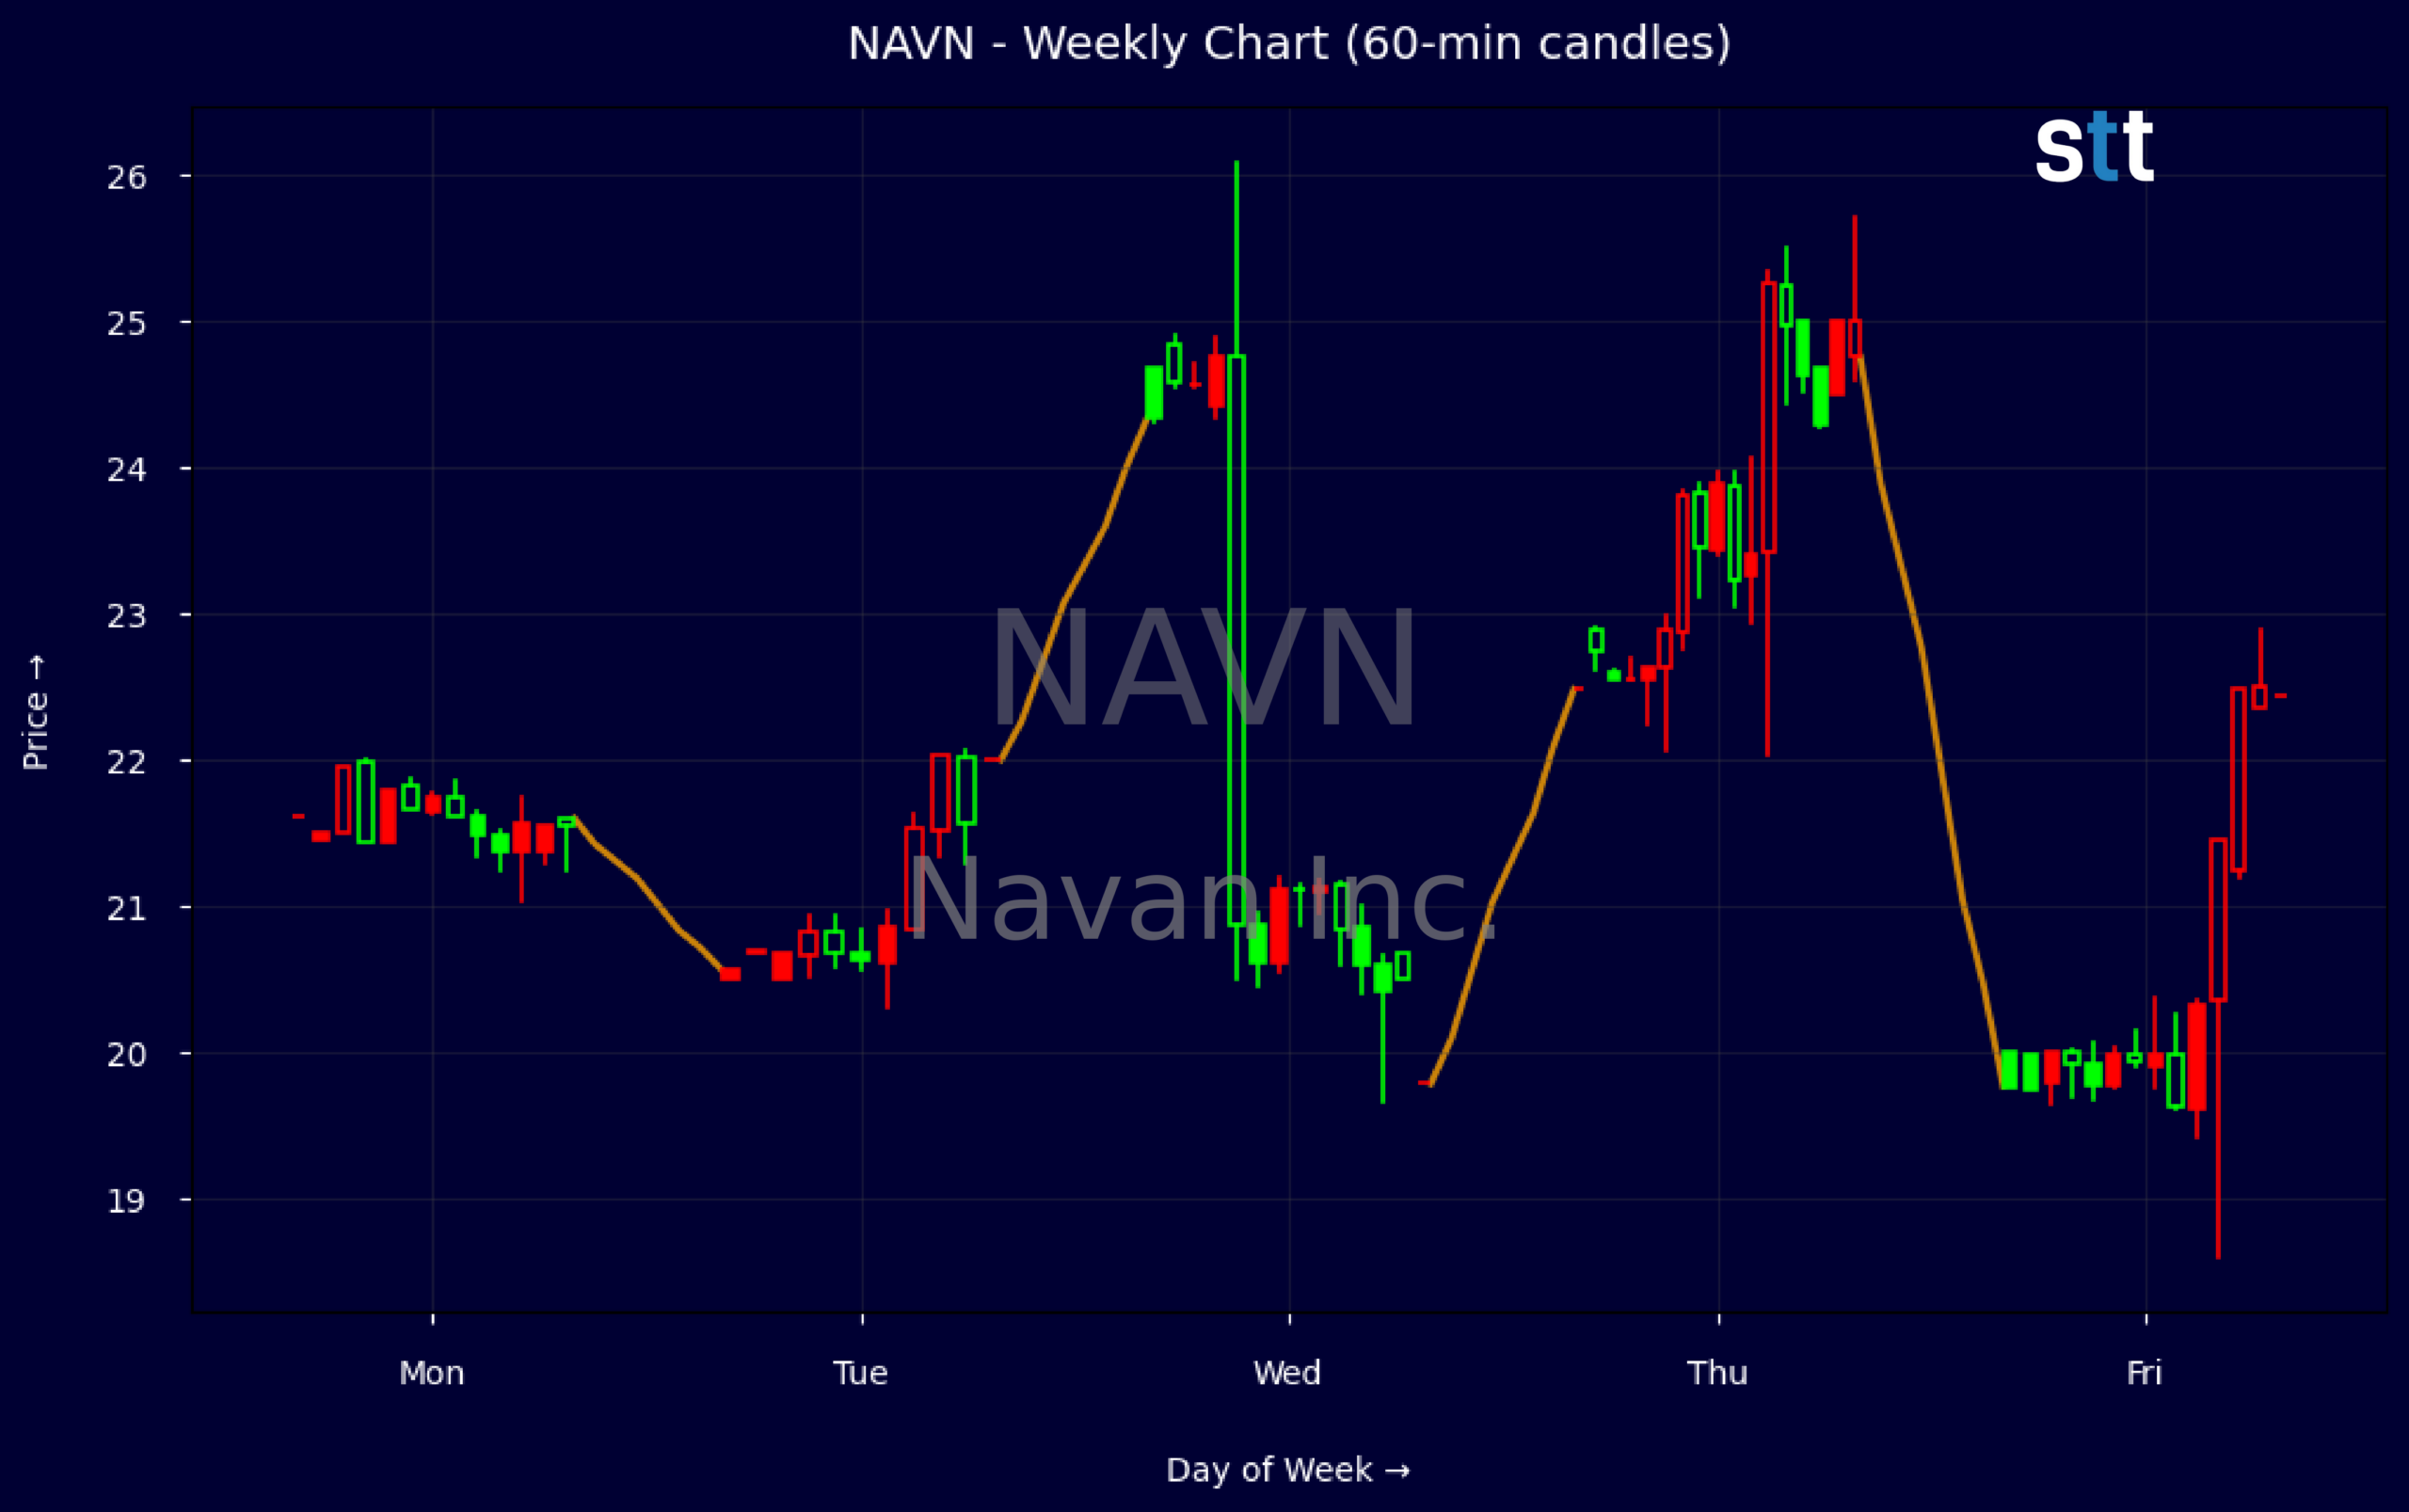
Weekly Update Jun 08 – Jun 12, 2026: On Saturday, June 13, 2026 Navan Inc. stock [NASDAQ: NAVN] is trending down by -11.62%! Discover the key drivers behind this movement as well as our expert analysis in the detailed breakdown below.
Technology industry expert:
Analyst sentiment – neutral
Navan (NAVN) is a sub-scale but recognized player in corporate travel and expense management, competing against Concur and newer fintech-native platforms. Revenue of ~$220M for the latest quarter annualizes near $900M, but profitability is weak: pretax margin is roughly -9%, with LTM pre‑tax margin around -82% and ROE at -19%. Cash burn is contained but real: Q1 operating cash flow was -$6.8M and free cash flow -$11.6M, offset by a robust $681M cash and investments and modest leverage (long-term debt only ~$34.5M, ~0.03x assets).
Technically, NAVN is volatile and in a short-term downtrend after failing to hold the spike to 25 on 260610. The subsequent lower closes at 22.76 and then 20 indicate aggressive supply and likely profit-taking above 22.50. The key actionable level is 20: it is both the most recent low/close and a psychological round number. A sustained break below 20 on rising volume opens downside toward the mid-teens; a reclaim and hold above 22.50 would negate the immediate bearish bias.
More Breaking News
- RIG Stock Climbs As Backlog And Valaris Deal Transform Outlook
- INSM Extends Brinsupri Global Reach As Traders Eye Guidance
- HL Stock Holds Support As Financial Strength Backs Consolidation
- WKHS Stock Draws Traders As EV Orders Grow And AI Pivot Emerges
With no incremental news, NAVN trades primarily on execution vs. growth expectations and broader Tech and Software & IT Services sentiment. Versus peers and sector benchmarks, NAVN is clearly earlier in its profitability journey but reasonably capitalized to fund several years of losses. I view risk/reward as skewed negatively near 22–25 until evidence of operating leverage improves. Near term, resistance sits at 22.50–25, support at 20 and then ~17; my 6–12 month bias is Neutral with a valuation overhang capped near the mid‑20s.
Quick Financial Overview
Navan Inc. is printing solid top-line numbers but struggling to turn that scale into profit. Quarterly revenue of about $220.2M sits against a pretax margin near -81.6% and a net income loss of roughly $20.5M. For traders, that mix of strong sales and negative earnings typically creates a battleground stock where sentiment can flip quickly on any sign of cost control or further cash burn.
The balance sheet, however, tells a more stable story. Total assets around $1.71B and equity of roughly $1.24B leave Navan Inc. with a sizable cushion. Cash and short-term investments of about $680.6M, plus working capital near $1.01B, suggest NAVN is not under immediate financial stress. Leverage looks moderate with long-term debt of roughly $34.5M and a leverage ratio of 1.4, giving management time to work on the expense base.
Cash flow and price action are where traders need to stay sharp. Operating cash flow is negative at about -$6.8M for the quarter, and free cash flow is deeper at roughly -$11.6M, driven by investment and technology spend. On the chart, the weekly candles show NAVN spiking from the low $20s to near $25, then fading back toward $20. Intraday, the 5-minute bar dropping from about $20.75–$21 down to the high $18s in a single session highlights how quickly bids can vanish when sellers press.
Conclusion
Navan Inc. sits in a typical growth-through-pain phase where revenue strength meets persistent losses, and that is exactly the kind of setup short-term traders gravitate toward. The latest quarter shows solid sales around $220.2M and decent gross profit, but negative margins, a return on equity near -19.3%, and free cash flow at roughly -$11.6M keep the risk side of the ledger heavy. For NAVN, the strong cash pile and over $1.0B in working capital provide oxygen, yet the clock is always ticking when operating cash flow stays red.
On the tape, NAVN’s recent surge toward $25 followed by a slide back to roughly $20 signals a failed breakout and a market that is not ready to pay up until it sees better operating leverage. The intraday flush from the low $20s into the high $18s shows supply still in control on pops, which matters for any bounce trades or short-covering squeezes. Traders tracking Navan Inc. should focus on how price reacts around the $20 area and whether volume confirms any attempt to reclaim the mid-$20s.
For educational purposes, the risk/reward picture is simple: strong balance sheet plus high revenue growth potential versus ongoing losses and negative cash flow. Short-term setups will likely revolve around support and resistance near those recent highs and lows, with catalysts driven by any sign of margin improvement or further deterioration. As Tim Bohen, lead trainer with StocksToTrade says, “There’s a pattern in everything; you just have to stick around long enough to see it.” That’s why short-term NAVN trading plans should be built around repeatable price and volume behaviors rather than narratives about the company’s future. As I tell my students, “Your edge in a stock like NAVN comes from reading the tape around key levels, not from believing a story — trade the reaction, not the hope.””,”scores”:{“risk-level”:”high”},”trade”:”false
This is stock news, not investment advice. StocksToTrade News delivers real-time stock market updates tailored to highlight the key catalysts driving short-term price movements. Our coverage is designed for active traders and investors who thrive in fast-moving markets, with a focus on volatile sectors like penny stocks, AI stocks, Robinhood stocks and other momentum plays. From earnings reports and FDA approvals to mergers, new contracts, and unusual trading volume, we break down the events that can spark significant price action.
Looking to level up your trading game? Explore StocksToTrade, the ultimate platform for traders. With powerful tools designed for swing and day trading, integrated news scanning, and even social media monitoring, StocksToTrade keeps you one step ahead.
Check out our quick startup guide for new traders!
- How to Read Stock Charts: A Guide for Beginners
- Trading Plan: 6 Steps to Create One
- How To Create a Stock Watchlist
Ready to build your watchlists? Check out these curated lists:
Once your watchlist is set, take the next step and trade with confidence using StocksToTrade’s robust platform. Don’t miss out — grab your 14-day trial for just $7 and experience the edge you need to thrive in today’s fast-paced markets.